How do you check the size of tables and schemas in PostgreSQL?
Run SELECT pg_size_pretty(pg_total_relation_size('schema.table')) for one table including its indexes and TOAST data, or sum pg_total_relation_size(oid) across pg_class grouped by pg_namespace for a whole schema. Partitioned parents report 0 bytes, so sum their children via pg_inherits. Size includes bloat, so it is not the same as live data.
Key facts
| Fact | Value | |---|---| | pg_relation_size(rel) | Main fork only by default; pass 'fsm', 'vm' or 'init' for the other forks (docs) | | pg_table_size(rel) | All forks of the table plus its TOAST table, no indexes (docs) | | pg_indexes_size(rel) | Every index attached to the table (docs) | | pg_total_relation_size(rel) | pg_table_size + pg_indexes_size (docs) | | Partitioned parent | Stores no rows itself, so every size function returns 0 for the parent (docs) | | TOAST threshold | Values are compressed or moved out-of-line once a row exceeds ~2 kB (TOAST_TUPLE_THRESHOLD) (docs) | | Fleet data | Across 50 monitored instances, 24% fail the table-bloat check (B3) and 44% fail the index-bloat check (B4) |
Why this happens
A PostgreSQL table is not one file. The heap is stored in a main fork, and alongside it sit a free space map (_fsm) and a visibility map (_vm). Wide values are compressed or moved into a separate TOAST table in the pg_toast schema, which has its own index. Every index on the table is a further relation with its own files. Each file is also split into 1 GB segments on disk, which is why ls in the data directory is a poor way to size anything (file layout).
The four size functions differ only in which of those pieces they add up:
pg_relation_size(rel)returns one fork. With no second argument it is the main fork, so it undercounts anything with wide columns because the TOAST bytes live elsewhere.pg_table_size(rel)adds the FSM, VM and the TOAST table (and its index), but still excludes your own indexes.pg_indexes_size(rel)is the sum of every index on the table.pg_total_relation_size(rel)is the number people usually mean by "table size": everything above combined. The documentation defines it as exactlypg_table_size + pg_indexes_size.
pg_size_pretty(bigint) converts bytes into kB, MB, GB and so on for display. Keep the raw bytes for sorting and arithmetic; ordering by the pretty string sorts alphabetically.
Two things make the raw number misleading. First, a partitioned table holds no data in the parent relation, so pg_total_relation_size('orders') returns 0 even when the partitions hold terabytes; you have to walk pg_inherits and sum the children. Second, size counts every page the relation owns, whether or not it contains a live row. Dead tuples left by UPDATE and DELETE are reclaimed for reuse by VACUUM but the file only shrinks when trailing pages are empty, so a table that once held 100 GB and now holds 10 GB of live rows can still report 100 GB. That gap is bloat, covered in How do you detect table bloat and dead tuples in PostgreSQL?. Across 50 monitored instances, 24% fail the table-bloat check and 44% fail the index-bloat check, so the "size" you see is often materially larger than the data it holds.
How to detect it
One table, all four numbers
SELECT pg_size_pretty(pg_relation_size('public.orders'))       AS heap_main_fork,
       pg_size_pretty(pg_table_size('public.orders'))          AS table_incl_toast,
       pg_size_pretty(pg_indexes_size('public.orders'))        AS indexes,
       pg_size_pretty(pg_total_relation_size('public.orders')) AS total;
Expected output looks like 1843 MB | 2210 MB | 1602 MB | 3812 MB. The gap between the first two columns is TOAST plus the FSM and VM; if it is large, the table has wide text, jsonb or bytea columns being stored out-of-line.
Top 20 tables by total size, with index share
SELECT n.nspname AS schema_name,
       c.relname AS table_name,
       pg_size_pretty(pg_table_size(c.oid))           AS table_size,
       pg_size_pretty(pg_indexes_size(c.oid))         AS index_size,
       pg_size_pretty(pg_total_relation_size(c.oid))  AS total_size,
       round(100.0 * pg_indexes_size(c.oid)
             / NULLIF(pg_total_relation_size(c.oid), 0), 1) AS index_pct
FROM pg_class c
JOIN pg_namespace n ON n.oid = c.relnamespace
WHERE c.relkind IN ('r', 'm')                      -- ordinary tables and materialized views
  AND n.nspname NOT IN ('pg_catalog', 'information_schema')
  AND n.nspname NOT LIKE 'pg_toast%'
ORDER BY pg_total_relation_size(c.oid) DESC
LIMIT 20;
Read index_pct as a hint: a table where indexes are 60% or more of the total usually has redundant or unused indexes, which are cheap to find with pg_stat_user_indexes. Across 31 monitored instances, 67.7% fail the duplicate-indexes check and 58.1% fail the unused-indexes check, so this is the common case rather than the exception. relkind = 'r' skips partitioned parents ('p'), which would otherwise appear as 0-byte rows.
Per-schema totals
SELECT n.nspname AS schema_name,
       count(*)                                                    AS relations,
       pg_size_pretty(sum(pg_table_size(c.oid)))                   AS tables,
       pg_size_pretty(sum(pg_indexes_size(c.oid)))                 AS indexes,
       pg_size_pretty(sum(pg_total_relation_size(c.oid)))          AS total,
       sum(pg_total_relation_size(c.oid))                          AS total_bytes
FROM pg_class c
JOIN pg_namespace n ON n.oid = c.relnamespace
WHERE c.relkind IN ('r', 'm')
  AND n.nspname NOT IN ('pg_catalog', 'information_schema')
  AND n.nspname NOT LIKE 'pg_toast%'
GROUP BY n.nspname
ORDER BY total_bytes DESC;
The pg_toast exclusion matters. TOAST tables are real relations in their own schema, and pg_table_size already counts them against their owning table. Include the schema and you double-count every out-of-line value. The same goes for the pg_total_relation_size(c.oid) sum: because it is evaluated per ordinary table, partitions are counted once each under their own schema and the parent contributes nothing.
Partitioned tables, summed across children
SELECT parent.relname AS partitioned_table,
       count(child.oid) AS partitions,
       pg_size_pretty(sum(pg_total_relation_size(child.oid))) AS total
FROM pg_inherits i
JOIN pg_class parent ON parent.oid = i.inhparent
JOIN pg_class child  ON child.oid  = i.inhrelid
WHERE parent.relkind = 'p'
GROUP BY parent.relname
ORDER BY sum(pg_total_relation_size(child.oid)) DESC;
This handles one level of partitioning. For sub-partitioned tables use a recursive CTE over pg_inherits, or pg_partition_tree() (docs), which lists every descendant with its level.
Growth over time: a daily snapshot table
None of the functions above remember yesterday. Create a small table and populate it once a day from cron, pg_cron or whatever scheduler you already run:
CREATE TABLE IF NOT EXISTS relation_size_snapshots (
    snapshot_date       date    NOT NULL DEFAULT current_date,
    schema_name         text    NOT NULL,
    table_name          text    NOT NULL,
    table_size_bytes    bigint  NOT NULL,
    index_size_bytes    bigint  NOT NULL,
    total_size_bytes    bigint  NOT NULL,
    PRIMARY KEY (snapshot_date, schema_name, table_name)
);

INSERT INTO relation_size_snapshots (schema_name, table_name, table_size_bytes, index_size_bytes, total_size_bytes)
SELECT n.nspname, c.relname,
       pg_table_size(c.oid), pg_indexes_size(c.oid), pg_total_relation_size(c.oid)
FROM pg_class c
JOIN pg_namespace n ON n.oid = c.relnamespace
WHERE c.relkind IN ('r', 'm')
  AND n.nspname NOT IN ('pg_catalog', 'information_schema')
  AND n.nspname NOT LIKE 'pg_toast%'
ON CONFLICT DO NOTHING;
Then the seven-day growth per table is a self-join:
SELECT today.schema_name, today.table_name,
       pg_size_pretty(today.total_size_bytes)                          AS now,
       pg_size_pretty(today.total_size_bytes - week.total_size_bytes)  AS growth_7d
FROM relation_size_snapshots today
JOIN relation_size_snapshots week
  ON week.schema_name = today.schema_name AND week.table_name = today.table_name
 AND week.snapshot_date = today.snapshot_date - 7
WHERE today.snapshot_date = current_date
ORDER BY today.total_size_bytes - week.total_size_bytes DESC
LIMIT 20;
A note on cost: every size function stats the files on disk, one call per fork per segment. On a database with a few hundred relations that is instant. On a catalog with hundreds of thousands of partitions or TOAST tables, the top-20 query can take seconds and touch every file handle, so run it from a scheduler rather than a dashboard refresh. For the whole-database number, How do I check the total size of a PostgreSQL database? covers pg_database_size, which is far cheaper than summing relations.
How MyDBA shows this
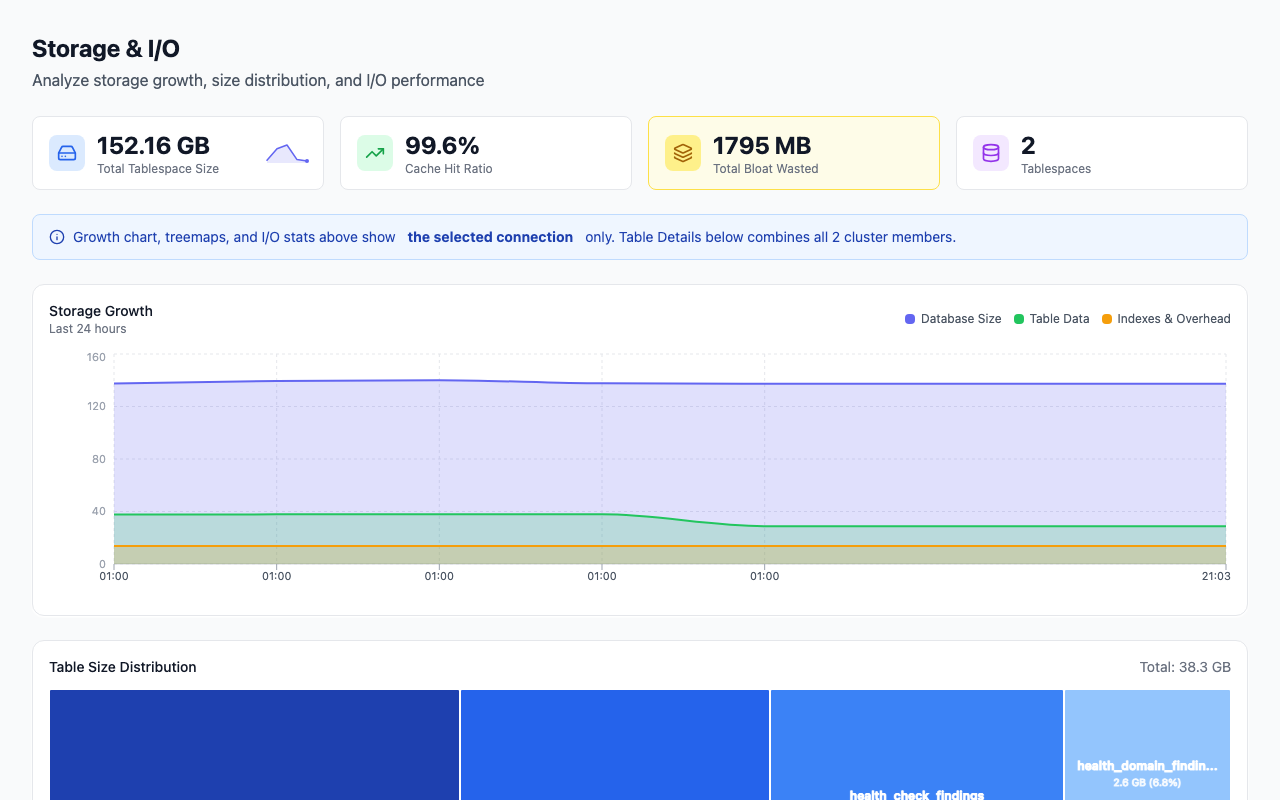
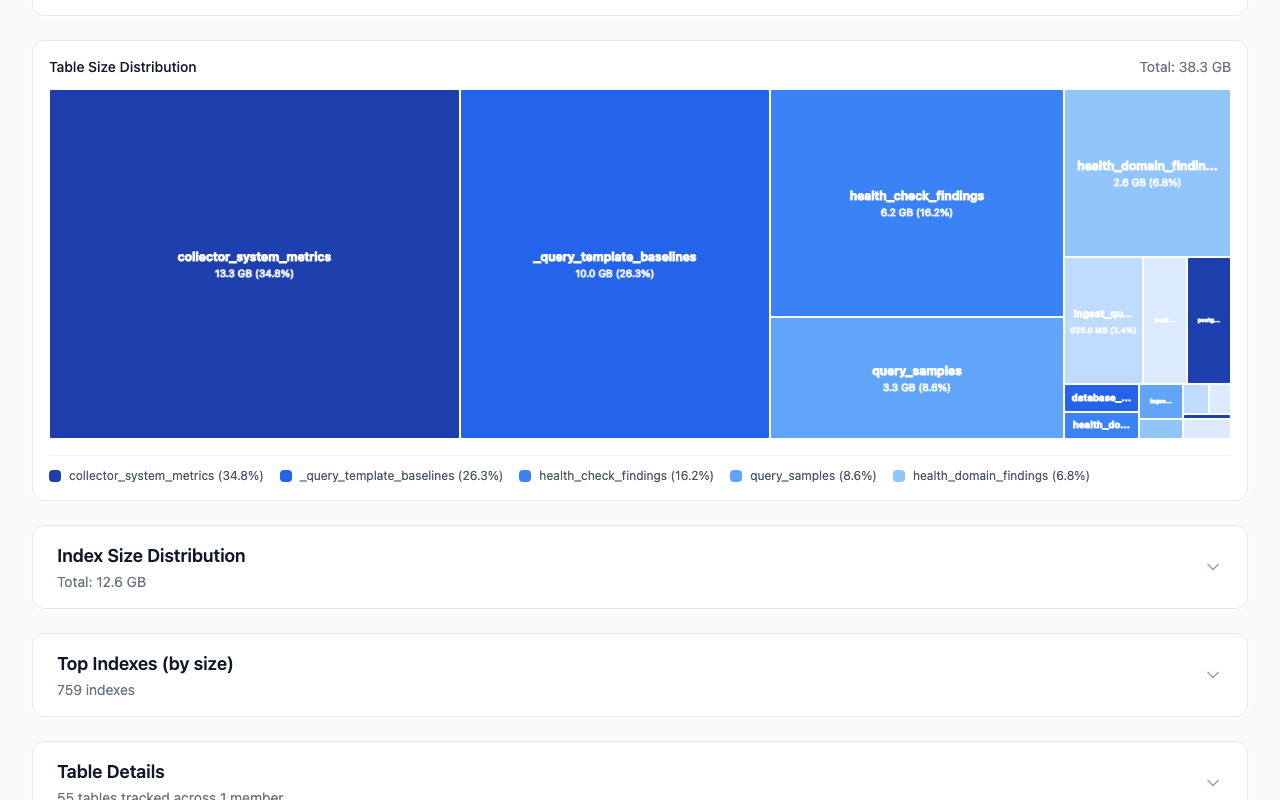
The Storage & I/O page runs the queries above for you on the collector's 60-second cadence. The Table Details list is the top-20 query with two extra columns: an estimated bloat percentage and the wasted bytes it implies, so a 40 GB table that is 35% bloat reads as roughly 14 GB reclaimable rather than 40 GB of data. The Table Size Distribution and Index Size Distribution treemaps are the per-schema aggregate drawn as area, and clicking a cell opens the table or index detail. The Storage Growth chart below is the daily snapshot idea done properly: database size and table data over the selected window, so you can see which relation grew rather than only that the disk did. If you want to see this against your own instance, the free health check runs the storage domain continuously with no card required.
How to fix it
When a table is bigger than its data, the steps are in order of cheapness:
1. Confirm it is bloat, not data. Compare pg_total_relation_size with n_live_tup average row width from pg_stat_user_tables and pg_stats, or install pgstattuple for an exact dead-space figure. SELECT FROM pgstattuple('public.orders') reports dead_tuple_percent and free_percent directly. 2. Drop indexes nobody uses. SELECT indexrelid::regclass, idx_scan FROM pg_stat_user_indexes WHERE idx_scan = 0 finds them; pg_indexes_size tells you what each drop returns. Check replicas' statistics too, since a read replica may be the only user. 3. Let VACUUM catch up. If n_dead_tup is high, run VACUUM (VERBOSE) schema.table and check whether autovacuum is keeping pace; it reclaims space for reuse but rarely shrinks the file. 4. Rebuild indexes online. REINDEX INDEX CONCURRENTLY name (docs) returns index bloat without blocking writes. 5. Rewrite the table if you must. VACUUM FULL or CLUSTER takes an ACCESS EXCLUSIVE lock for the whole rewrite; pg_repack does the same rewrite with only brief locks and is what most production teams use. 6. Move cold data. If growth is legitimate, partition by time and detach or drop old partitions instead of deleting rows, which creates the bloat you just cleaned up.
How to prevent it
- Snapshot sizes daily using the table above, or a tool that does it for you, and alert on growth rate, not absolute size. A table growing 5% a day is a problem long before the disk is full; across 46 monitored instances only 2.2% currently trip the size-growth check, which is the kind of quiet signal that is easy to skip.
- Alert on bloat percentage per table rather than only on
n_dead_tup, because dead tuples reset after every vacuum while bloat accumulates. - Tune autovacuum per table for high-churn relations with
ALTER TABLE ... SET (autovacuum_vacuum_scale_factor = 0.02)(docs); the global default of 20% means a 100 GB table gets 20 GB of dead rows before autovacuum starts. - Review indexes quarterly. Index size is the part of "table size" most people forget and the part most often reclaimable without a rewrite.
- Plan disk from growth, not size. The follow-up How do you plan PostgreSQL capacity for disk, WAL and sequences? turns the snapshot table into a runway estimate.
FAQ
Why does pg_total_relation_size return 0 for my partitioned table?
Because the parent of a declaratively partitioned table stores no rows; every tuple lives in a leaf partition. Sum pg_total_relation_size over the children listed in pg_inherits (or pg_partition_tree()) to get the real figure. The same applies to pg_relation_size and pg_table_size on the parent.
Why is my TOAST table showing up separately in size queries?
TOAST tables are ordinary relations in the pg_toast schema named pg_toast_<oid>, so any query over pg_class without a schema filter lists them. pg_table_size and pg_total_relation_size already include the owning table's TOAST bytes, so filter pg_toast% out of aggregates to avoid counting them twice.
Is pg_total_relation_size the same as the space I would get back by dropping the table?
Close, but not always. It counts every fork, TOAST and index, which is what DROP TABLE frees. It does not count WAL the table generated, sequences it owns, or space inside partially-empty pages that the OS filesystem has already allocated in 1 GB segments. Dropping a table also returns space only to the tablespace's filesystem, not to other tables, which reuse freed pages via the FSM.
How much does a table-size query cost on a large catalog?
Each size function issues a filesystem stat() per fork per 1 GB segment, so cost scales with relation count and segment count rather than row count. A few thousand relations finish in milliseconds; hundreds of thousands of partitions can take seconds and are better sampled once a day than on every dashboard load.
Does table size include dead rows?
Yes. Size is the number of 8 kB pages the relation owns, live or dead. VACUUM marks dead space reusable without shrinking the file except when the trailing pages are entirely empty, so a heavily updated table can be several times larger than its live data. Use pgstattuple or a bloat estimate to separate the two.
Part of the PostgreSQL Monitoring Tools Compared (2026) guide. Last verified against PostgreSQL 18, 2026-09-16.