Which 12 PostgreSQL metrics predict an outage before it happens?
Twelve metrics move before most PostgreSQL outages: connection saturation, idle-in-transaction age, oldest XID age, replication lag in bytes and seconds, WAL retained by inactive slots, disk free and growth rate, temp bytes rate, cache hit ratio, dead-tuple ratio, lock waits, requested-vs-timed checkpoints, and deadlocks with rollback ratio. Each has a catalog source, a defensible threshold, and a failure it precedes.
Key facts
| Fact | Value | |---|---| | Transactions left when PostgreSQL refuses new work (XID wraparound) | 3,000,000 — routine-vacuuming.html | | autovacuum_freeze_max_age default | 200,000,000 transactions — runtime-config-autovacuum.html | | max_connections default | 100 — runtime-config-connection.html | | pg_replication_slots.safe_wal_size available since | PostgreSQL 13 — view-pg-replication-slots.html | | Checkpoint counters moved from pg_stat_bgwriter to pg_stat_checkpointer in | PostgreSQL 17 — monitoring-stats.html | | pg_stat_io (per-backend-type I/O, including hits and reads) available since | PostgreSQL 16 — monitoring-stats.html | | deadlock_timeout default (also the log_lock_waits threshold) | 1s — runtime-config-locks.html | | Autovacuum trigger for a table, default | 50 rows + 20% of the table (autovacuum_vacuum_threshold + autovacuum_vacuum_scale_factor) — runtime-config-autovacuum.html |
Why this happens
Most PostgreSQL outages are not sudden. A counter climbs for hours or days, crosses a limit PostgreSQL enforces, and the server does what the documentation says it will. For each of the twelve below: where the number lives, a threshold with its reasoning, and the outage it precedes.
1. Connection saturation
Source: count(*) from pg_stat_activity where backend_type = 'client backend', divided by max_connections. superuser_reserved_connections (default 3) and reserved_connections (PG16+) are held back, so the usable ceiling is lower than the setting.
Threshold: warn at 80% of usable slots, critical at 90%. A retrying application pool fills the last 10% in seconds, so the alert must leave time to act.
Outage it precedes: FATAL: sorry, too many clients already for every new session, including the one you need to diagnose it. Sizing the ceiling is covered in the max_connections and memory guide.
2. Idle-in-transaction age
Source: now() - xact_start from pg_stat_activity where state = 'idle in transaction'.
Threshold: warn at 60 seconds, critical at 5 minutes. An open transaction holds every lock it acquired and pins the xmin horizon, so one forgotten session stops VACUUM removing dead rows database-wide. idle_in_transaction_session_timeout (default 0, disabled) is the backstop.
Outage it precedes: a lock queue behind one session, then a table nobody can write to. Across 47 monitored instances, 2.1% currently fail the idle-in-transaction check — rare, and rarely gentle.
3. Oldest transaction ID age
Source: age(datfrozenxid) from pg_database, and age(relfrozenxid) from pg_class for the worst table.
Threshold: warn at 200 million (the default autovacuum_freeze_max_age, where forced anti-wraparound vacuum starts), critical at 1 billion. PostgreSQL logs warnings 40 million transactions before the limit and refuses new commands with 3 million left.
Outage it precedes: a database that refuses all new transactions until a manual VACUUM completes. Across 50 monitored instances, 0% currently fail the XID wraparound check — expected, because autovacuum handles it unless something holds the horizon back, and metrics 2 and 5 are exactly those somethings.
4. Replication lag in bytes and in seconds
Source: pg_stat_replication on the primary: pg_wal_lsn_diff(pg_current_wal_lsn(), replay_lsn) for bytes, and the write_lag, flush_lag, replay_lag intervals for time. Bytes say how much a failover would lose; seconds say how stale a replica's reads are. You need both: a replica can be a few megabytes behind and still minutes stale on a quiet primary.
Threshold: replay lag above 30 seconds or above your recovery-point objective in bytes, whichever is tighter. See replication lag in four stages.
Outage it precedes: data loss on failover, or stale reads served as current.
5. WAL retained by inactive replication slots
Source: pg_replication_slots: active = false, wal_status, and safe_wal_size (PG13+), the number of bytes that can still be written before the slot's WAL is lost.
Threshold: any slot inactive for over an hour, or safe_wal_size below 10% of max_slot_wal_keep_size — which at its default of -1 lets a slot retain WAL without limit.
Outage it precedes: the primary's WAL volume fills and PostgreSQL panics when it cannot write WAL. Across 50 monitored instances, 0% currently fail the inactive-slot check — clean today, but a decommissioned subscriber leaves its slot behind silently, so "clean today" says little about next week.
6. Disk free and growth rate
Source: no catalog view covers the filesystem; combine df (or your provider's volume metric) with pg_database_size() and the WAL directory size. Growth rate needs history — two readings a day apart, minimum.
Threshold: warn at 80% used or under 14 days of runway at the current growth rate, critical at 90% or under 3 days. Runway is the more useful number: an 80% full volume growing 0.1% a day is not an emergency.
Outage it precedes: a hard stop — full data or WAL volume, both of which halt writes. Capacity planning for disk, WAL and sequences covers the projection; checking total database size covers the measurement.
7. Temp bytes rate
Source: temp_bytes and temp_files from pg_stat_database, taken as a rate between samples (the counters are cumulative since stats_reset).
Threshold: any sustained temp-file writing on a database that previously wrote none, or over 1 GB per hour on OLTP. log_temp_files = 0 logs every spill with the query that caused it.
Outage it precedes: the disk-full stop of metric 6, arriving faster, plus latency spikes as sorts that fit in work_mem yesterday hit disk today. This is the most commonly failing metric on the list: across 47 monitored instances, 40.4% currently fail the temp-files check.
8. Cache hit ratio, with the caveat
Source: blks_hit / (blks_hit + blks_read) from pg_stat_database; from PostgreSQL 16, pg_stat_io gives hits and reads per backend type, separating client reads from autovacuum and checkpointer traffic.
Threshold: below 99% on OLTP is worth a look; a drop of a few points from the instance's own baseline is the stronger signal. The caveat: blks_read counts reads from the operating system, not from disk. On a host with plenty of RAM those come from the OS page cache and cost almost nothing, so 95% may be fine there while 99.5% hides a real I/O problem on a memory-starved host. Across 50 monitored instances, 26.0% currently fail the cache-hit-ratio check, which is partly why it ranks eighth here, not first.
Outage it precedes: rarely an outage on its own; more often a working set that outgrew shared_buffers and the latency creep that follows.
9. Dead-tuple ratio and last autovacuum
Source: n_dead_tup, n_live_tup, last_autovacuum, last_vacuum from pg_stat_user_tables.
Threshold: dead tuples above 20% of live on any table over 10,000 rows, or last_autovacuum older than a day on a table that changes constantly. 20% is the default autovacuum_vacuum_scale_factor; a table sitting above it means autovacuum cannot keep up, or is being blocked.
Outage it precedes: bloat that slows every scan, then the XID problem in metric 3. Across 50 monitored instances, 26.0% currently fail the dead-tuples check.
10. Lock waits
Source: pg_locks where granted = false, joined to pg_stat_activity on pid; or wait_event_type = 'Lock' in pg_stat_activity. Turn on log_lock_waits so any wait longer than deadlock_timeout (default 1s) is logged with both pids.
Threshold: more than 5 sessions waiting at once, or any single wait over 30 seconds. Across 38 monitored instances, 52.6% currently have log_lock_waits off — a configuration gap, not a live problem, but those instances will meet their first lock pile-up with no log to read.
Outage it precedes: a blocking chain behind a DDL statement or an idle transaction, where every new request queues and the pool fills (metric 1). Reading pg_stat_activity shows how to draw the chain; the wait events guide explains the waits.
11. Requested versus timed checkpoints
Source: num_requested and num_timed from pg_stat_checkpointer on PostgreSQL 17 and later; checkpoints_req and checkpoints_timed from pg_stat_bgwriter before that.
Threshold: requested checkpoints outnumbering timed ones over any hour. A timed checkpoint fires every checkpoint_timeout; a requested one fires because max_wal_size (default 1 GB) was reached first, and each forces a burst of full-page writes after it.
Outage it precedes: write latency climbing in a sawtooth until the disk cannot absorb the bursts. The WAL configuration chapter explains the cost.
12. Deadlocks and rollback ratio
Source: deadlocks, xact_commit, xact_rollback from pg_stat_database, again as rates between samples.
Threshold: any deadlock per hour on a workload that had none; a rollback ratio (xact_rollback / (xact_commit + xact_rollback)) above 10%. Across 47 monitored instances, 2.1% currently fail the deadlocks check; across 46, 4.3% fail the rollback-ratio check.
Outage it precedes: the application going down while the database looks healthy — retries multiply, the pool fills, and you are back at metric 1.
How to detect it
One query covers eight of the twelve from a single connection. Replication and slot checks run on the primary; disk needs the OS; checkpoints depend on the version.
SELECT 'connections_pct' AS metric,
       round(100.0 * count(*) FILTER (WHERE backend_type = 'client backend')
             / current_setting('max_connections')::numeric, 1)::text AS value
  FROM pg_stat_activity
UNION ALL
SELECT 'oldest_idle_in_txn_s',
       coalesce(max(extract(epoch FROM now() - xact_start))::int, 0)::text
  FROM pg_stat_activity WHERE state = 'idle in transaction'
UNION ALL
SELECT 'max_xid_age', max(age(datfrozenxid))::text FROM pg_database
UNION ALL
SELECT 'lock_waiters', count(*)::text FROM pg_locks WHERE NOT granted
UNION ALL
SELECT 'cache_hit_pct',
       round(100.0 * sum(blks_hit) / nullif(sum(blks_hit + blks_read), 0), 2)::text
  FROM pg_stat_database
UNION ALL
SELECT 'temp_bytes_total', pg_size_pretty(sum(temp_bytes)) FROM pg_stat_database
UNION ALL
SELECT 'deadlocks_total', sum(deadlocks)::text FROM pg_stat_database
UNION ALL
SELECT 'rollback_pct',
       round(100.0 * sum(xact_rollback) / nullif(sum(xact_commit + xact_rollback), 0), 2)::text
  FROM pg_stat_database;
Expected output on a quiet instance looks like this:
      metric          | value
----------------------+---------
 connections_pct      | 12.0
 oldest_idle_in_txn_s | 0
 max_xid_age          | 48213977
 lock_waiters         | 0
 cache_hit_pct        | 99.61
 temp_bytes_total     | 3172 MB
 deadlocks_total      | 0
 rollback_pct         | 0.84
The last four rows are cumulative since the last statistics reset, so a single reading tells you little; run the query on a schedule, store it, and alert on the difference between samples. That is where a script stops being enough.
On the primary, the replication and slot rows:
SELECT application_name, state,
       pg_size_pretty(pg_wal_lsn_diff(pg_current_wal_lsn(), replay_lsn)) AS replay_bytes_behind,
       replay_lag
  FROM pg_stat_replication;

SELECT slot_name, active, wal_status, pg_size_pretty(safe_wal_size) AS safe_wal_size
  FROM pg_replication_slots;
-- PostgreSQL 17+
SELECT num_timed, num_requested FROM pg_stat_checkpointer;
-- PostgreSQL 16 and earlier
SELECT checkpoints_timed, checkpoints_req FROM pg_stat_bgwriter;How MyDBA shows this
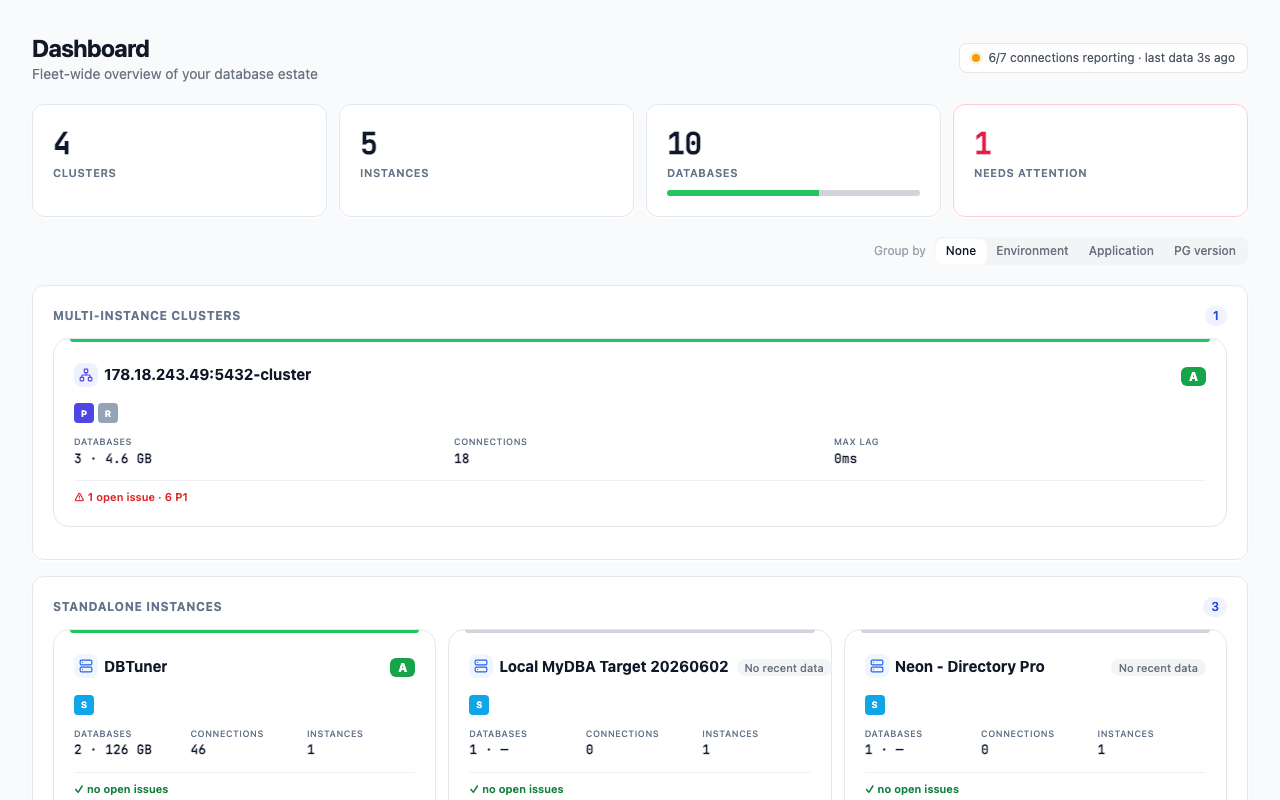
The dashboard's vitals strip puts the instance-level metrics from this list side by side — connections against max_connections, cache hit, XID age, replication lag, disk and host load — each against its own threshold, so the one that is moving stands out. Underneath, the health score is not a snapshot you request: MyDBA scores 135 checks across 16 domains continuously, fast-changing domains such as connections and locks roughly every two minutes, slow ones such as configuration once a day. The fleet figures above come from that scoring, aggregated across MyDBA's monitored fleet over the last 7 days, with any check evaluated on fewer than 20 instances excluded.
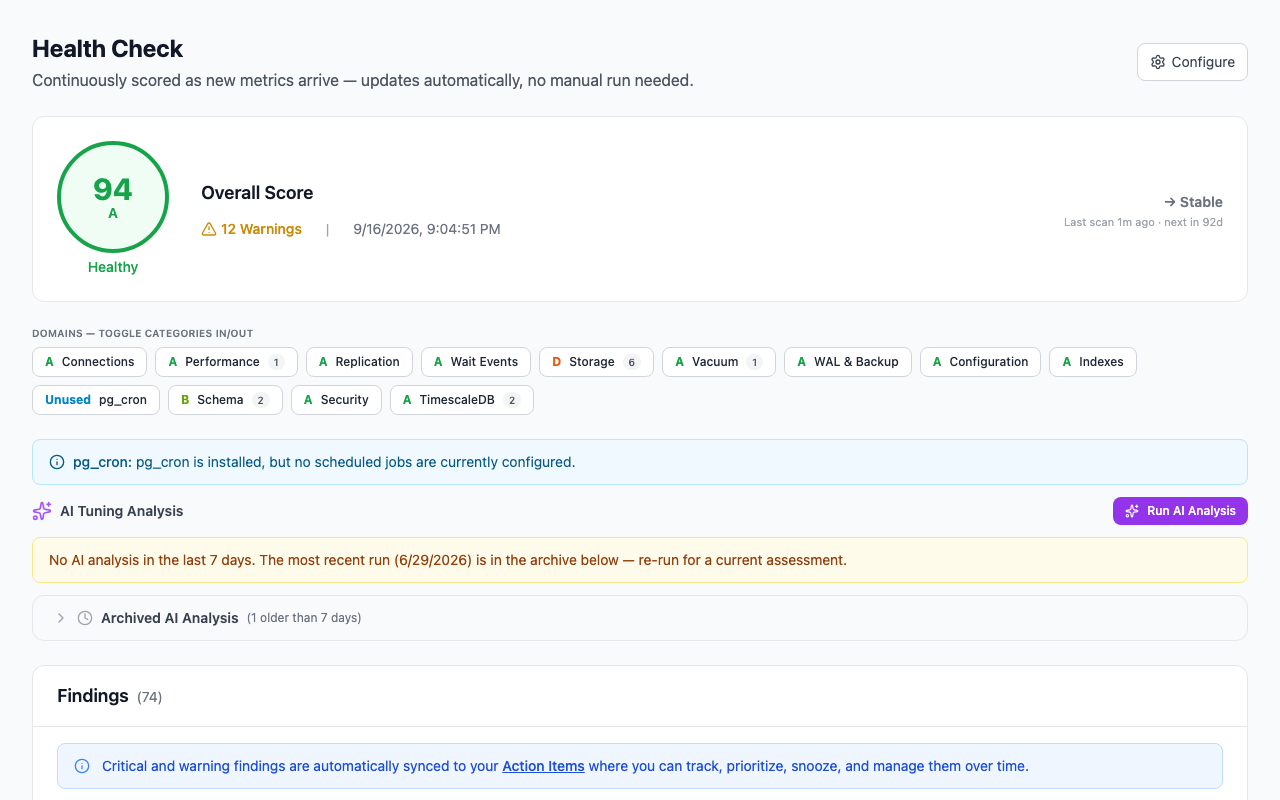
The history view is where "before it happens" lives: a score that steps down over three days as dead tuples climb and temp files start spilling looks different from one that falls off a cliff, and the findings under each point name the metric responsible. To see what your own instances score, the free health check runs the same 135 checks on one cluster, no card required.
How to fix it
Each metric has its own remedy, in the order the failures tend to arrive:
1. Connections filling: find idle sessions (SELECT pid, state, now() - state_change FROM pg_stat_activity WHERE state LIKE 'idle%' ORDER BY 3 DESC), pg_terminate_backend(pid) the stale ones, then put a pooler in front. Raising max_connections alone trades this outage for a memory one. 2. Idle in transaction: terminate the offender, then set idle_in_transaction_session_timeout = '5min' or lower. 3. XID age climbing: VACUUM (FREEZE, VERBOSE) the tables with the oldest relfrozenxid; if autovacuum is running but losing, raise autovacuum_vacuum_cost_limit and add workers. Find what holds the horizon — an idle transaction, a row in pg_prepared_xacts, or a slot. 4. Replication lag: confirm the replica is applying (pg_stat_wal_receiver), look for a long replica query blocking replay, then at network and replica I/O. 5. Inactive slot: pg_drop_replication_slot('name') once the consumer is confirmed gone, and set max_slot_wal_keep_size so the next one cannot fill the disk. 6. Disk: check pg_wal for retained segments (metric 5 again) and clear old logs to buy time, then add capacity. 7. Temp files: identify the queries via log_temp_files, fix the missing index or unbounded sort, and only then consider SET work_mem for that role. 8. Cache hit falling: check whether the working set grew (new table or index — table and schema sizes) before touching shared_buffers. 9. Dead tuples: VACUUM (VERBOSE) the table, then ALTER TABLE ... SET (autovacuum_vacuum_scale_factor = 0.02) so autovacuum visits it sooner. 10. Lock waits: find the root blocker with pg_blocking_pids(pid), then set lock_timeout in the migration tool so DDL fails fast instead of queuing everyone behind it. 11. Requested checkpoints: raise max_wal_size (4–8 GB is common on busy instances) so timed checkpoints win; keep checkpoint_completion_target at 0.9. 12. Deadlocks and rollbacks: read the deadlock detail in the log (two statements, two lock orders), fix the lock ordering, and check the rolled-back statements in pg_stat_statements — the pg_stat_statements guide covers reading it.
How to prevent it
Sample all twelve on a schedule, keep the history, and alert on rate and trend rather than only the current value. The settings that make that possible are cheap:
log_lock_waits = on,log_temp_files = 0,log_checkpoints = on(the default since PostgreSQL 15),track_io_timing = on. One line each; the first is off on more than half the monitored fleet.idle_in_transaction_session_timeoutandlock_timeoutat values your application can live with.max_slot_wal_keep_sizesmaller than your free disk.- A pooler sized so the application cannot reach
max_connectionson its own.
Then decide, per metric, between a threshold alert and a trend alert. XID age and disk runway want trends (days to limit); connections, lock waiters and replication lag want thresholds with short windows; temp bytes, deadlocks and rollbacks want rates. The tools that do this for you are compared in the PostgreSQL monitoring tools hub.
FAQ
Which single metric should I watch if I can only watch one?
Oldest transaction ID age. Its failure mode is a database that refuses every transaction, it moves slowly enough to alert on days ahead, and the things that push it — idle transactions, stuck vacuums, abandoned slots — are three more metrics from the list.
Why is cache hit ratio so far down the list?
Because it is the most misread number in PostgreSQL. blks_read counts blocks fetched from the operating system, which on a well-provisioned host mostly come from the OS page cache, not disk. A low ratio on a large-memory host may cost nothing; a high ratio on a small one may hide real I/O waits. From PostgreSQL 16, pg_stat_io gives per-backend-type hits and reads, a better starting point.
Do these thresholds apply to Aurora, RDS and other managed services?
The catalog views are the same, and the thresholds for XID age, idle transactions, locks, temp files, dead tuples, checkpoints and rollbacks carry over. Disk and replication differ: Aurora's storage layer has no WAL volume to fill and reports replica lag through its own views. Check the provider's documentation for which of the twelve it exposes natively.
How often should I sample them?
Connections, lock waiters and replication lag change in seconds — sample every 15 to 60 seconds. Temp bytes, deadlocks, rollbacks and cache hit are rates and need two samples a few minutes apart to mean anything. XID age, dead tuples, slot WAL and disk move over hours; every 5 to 15 minutes is plenty, but keep weeks of history so the trend is visible.
Part of the PostgreSQL Monitoring Tools Compared (2026) guide. Last verified against PostgreSQL 18, 2026-09-16.