Tracking Your Database Health Score Over Time
Tracking Your Database Health Score Over Time
The Problem
You fix a batch of database issues on Monday. Autovacuum was misconfigured on three high-churn tables — you tuned the scale factors. An unused index was consuming 12GB — you dropped it. A missing index was causing sequential scans on a 40-million-row table — you created it. By Wednesday, everything feels faster. By Friday, you have no idea if the fixes held.
Point-in-time diagnostics are useful during incident response, but they tell you nothing about trajectory. Did the autovacuum tuning actually reduce dead tuple accumulation, or did a new table start churning and eat the gains? Is the sequential scan pattern gone, or did a new query introduce a different one? Without trend data, you cannot answer these questions. You are flying blind between diagnostic sessions.
The deeper problem is accountability. When you spend two hours tuning PostgreSQL, your team asks "did it help?" and you have no data to show them. You can point to anecdotes — "queries feel faster" — but you cannot show a graph that proves your Vacuum domain went from 60 to 95 after the change. Without measurable outcomes, database tuning becomes invisible work that is hard to justify and easy to deprioritize.
How to Detect It
In theory, you could build trend tracking yourself. Run the same set of diagnostic queries every day, store the results in a table, and compare over time:
-- You'd need to build something like this for every check
CREATE TABLE health_check_log (
    checked_at_utc timestamptz DEFAULT now(),
    domain text,
    check_name text,
    status text,  -- pass, warning, critical
    metric_value numeric,
    details jsonb
);

-- Then schedule daily inserts for each check
INSERT INTO health_check_log (domain, check_name, status, metric_value)
SELECT 'vacuum', 'dead_tuple_ratio',
       CASE WHEN max_ratio > 20 THEN 'critical'
            WHEN max_ratio > 5 THEN 'warning'
            ELSE 'pass' END,
       max_ratio
FROM (
    SELECT max(100.0 * n_dead_tup / NULLIF(n_live_tup, 0)) AS max_ratio
    FROM pg_stat_user_tables
) t;
You would need to write and maintain this for every check across every domain, define the scoring thresholds, build the trend queries, and create some way to visualize the results. In practice, nobody does this. The effort required to build and maintain a comprehensive health scoring pipeline exceeds the time most teams can allocate, so health checks remain ad-hoc point-in-time exercises.
How myDBA.dev Shows It
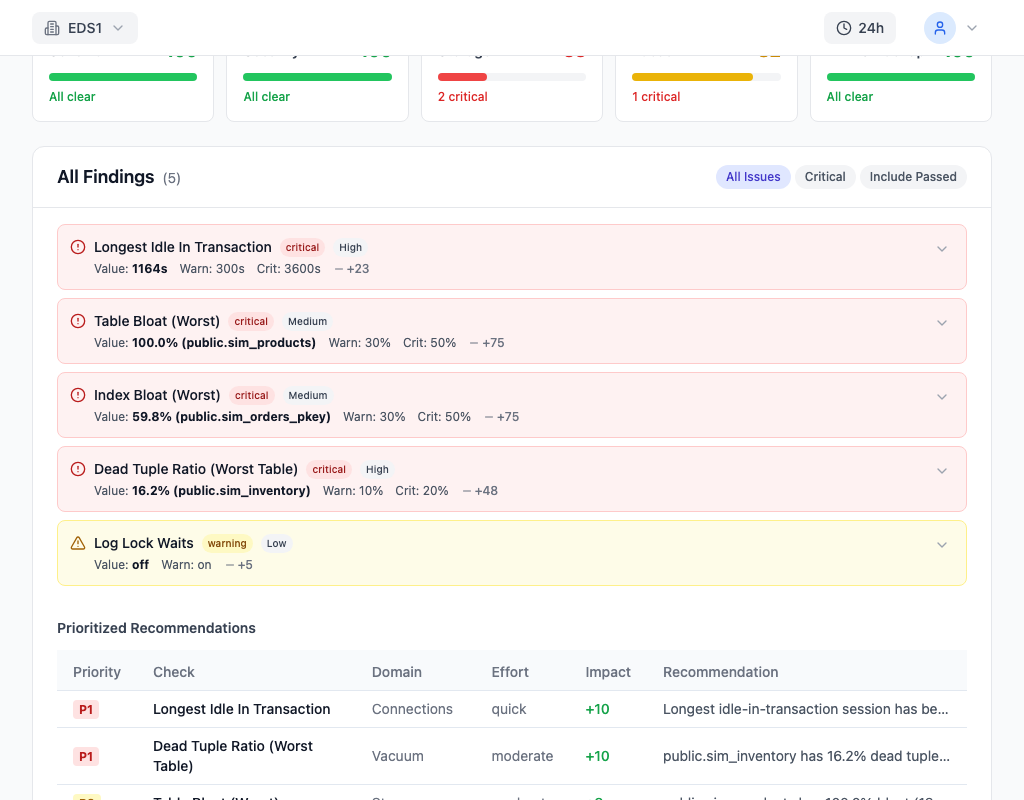
myDBA.dev tracks health scores over time for every domain. The trend view shows your overall score and per-domain scores plotted daily, so you can see the exact impact of your tuning work. In this example, the overall score jumps from 72 to 93 after autovacuum changes were applied — with the Vacuum domain climbing from 60 to 95 and Storage improving from 45 to 88 as bloat was reclaimed. The trend line makes the value of your work visible and provable.
Per-domain tracking is where the real insight lives. You might see your overall score holding steady at 85 while Configuration stays at 100, Performance stays at 90, but Indexes slowly degrades from 95 to 75 over three weeks. That gradual decline tells you that new queries are being deployed without corresponding indexes — a pattern you would never notice from a single point-in-time check.
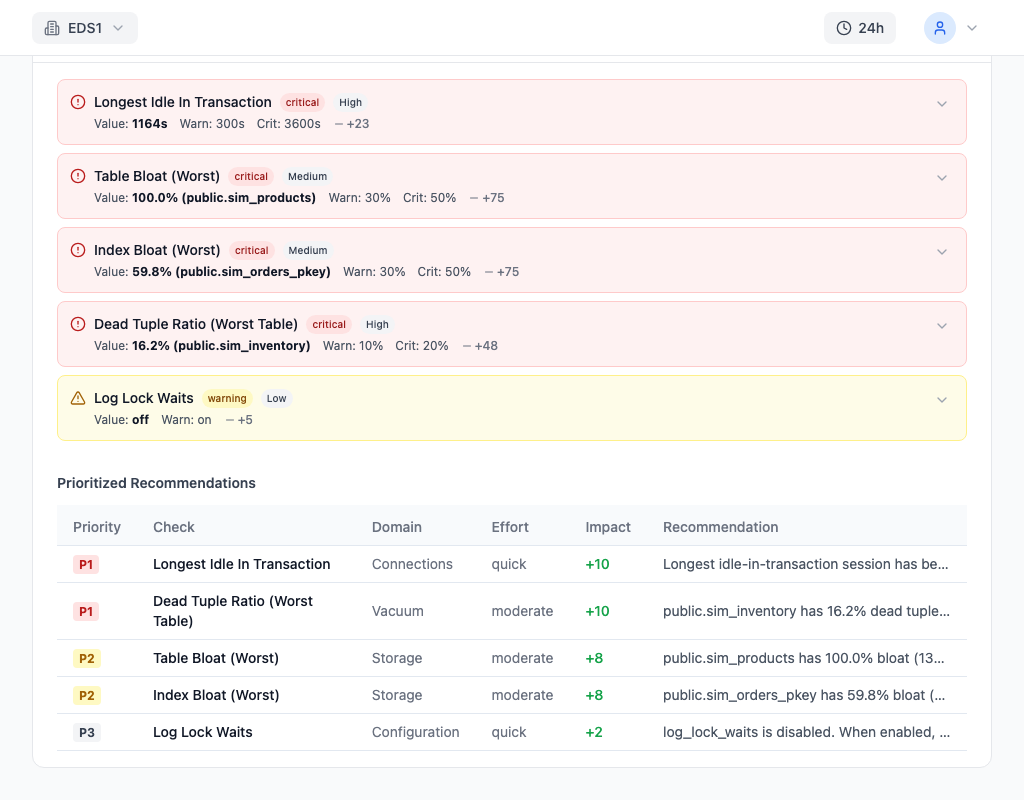
Not every finding needs to be fixed. Some are accepted trade-offs — you know a table is bloated, but running VACUUM FULL requires an exclusive lock and your uptime SLA does not allow the downtime. Suppression rules let you acknowledge these findings and exclude them from scoring without losing visibility. The suppressed finding still appears in the detail view (so you remember it exists), but it does not drag down your score or create noise in the trend data. This keeps the score meaningful — a drop always represents a real change, not a known limitation you already accepted.
How to Fix It
The workflow for using health score trends effectively has three steps:
1. Review findings by priority. Start with P1 (critical) and P2 (high) findings. These have the largest impact on your score and the highest risk to your database.
-- Example P1 finding: autovacuum disabled on a table with 5M dead tuples
ALTER TABLE events RESET (autovacuum_enabled);
-- Score impact: Vacuum domain +15 points
2. Fix using the generated SQL. Each finding includes a ready-to-run fix. Apply it, then wait for the next health check cycle to verify the score improved.
-- Example P2 finding: shared_buffers at 4% of RAM
ALTER SYSTEM SET shared_buffers = '8GB';
-- Requires restart, but Configuration domain will jump to 100
3. Suppress accepted trade-offs. If a finding represents a deliberate choice (e.g., you keep a read-heavy table intentionally denormalized and accept the bloat), suppress it. This prevents it from creating noise in your trend data.
The key metric is the delta. Your absolute score matters less than the direction. A score of 78 that was 65 last week is better than a score of 90 that was 95 last week. The trend tells you whether your database is improving or degrading — the absolute number just tells you how much headroom remains.
How to Prevent It
Use health score trends as a team KPI. Share the dashboard with your engineering team so database health becomes visible alongside application metrics like error rates and latency. When the score drops after a deployment, you have an early signal that the new code introduced a database problem — before it escalates into a user-facing incident.
Set alert thresholds on score degradation. A 10-point drop in any domain within a week warrants investigation. A P1 finding appearing where there were none before warrants immediate review. myDBA.dev can alert on these changes, turning passive trend tracking into active monitoring.
Build health check reviews into your sprint retrospectives. Spend 5 minutes reviewing which domains improved, which degraded, and whether any new findings appeared. This cadence prevents the slow accumulation of small problems that individually seem harmless but collectively degrade performance over months.