PostgreSQL Alerting That Tells You Why, Not Just What
PostgreSQL Alerting That Tells You Why, Not Just What
The Problem
Traditional monitoring alerts tell you a metric crossed a threshold. "Connections at 85% of max_connections." "Replication lag exceeded 30 seconds." "Disk usage at 90%." You get woken up at 3 AM, and now you need to figure out why.
For connections at 85%, you need to determine: Are they idle? Active? Idle in transaction? Is it a connection leak from an application that opens connections without closing them? A connection pool misconfiguration that allows too many connections? A sudden legitimate traffic spike? Each cause requires a different response — killing idle sessions, fixing the application, resizing the pool, or scaling up.
The alert gave you a symptom with no diagnosis. You SSH into the database server, run pg_stat_activity queries, check application logs, and piece together the story. By the time you understand the cause, the incident has been running for 20 minutes. If it is a recurring issue, you go through this same investigation every time.
The fundamental limitation of threshold-based alerting is that it operates on isolated metrics without context. A metric exceeding a threshold is a signal, but the diagnostic value of that signal depends entirely on what you can correlate it with. Connections spiking at the same time as lock waits spike tells a different story than connections spiking with idle sessions — but a threshold alert treats both identically.
How to Detect It
You can set up basic PostgreSQL alerting with several approaches. Prometheus with the postgres_exporter plus Alertmanager is common:
# prometheus alerting rule example
groups:
  - name: postgresql
    rules:
      - alert: HighConnectionCount
        expr: pg_stat_activity_count > 80
        for: 5m
        labels:
          severity: warning
        annotations:
          summary: "Connection count is {{ $value }}"
Or custom scripts that query the database and send notifications:
-- Check for conditions that should trigger alerts
SELECT
    CASE
        WHEN count(*) > current_setting('max_connections')::int * 0.85
        THEN 'CRITICAL: connections at ' ||
             round(100.0 * count(*) /
                   current_setting('max_connections')::int) || '%'
    END AS alert_message
FROM pg_stat_activity;
These work for basic threshold detection, but they share the same limitation: they tell you what exceeded a threshold without telling you why. You still need to run follow-up diagnostic queries every time an alert fires. And you need to build and maintain the alerting infrastructure — Prometheus server, exporter configuration, Alertmanager routing, notification channels, silencing rules, and escalation policies.
The maintenance burden is significant. Each new alert rule needs to be written in PromQL, tested, and tuned for your specific workload. False positives erode trust in the alerting system. Too few alerts miss real problems. Getting the balance right requires ongoing effort.
How myDBA.dev Shows It
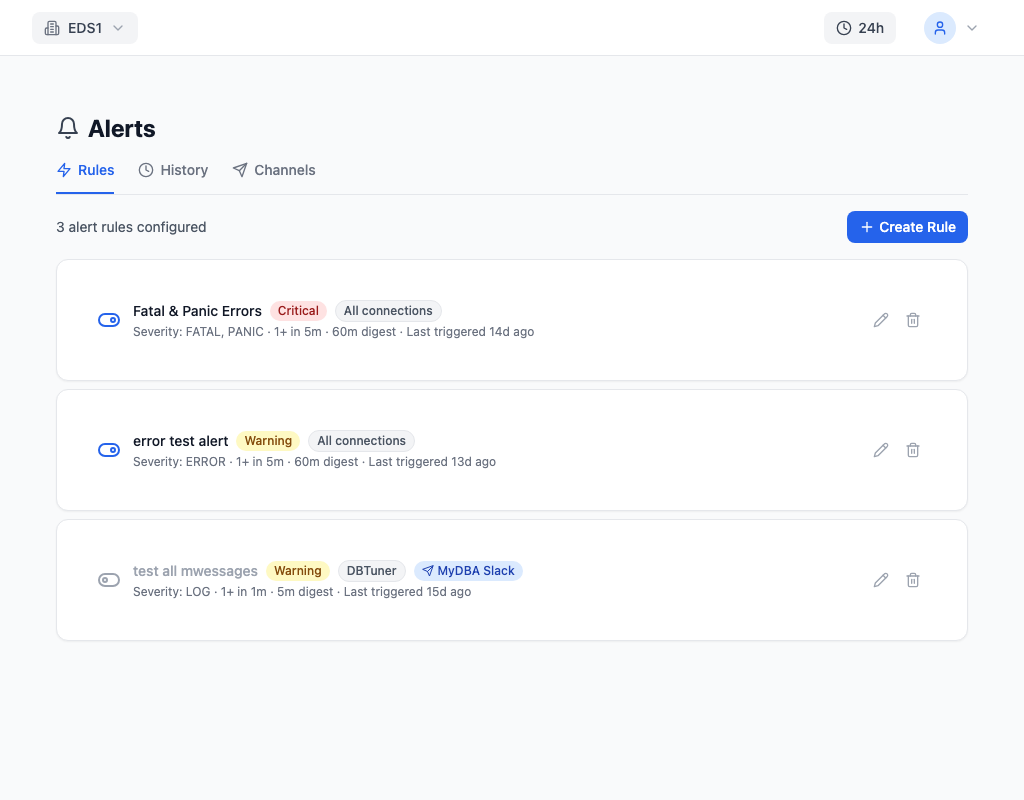
myDBA.dev provides alert rules that tie directly into the health check system. Each alert rule specifies a severity (P1 critical through P4 informational), a condition, a cooldown period to prevent alert storms, and a notification channel. But the key difference from threshold-only alerting is context: when an alert fires, it includes not just the metric value that triggered it but the health check findings that explain why.
A connection count alert does not just say "85% of max_connections used." It includes the breakdown: 40 active, 25 idle in transaction, 20 idle. The idle-in-transaction sessions are identified by PID and duration. The health check finding tells you the likely cause and provides the SQL command to fix it. You go from "something is wrong" to "here is what is wrong and here is the fix" in a single notification.
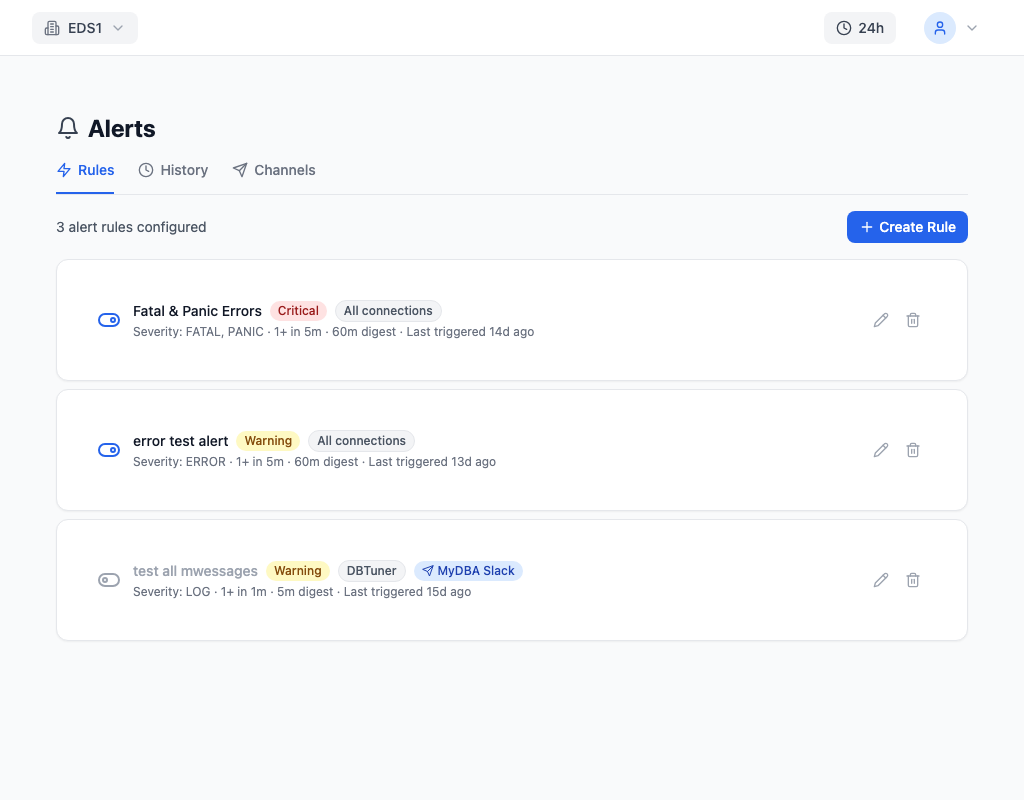
The alert history timeline shows every alert that fired, when it triggered, when it resolved, and the health check context at the time of triggering. This historical view is valuable for post-incident analysis and for tuning alert thresholds. If the same alert fires and auto-resolves three times a day, the threshold is too sensitive for your workload. If an alert fires and takes two hours to resolve, you may need a tighter threshold for earlier warning.
How to Fix It
Start with five essential alert rules that cover the most critical PostgreSQL failure modes:
1. Replication lag — Alert when any replica exceeds 30 seconds of replay lag. Replication lag affects read consistency and indicates the replica is falling behind.
2. XID age — Alert when any database exceeds 500 million XID age (about 25% of the wraparound limit). XID wraparound is a slow-moving catastrophe that gives you plenty of warning if you are watching.
3. Disk usage — Alert at 80% and 90%. Disk full causes immediate database shutdown. This is the one alert you absolutely cannot miss.
4. Connection count — Alert at 75% and 90% of max_connections. Connection exhaustion blocks all new queries and can cascade into application-wide outages.
5. Health score degradation — Alert when the overall health score drops below 70 (grade C). This catches problems that individual metric thresholds might miss — a combination of slightly elevated values that individually are below threshold but collectively indicate trouble.
Set appropriate cooldown periods to prevent alert storms. A 15-minute cooldown means the alert fires once and does not repeat for 15 minutes, even if the condition persists. Without cooldowns, a metric oscillating around the threshold generates dozens of alerts.
Configure digest rules for lower-severity alerts (P3, P4). Rather than immediate notification, batch these into a daily summary. This keeps informational findings visible without creating noise.
How to Prevent It
Treat alerting as a living system that needs regular tuning, not a set-and-forget configuration. Review alert history monthly: which alerts fire frequently without requiring action (too sensitive), and which incidents were not caught by any alert (gaps in coverage). Adjust thresholds based on your workload patterns.
Start with the five essential rules above and add rules only when you experience an incident that was not caught. Each rule you add creates maintenance overhead and notification volume. Five well-tuned rules that catch real problems are worth more than fifty rules that generate noise.
myDBA.dev ties alerting directly to health check diagnostics, bridging the gap between "a metric crossed a threshold" and "here is what caused it and how to fix it." This diagnostic context turns alerts from interruptions into actionable instructions — reducing the mean time from alert to resolution from the 20 minutes of manual investigation to the seconds it takes to read the finding and apply the fix.