Real-Time Session Monitoring: See Every Active Query Right Now
Real-Time Session Monitoring: See Every Active Query Right Now
The Problem
Your application is reporting HTTP 504 timeouts. Users are seeing spinning loaders. The error rate dashboard shows a spike starting 3 minutes ago. You need to know what is happening in the database right now — not the aggregate statistics from pg_stat_statements (which tell you what happened over hours or days), not the slow query log (which only captures queries after they finish), but the actual queries executing at this exact moment.
You SSH into the database server and run SELECT * FROM pg_stat_activity. A wall of text. Sixty rows of varying states: idle, active, idle in transaction, some with queries truncated at track_activity_query_size characters. You scan through, trying to spot the problem. Is it the query running for 47 seconds on row 23? The three sessions all stuck in "idle in transaction" for 12 minutes? The 15 connections from the same application all waiting on the same lock? By the time you format the output, re-run the query to see if the same sessions are still there, and piece together the picture, another 2 minutes have passed.
The fundamental limitation of pg_stat_activity is that it is a snapshot. It shows the current state at the instant you query it. Sessions that were problematic a second ago but just finished are invisible. Sessions that are intermittently slow — running fast most of the time but occasionally blocking — may not appear problematic in any single snapshot. You need continuous refresh, filtering, and the ability to drill into individual sessions to understand what they are waiting on and why.
How to Detect It
The standard diagnostic query for active sessions:
-- Active sessions with duration and wait information
SELECT
    pid,
    usename AS username,
    datname AS database_name,
    client_addr,
    state,
    wait_event_type,
    wait_event,
    now() - xact_start AS transaction_duration,
    now() - query_start AS query_duration,
    left(query, 100) AS query_preview
FROM pg_stat_activity
WHERE state != 'idle'
  AND pid != pg_backend_pid()
ORDER BY query_start ASC NULLS LAST;
This filters out idle connections and sorts by oldest first, putting the longest-running sessions at the top. The wait_event_type and wait_event columns tell you what a session is blocked on — Lock / relation means it is waiting for a table lock, LWLock / BufferContent means it is waiting for a buffer page, IO / DataFileRead means it is doing physical I/O.
For lock contention specifically:
-- Find blocking chains
SELECT
    blocked.pid AS blocked_pid,
    blocked.query AS blocked_query,
    blocker.pid AS blocker_pid,
    blocker.query AS blocker_query,
    now() - blocked.query_start AS blocked_duration
FROM pg_stat_activity blocked
JOIN pg_locks bl ON bl.pid = blocked.pid AND NOT bl.granted
JOIN pg_locks gl ON gl.locktype = bl.locktype
    AND gl.database IS NOT DISTINCT FROM bl.database
    AND gl.relation IS NOT DISTINCT FROM bl.relation
    AND gl.page IS NOT DISTINCT FROM bl.page
    AND gl.tuple IS NOT DISTINCT FROM bl.tuple
    AND gl.pid != bl.pid
    AND gl.granted
JOIN pg_stat_activity blocker ON blocker.pid = gl.pid;
Running these queries manually during an incident is slow and error-prone. You are context-switching between writing SQL, interpreting results, and deciding on actions — all while the incident clock runs.
How myDBA.dev Shows It
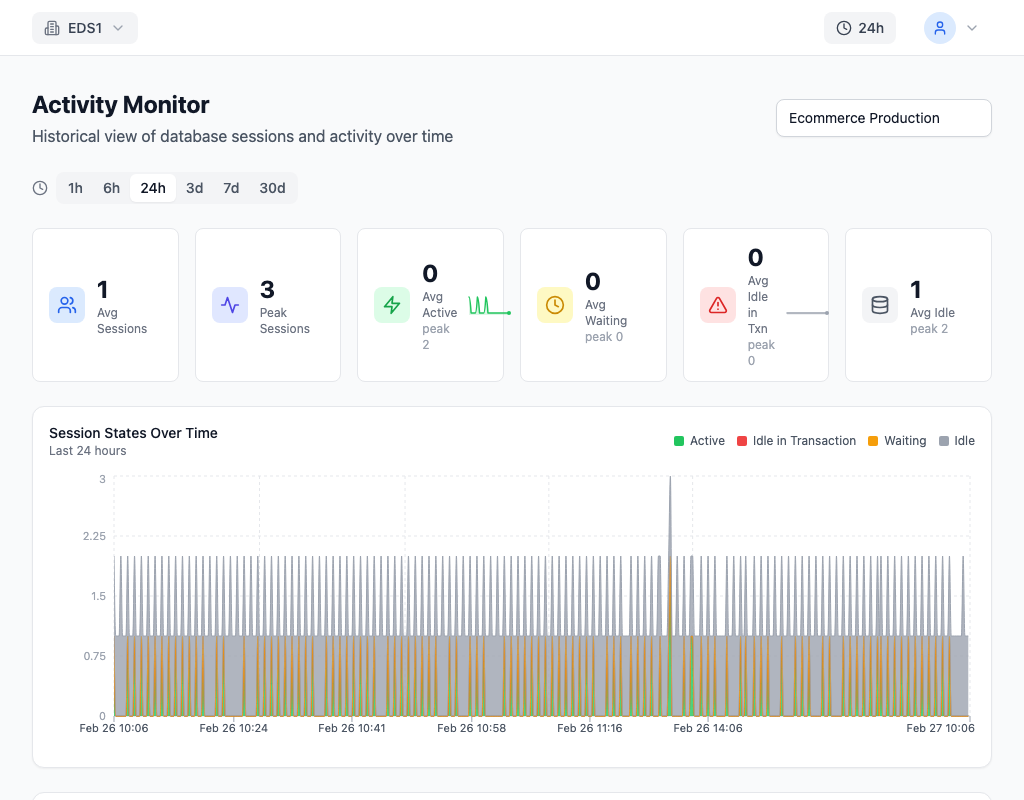
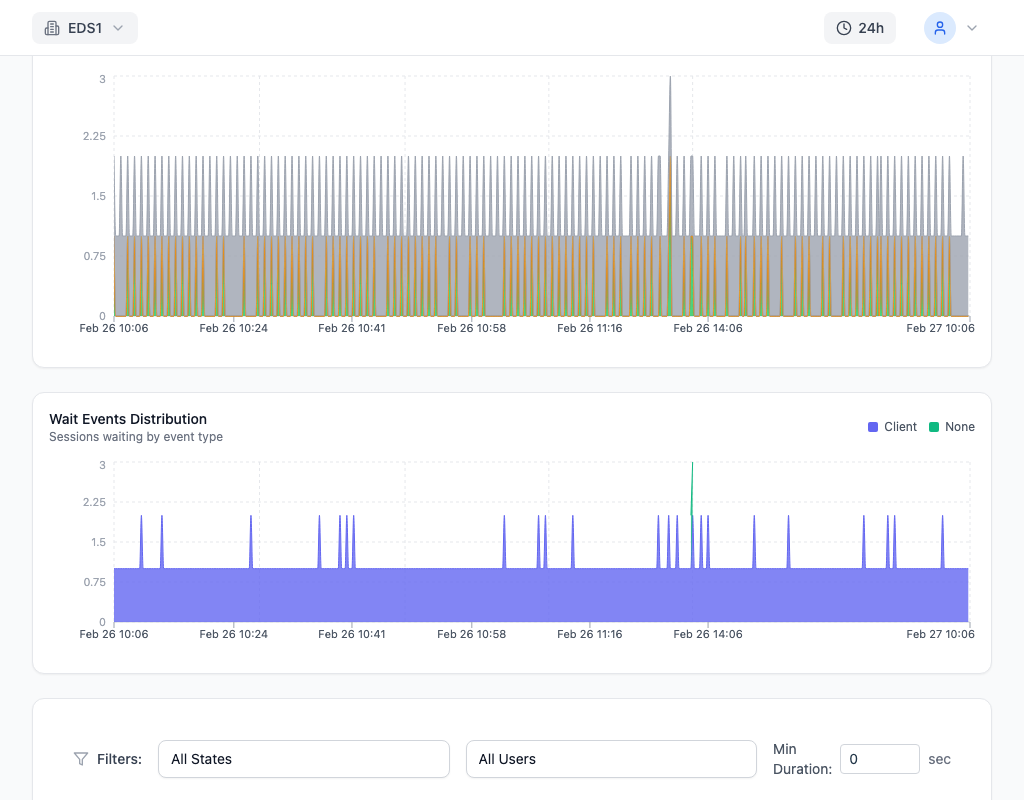
myDBA.dev's activity monitor shows every active session in real time, refreshing every 15 seconds. Each session displays its state (active, idle in transaction, waiting), the current query text, the wait event if blocked, the transaction duration, and the client application name. Color-coded state indicators let you spot problems at a glance — red for sessions waiting on locks, amber for long-running transactions, green for actively executing queries. Filtering by state, database, or user lets you cut through the noise to find the sessions that matter.
Clicking on any session opens a detail view with the full query text (not truncated), the complete wait event information, lock details if the session is blocked, and session metadata including the client address, application name, and connection time. For sessions stuck in "idle in transaction," you can see how long the transaction has been open and whether it is holding locks that block other sessions. The detail view includes action buttons — cancel the current query with pg_cancel_backend or terminate the session with pg_terminate_backend — so you can take action directly without switching to a SQL client.
How to Fix It
The most common patterns you will find in the activity monitor and their fixes:
Idle in transaction sessions — a connection opened a transaction and never committed or rolled back. This holds locks and prevents vacuum from cleaning up dead tuples:
-- Set a timeout to automatically terminate idle-in-transaction sessions
ALTER SYSTEM SET idle_in_transaction_session_timeout = '5min';
SELECT pg_reload_conf();

-- Terminate a specific idle-in-transaction session immediately
SELECT pg_terminate_backend(12345);
The idle_in_transaction_session_timeout setting is the systemic fix. It acts as a guardrail — even if application code forgets to close a transaction, PostgreSQL will terminate the session after the timeout. Five minutes is a reasonable default for most OLTP workloads.
Long-running queries consuming resources — a report query or poorly optimized application query running for minutes:
-- Cancel the query (allows the session to continue)
SELECT pg_cancel_backend(12345);

-- If cancel doesn't work (some operations can't be canceled), terminate
SELECT pg_terminate_backend(12345);
Use pg_cancel_backend first — it cancels the current query but keeps the connection alive. pg_terminate_backend is more aggressive and closes the entire connection, which may cause the application to reconnect.
Connection saturation — all available connections are in use, and new connections are being refused:
-- Check current vs maximum connections
SELECT count(*) AS active_connections,
       current_setting('max_connections')::int AS max_connections,
       round(100.0 * count(*) / current_setting('max_connections')::int) AS usage_pct
FROM pg_stat_activity;
If usage is above 80%, either your connection pool is misconfigured (too many connections per application instance), or connections are leaking (opened but never returned to the pool). Check for idle connections that have been open for hours — these are usually leaks.
How to Prevent It
Set timeouts as guardrails so that individual sessions cannot monopolize resources:
-- Prevent runaway queries
ALTER SYSTEM SET statement_timeout = '30s';
-- Prevent forgotten transactions
ALTER SYSTEM SET idle_in_transaction_session_timeout = '5min';
-- Prevent idle connections from consuming slots
ALTER SYSTEM SET idle_session_timeout = '30min';
SELECT pg_reload_conf();
These settings do not fix root causes — they prevent symptoms from escalating into incidents. A query that hits statement_timeout should be investigated and optimized, not just retried.
Monitor active session counts over time, not just during incidents. A steady increase in average active sessions usually indicates either growing load, degrading query performance, or connection pool misconfiguration. myDBA.dev tracks session states over time, so you can see that "idle in transaction" sessions increased from 2 to 15 over the past week — before it becomes an incident.
Build connection budgets into your capacity planning. If you have max_connections = 100 and four application instances each configured for a pool of 25 connections, you have zero headroom. Reserve 10-20% of max_connections for administrative access and monitoring.