max_connections in Postgres: A Memory Decision in Disguise
max_connections in Postgres: the memory decision hiding inside a config change
The five-minute version (and the video)
The decision tree for max_connections in Postgres has three steps and most people skip the first two.
1. Measure. Are you actually getting connection refusals, or do you just have a big number in pg_stat_activity that made someone nervous? 2. Pool. If the refusals are real, can PgBouncer in transaction mode absorb them? Usually yes. 3. Only then raise the limit, and compute the memory budget before you restart, not after the OOM killer does it for you.
I recorded a 3-minute version of this on YouTube if you want the shape of the argument before the detail. This article goes further: the exact SQL for each step, how to price the shared-memory delta before you commit to a restart, the private-memory arithmetic that actually kills servers, and the five ways I have watched this change go wrong.
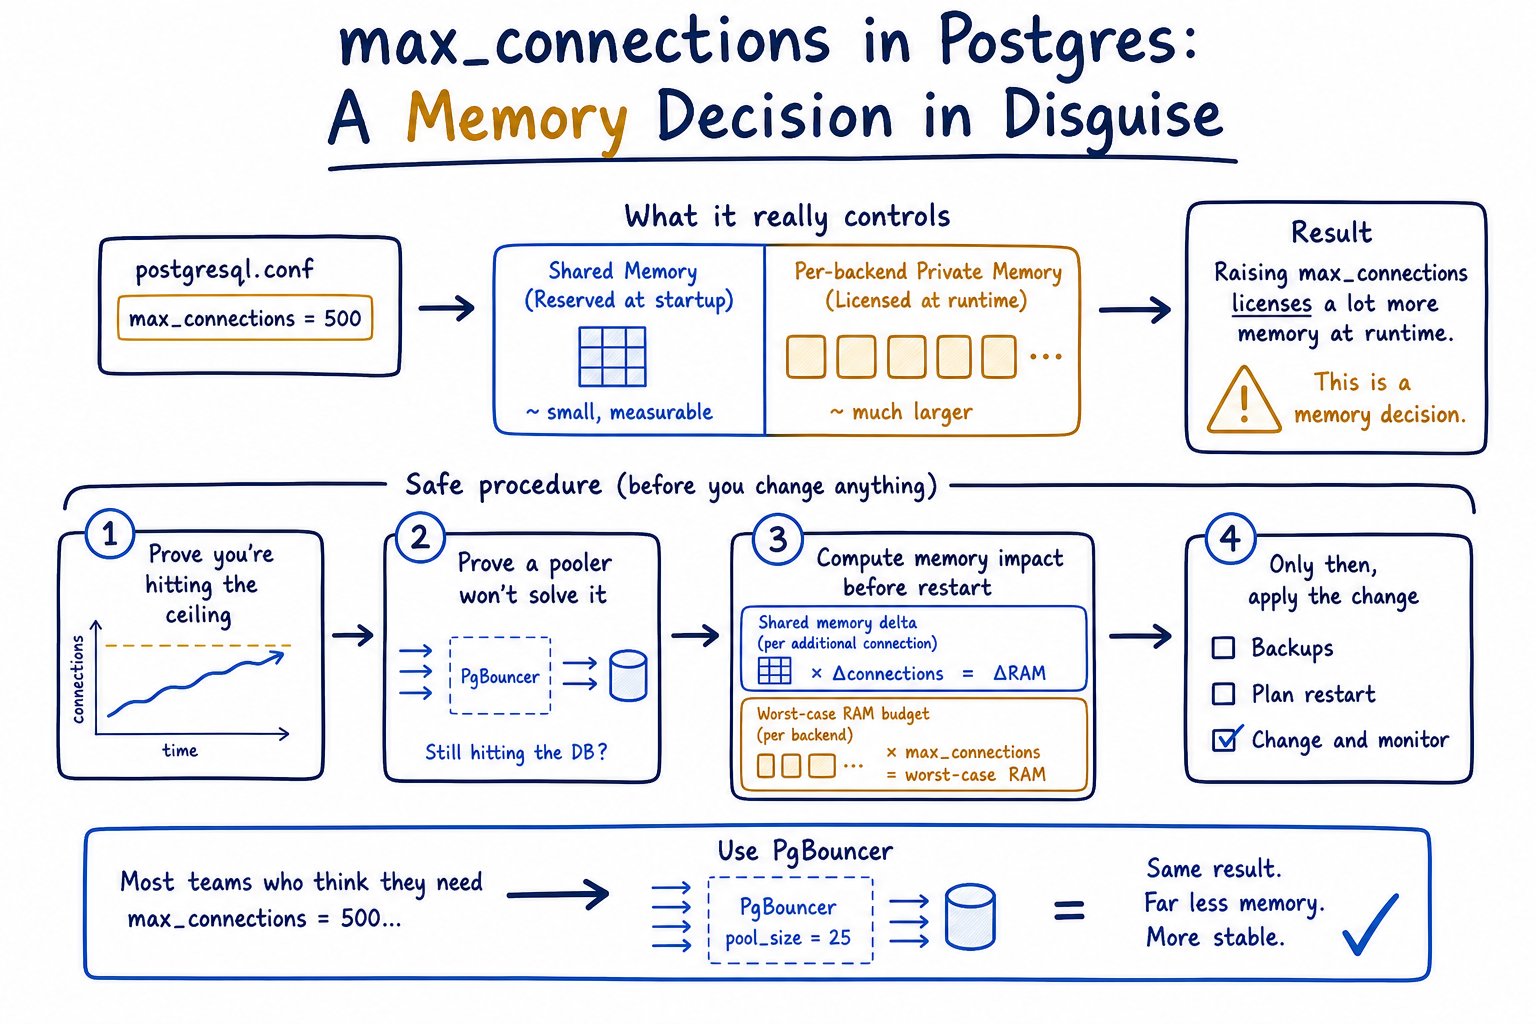
My position, stated flatly and justified below: raising max_connections is a memory decision wearing a config change as a costume. The parameter itself reserves a small, precisely measurable amount of shared memory at startup. What it really does is license a much larger amount of per-backend private memory at runtime, and nothing warns you about that until month-end reporting.
What max_connections actually is
max_connections defaults to 100 in a stock build. It has postmaster context, which means a reload (SIGHUP) does nothing; you need a full server restart.
Postgres uses a process-per-connection model. Every client connection gets its own forked OS process, not a thread. That process has its own memory contexts, its own catalog caches, its own copy of whatever it's doing. If Postgres used a thread pool or an async event loop instead, raising a connection limit would be nearly free. It doesn't, so it isn't — this one architectural fact is the reason the rest of the article exists.
The parameter is a slot allocation, not a throttle. At startup the postmaster sizes several shared-memory arrays for the maximum number of backends, whether or not anyone ever connects. An idle instance sitting at max_connections = 500 has already paid the shared-memory cost of 500 slots at 3am with zero clients connected. And the maximum is not max_connections. Internally, InitializeMaxBackends() computes:
MaxBackends = max_connections
            + autovacuum workers + 1 (the launcher)
            + max_worker_processes
            + max_wal_senders
So autovacuum workers, parallel workers, logical replication workers and walsenders all sit on top of your number. If you set max_connections = 200, max_worker_processes = 8, max_wal_senders = 10 and autovacuum_max_workers = 3, shared memory is sized for 222 backends. Worth knowing when you're counting processes on the box and the arithmetic doesn't line up.
(PostgreSQL 18 added autovacuum_worker_slots, which sizes the autovacuum slot array separately at startup so autovacuum_max_workers can be changed with a reload. max_connections still needs the restart.)
Step 1 — Check what you have and what you're using
Start here, always:
SHOW max_connections;

SELECT name, setting, unit, context, source, sourcefile, pending_restart
FROM pg_settings
WHERE name IN (
  'max_connections',
  'superuser_reserved_connections',
  'reserved_connections',
  'max_worker_processes',
  'max_wal_senders',
  'autovacuum_max_workers',
  'shared_buffers',
  'work_mem',
  'hash_mem_multiplier'
);
source and sourcefile matter more than people expect. If source says configuration file and sourcefile points at postgresql.auto.conf, someone ran ALTER SYSTEM and your hand-edited postgresql.conf is being ignored. I've lost an hour to that more than once.
Now the census:
SELECT datname,
       state,
       count(*) AS conns
FROM pg_stat_activity
WHERE backend_type = 'client backend'
GROUP BY datname, state
ORDER BY conns DESC;
The backend_type filter has been available since PostgreSQL 10 and it is not optional. pg_stat_activity shows the checkpointer, walwriter, autovacuum launcher and every background worker. Counting rows without filtering inflates your number by ten or so and starts panics that didn't need to happen.
Then work out what you can actually hand to applications:
effective slots = max_connections
                - superuser_reserved_connections   -- default 3
                - reserved_connections             -- PG16+, default 0
On a stock instance that's 97. reserved_connections arrived in PostgreSQL 16 and holds back slots for roles granted pg_use_reserved_connections, which is genuinely useful for keeping a monitoring role alive when an app pool goes berserk.
One caveat on all of the above: a single SELECT against pg_stat_activity tells you what was happening at 14:03 on a Tuesday. The number that determines whether you need more slots is the peak, and the peak is usually somewhere you weren't looking.
Step 2 — Prove you're actually hitting the ceiling
High connection count and connection refusal are different problems with different fixes. When the limit is genuinely exhausted, the client gets:
FATAL: sorry, too many clients alreadyand the server logs it. Count them:
grep -c 'sorry, too many clients already' /var/log/postgresql/postgresql-*.logZero occurrences over a month of logs means you do not have a max_connections problem, whatever the dashboard says. That grep is the only reliable evidence that you exhausted the limit rather than merely approached it.
If you do have hits, capture peaks properly. Sample every ten seconds into a table:
CREATE TABLE conn_samples (
  ts        timestamptz NOT NULL DEFAULT now(),
  state     text,
  datname   text,
  usename   text,
  conns     int
);

-- with pg_cron, or from a shell loop calling psql every 10s
INSERT INTO conn_samples (state, datname, usename, conns)
SELECT state, datname, usename, count(*)
FROM pg_stat_activity
WHERE backend_type = 'client backend'
GROUP BY state, datname, usename;
Then read it back:
SELECT date_trunc('minute', ts) AS minute,
       state,
       max(conns) AS peak
FROM conn_samples
WHERE ts > now() - interval '24 hours'
GROUP BY 1, 2
ORDER BY 1 DESC, 3 DESC;
Read the breakdown by state before you read the total. A wall of idle sessions is an application pool that opened connections and never closed them. A wall of idle in transaction is a bug: someone began a transaction, went off to call an HTTP API, and left a snapshot pinned. Neither of those is a capacity problem, and raising max_connections gives the leak more room to grow.
The arithmetic mistake I see most often is trivial and nobody does it: 12 application pods, each with a connection pool of 20, is 240 connections against a server configured for 100. Nobody sized that. It emerged from a Helm chart. Count pods × pool size × environments before you touch the database.
Step 3 — The pooler question, answered before you touch the config
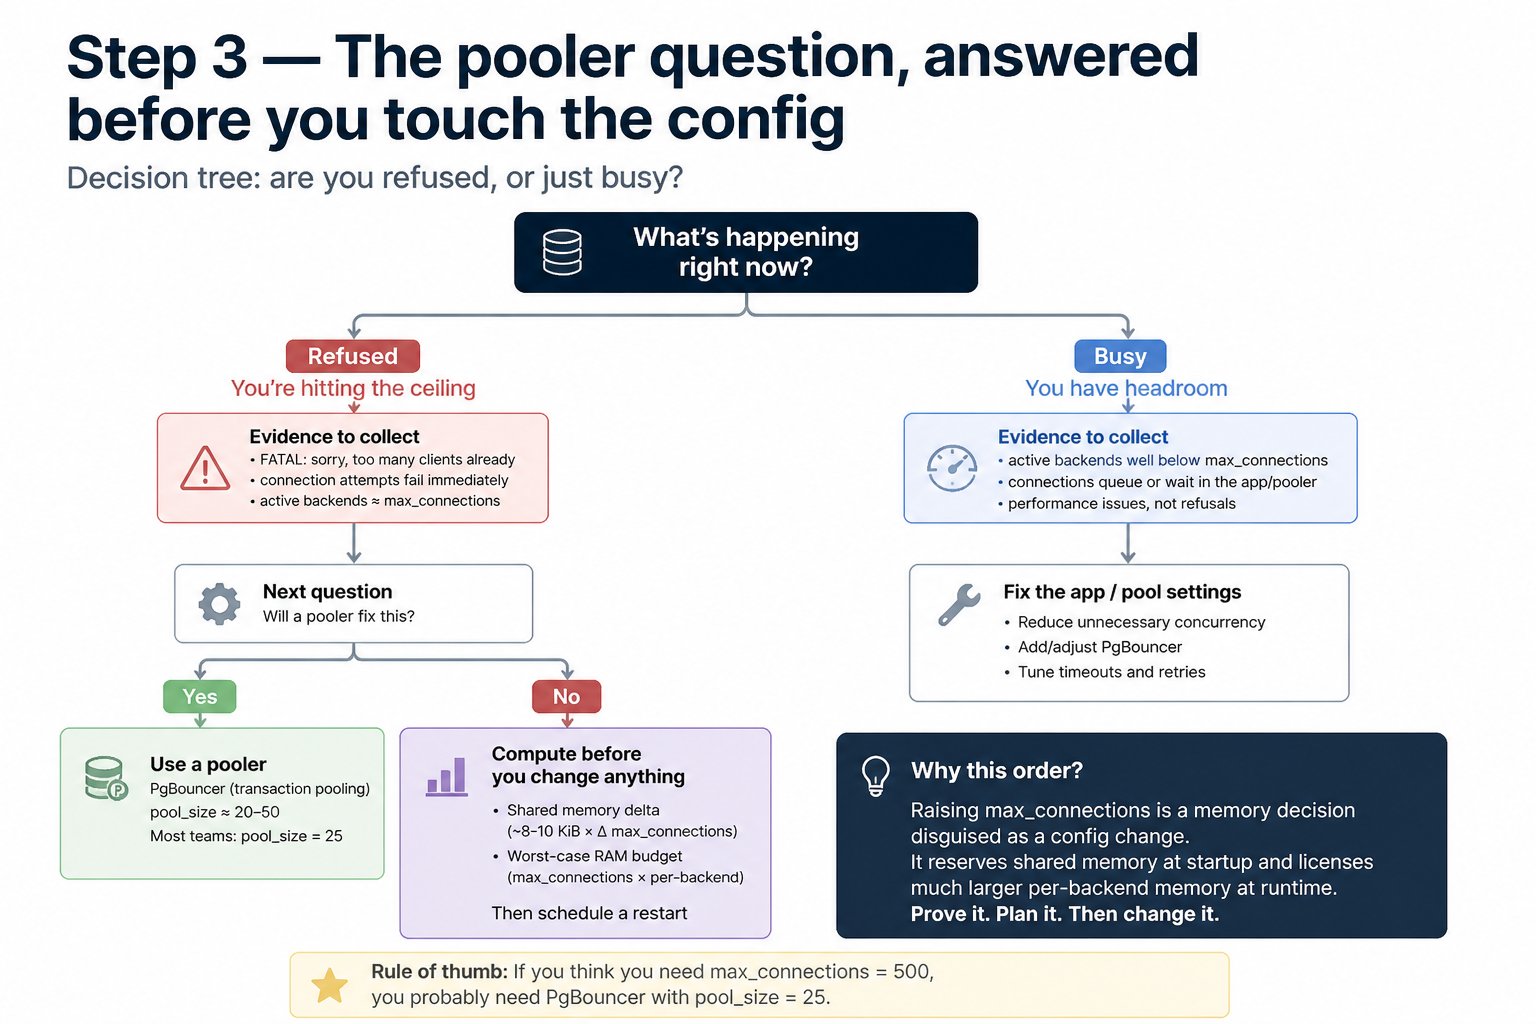
PgBouncer in transaction pooling mode assigns a server connection only for the duration of a transaction. Between transactions the client keeps its socket and the server connection goes back to the pool. That's what lets thousands of client connections share tens of server connections.
Sizing rule of thumb: anchor pool_size to core count, not to client count. On an 8-core box I start at 20–25 and measure. Throughput on OLTP workloads plateaus once concurrently active backends approach core count and degrades under heavy oversubscription. That's a well-reproduced pgbench result rather than a documented guarantee, so verify it on your hardware, but I have never had it come out backwards.
Transaction mode costs you session-scoped features. The list, with what to do about each:
| Doesn't work | Workaround | |---|---| | Session-level advisory locks | Use pg_advisory_xact_lock() instead | | LISTEN / NOTIFY | Dedicated direct connection, or a session-mode pool on a second port | | WITH HOLD cursors | Fetch the result set inside the transaction | | Temporary tables | CTEs, or an unlogged regular table keyed by job id | | Session-level SET | SET LOCAL, or set it in the connection string / role defaults | | Named prepared statements | PgBouncer 1.21+ supports protocol-level prepared statements via max_prepared_statements |
That last one removed the biggest historical blocker, since several drivers (Npgsql, some JDBC configurations) use prepared statements by default and used to break loudly under transaction mode.
Managed equivalents: RDS Proxy, Supavisor for Supabase, and on RDS/Aurora note that max_connections defaults to LEAST({DBInstanceClassMemory/9531392}, 5000), is a static parameter in a DB parameter group, and needs a reboot.
When is raising max_connections the right answer? Two cases. Long-running analytics or ETL sessions that hold a connection for minutes and cannot share it, and workloads that genuinely need many concurrently active backends rather than many mostly-idle ones. PostgreSQL 14's snapshot scalability work made holding many idle connections much cheaper on CPU, which helps, but it did nothing for per-backend memory.
I've never seen a web application that needed more than 200. Most teams asking for 500 need PgBouncer with pool_size = 25.
Step 4 — The memory arithmetic: shared vs private
Split the cost in two, because they behave completely differently.
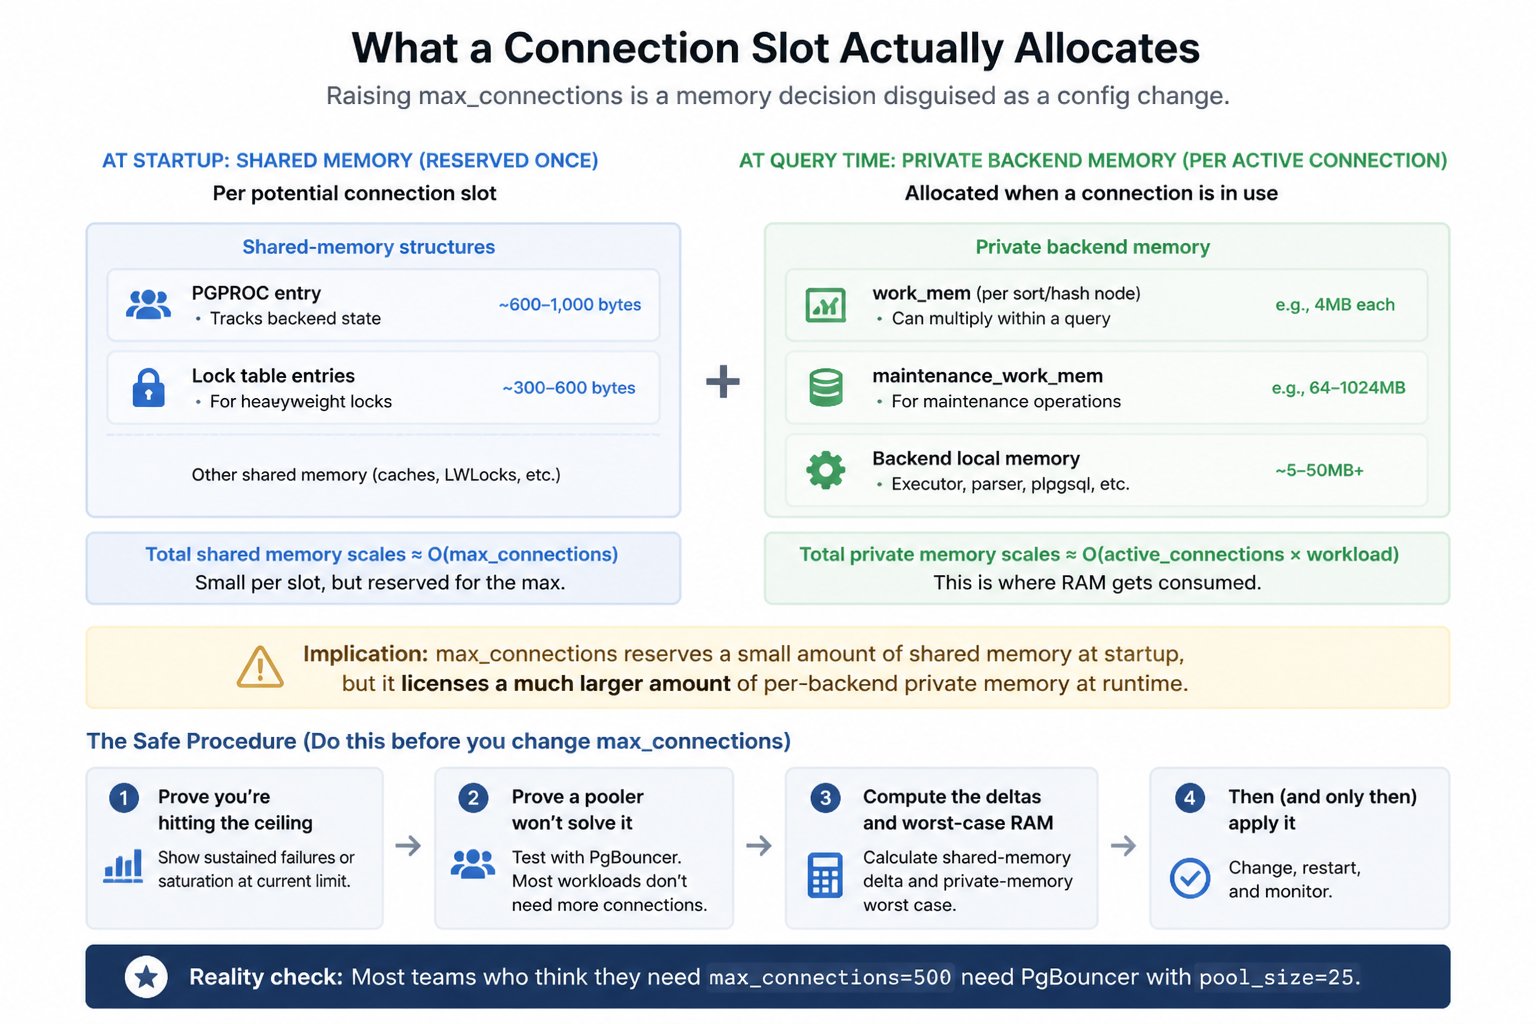
Shared, allocated at startup. Each slot gets a PGPROC entry, fastpath lock arrays, and entries in the lock tables. The shared lock table is sized as max_locks_per_transaction × (max_connections + max_prepared_transactions); with the default max_locks_per_transaction = 64, raising max_connections enlarges it proportionally. The predicate lock table scales the same way. This lands on the order of tens of kilobytes per slot. It's small, it's fixed, and it's exactly measurable, which is the next section.
Private, allocated at runtime. Each backend has a baseline (catalog caches, relcache, plan cache) that grows with how much schema the session touches. On top of that, work_mem is a per-operation limit. Not per connection, not per query. A single query can allocate work_mem for each sort, hash and materialise node in the plan, and each parallel worker gets its own allowance. Hash nodes get work_mem × hash_mem_multiplier, which was added in PG13 at 1.0 and defaulted to 2.0 from PG15 onward.
So max_connections × work_mem is both wrong and useful. Wrong as a prediction, because most connections are idle and allocate nothing — nine hundred idle connections next to one busy one are using none. Useful as a fear, because a single connection running a parallel hash join can consume many multiples of work_mem on its own, and the real ceiling is unbounded above that product.
One measurement warning: don't trust RSS per backend. Each backend's RSS includes the shared_buffers pages it touched, so summing RSS across 200 backends counts your buffer pool 200 times. Use PSS from /proc/<pid>/smaps_rollup, or ask Postgres directly with pg_backend_memory_contexts and pg_log_backend_memory_contexts() (both PG14+).
Measuring the shared-memory delta instead of guessing it
PostgreSQL 15 added two read-only parameters that end the guesswork:
SHOW shared_memory_size;
SHOW shared_memory_size_in_huge_pages;
And you can price a proposed value without restarting anything, using the -C option of the postgres executable. Run it as the OS user that owns the data directory:
sudo -u postgres postgres -D $PGDATA -C shared_memory_size
sudo -u postgres postgres -D $PGDATA -c max_connections=500 -C shared_memory_size
sudo -u postgres postgres -D $PGDATA -c max_connections=500 -C shared_memory_size_in_huge_pages
Here's what that returns on one of my boxes: 32 GB RAM, 8 vCPU, shared_buffers = 8GB, defaults elsewhere.
| max_connections | shared_memory_size | Δ from 100 | |---|---|---| | 100 | 8629 MB | — | | 200 | 8635 MB | +6 MB | | 500 | 8654 MB | +25 MB | | 1000 | 8686 MB | +57 MB |
Roughly 65 KB per slot, and going from 100 to 1000 connections grows shared memory by 0.7%. Run the command on your own instance rather than trusting my table, because the slope depends on max_locks_per_transaction, max_prepared_transactions and version.
The point of the table is what it proves: shared memory is almost never what kills you. Raising max_connections rarely fails at startup. It fails three days later, in private memory, under load.
Since 9.3 the main shared region is mmap'd anonymous shared memory rather than System V, so SHMMAX/SHMALL tuning is not normally needed on Linux. Semaphore requirements scale with MaxBackends, but default Linux limits are high enough that this rarely constrains realistic values.
A RAM budget worksheet
Same box: 32 GB, 8 vCPU, shared_buffers = 8GB, work_mem = 16MB, maintenance_work_mem = 512MB, autovacuum_max_workers = 3, max_parallel_workers_per_gather = 2, hash_mem_multiplier = 2.0.
At max_connections = 200:
| Component | Formula | Size | |---|---|---| | OS + page cache reserve | judgement, ~12% of RAM | 4.0 GB | | Shared memory | measured shared_memory_size | 8.6 GB | | Autovacuum workers | 3 × maintenance_work_mem | 1.5 GB | | Backend baselines | 200 × ~8 MB (measure yours) | 1.6 GB | | Concurrent heavy queries | 8 × (2 sorts × 16MB + 1 hash × 32MB) × 3 procs | 1.5 GB | | Total | | 17.2 GB |
Comfortable, with 14 GB of slack for a bad day.
Now the same box at max_connections = 500, with the app pool actually using them:
| Component | Size | |---|---| | OS + page cache | 4.0 GB | | Shared memory | 8.65 GB (+25 MB, irrelevant) | | Autovacuum | 1.5 GB | | Backend baselines (500 × 8 MB) | 4.0 GB | | Concurrent heavy queries (20 × 192 MB) | 3.8 GB | | Total | 22.0 GB |
Still fits, on a normal day. Then month-end reporting runs and 50 sessions go heavy at once — not because the config changed, but because raising the limit made it possible for five times as many connections to be busy simultaneously: that line becomes 9.6 GB and the total is 27.8 GB, page cache gets evicted, I/O gets worse, queries take longer, more sessions pile up. That's the OOM. The shared-memory number never moved enough to warn you.
The "concurrent heavy queries" multiplier is the number to argue about, and it's workload-dependent. Don't take mine. Measure it: sample pg_stat_activity for state = 'active' alongside pg_stat_statements and count how many sessions run plans with sorts or hashes simultaneously at your busiest hour. If you need help picking the underlying values, I've written separately about sizing shared_buffers and work_mem.
Step 5 — Applying the change safely
ALTER SYSTEM SET max_connections = 200;This writes postgresql.auto.conf, which is read after postgresql.conf and therefore overrides it. If someone later edits postgresql.conf by hand and nothing changes, this is why.
Verify it's staged:
SELECT name, setting, pending_restart
FROM pg_settings
WHERE name = 'max_connections';
pending_restart = true means the file has the new value and the running server does not.
Pre-restart checklist:
- Huge pages. If
huge_pages = on, runpostgres -D $PGDATA -c max_connections=<new> -C shared_memory_size_in_huge_pagesand confirmvm.nr_hugepagesis at least that. Withon, an insufficient pool means the server refuses to start.tryfalls back to normal pages. - Overcommit. The docs recommend
vm.overcommit_memory = 2with an appropriateovercommit_ratioon dedicated servers, so allocation failures surface as errors rather than as an OOM kill of a random backend. - OOM score. Set the postmaster's
oom_score_adjto-1000and usePG_OOM_ADJUST_FILE/PG_OOM_ADJUST_VALUEso child backends inherit a normal, killable score. Better to lose one backend than the whole cluster. - Containers. Budget against the cgroup memory limit, not host RAM.
- Managed. Change the parameter group value and schedule the reboot; static parameters don't apply until then.
Restart in a window, tail the log, then confirm:
SHOW max_connections;
SHOW shared_memory_size;
Rollback if it won't start. postgresql.auto.conf is plain text and last value wins, so you can edit or truncate it directly as the postgres user, then start normally. Or bypass it for one boot:
sudo -u postgres pg_ctl -D $PGDATA start -o "-c max_connections=100"Then fix the file properly.
The failure modes, ranked by how often I see them
| # | Symptom | Cause | Fix | |---|---|---|---| | 1 | Server runs fine for days, then dies at month-end. dmesg shows Out of memory: Killed process ... (postgres) | Private memory budget assumed average load, not peak concurrency | Redo the worksheet with the real concurrent-heavy-query count; cut work_mem and grant it per-role or per-statement instead | | 2 | Server refuses to start after restart; log says huge pages could not be allocated | huge_pages = on, larger shared_memory_size, unchanged vm.nr_hugepages | Raise nr_hugepages to the value from -C shared_memory_size_in_huge_pages, or set huge_pages = try | | 3 | Refusals stop, throughput drops | More active backends than cores; CPU and I/O oversubscribed | Put a pooler in front and cap active concurrency near core count | | 4 | sorry, too many clients already continues at the new limit | Connections leaked, not needed — you just made a bigger bucket for the same leak | Break down by state; fix the app pool; add idle timeouts | | 5 | OOM inside a container while the host shows free memory | Budget computed against host RAM, cgroup limit lower | Budget against the cgroup limit; align shared_buffers and work_mem to it |
Guardrails after the change
Partition the slots so one tenant can't eat them all:
ALTER DATABASE reporting CONNECTION LIMIT 40;
ALTER ROLE etl_service  CONNECTION LIMIT 10;
Reclaim leaks server-side:
ALTER SYSTEM SET idle_in_transaction_session_timeout = '60s';  -- PG9.6+
ALTER SYSTEM SET idle_session_timeout = '30min';               -- PG14+
SELECT pg_reload_conf();
Be careful with idle_session_timeout if your app pool doesn't handle reconnects gracefully; test it in staging.
And alert on utilisation as a percentage of effective slots, not an absolute count, so the alert survives the next resize. A raised max_connections makes an absolute-count alert meaningless overnight:
SELECT round(100.0 * count(*) /
       (current_setting('max_connections')::int
        - current_setting('superuser_reserved_connections')::int), 1) AS pct_used
FROM pg_stat_activity
WHERE backend_type = 'client backend';
Alert on the sampled peak over a window, not the instantaneous value — the same 10-second sampling from Step 2, turned into a permanent job rather than a one-time investigation. A number checked once and never again is not a monitoring strategy. More on continuous connection monitoring here.
Where MyDBA fits
The MyDBA free health check automates the boring half of this. It flags instances running without a pooler, reports connection utilisation against the effective limit rather than the raw setting, and returns tailored max_connections, shared_buffers and work_mem values sized to the instance's actual RAM and platform, whether that's RDS, Aurora or self-hosted.

The connection section of a health check report: current usage against effective slots, pooler status, and a recommended value with the reasoning behind it.
The one-page checklist
1. grep -c 'sorry, too many clients already' across your logs. Zero hits means stop here. 2. Census with backend_type = 'client backend', grouped by state and datname. 3. Sample every 10 seconds for a full business cycle. Read the peak, not the sample. 4. Count app pods × pool size × environments. Compare to effective slots. 5. If most sessions are idle, deploy PgBouncer in transaction mode with pool_size in the low tens. Check the session-feature list first. 6. If you still need more slots, price the shared memory: postgres -D $PGDATA -c max_connections=NNN -C shared_memory_size. 7. Build the private-memory worksheet with a real concurrent-heavy-query count, and remember work_mem is per node, doubled for hashes, multiplied by parallel workers. 8. Check huge pages, overcommit, OOM score, cgroup limit. 9. ALTER SYSTEM SET max_connections = ..., confirm pending_restart, restart in a window. 10. Verify SHOW max_connections and SHOW shared_memory_size. Add CONNECTION LIMIT caps and idle timeouts. Alert on peak utilisation percentage.
If step 5 solves it, you never needed the restart. That's the outcome I want for you.