One Dashboard for Your Entire PostgreSQL Fleet
One Dashboard for Your Entire PostgreSQL Fleet
The Problem
The typical PostgreSQL monitoring setup looks like this: Grafana for system metrics (CPU, memory, disk I/O), manual pg_stat_statements queries for slow query investigation, pgAdmin for ad-hoc table inspection, and a custom Python script posting alerts to Slack. Four tools, four logins, four mental models — and none of them talk to each other.
Grafana shows CPU spiked at 2 PM. pg_stat_statements shows a query that started consuming 10x more time around 2 PM. pgAdmin shows the table that query reads is 40% bloated. The Slack alert fired because response times exceeded the threshold. Four pieces of the same puzzle, scattered across four tools. Correlating them requires you to mentally hold timestamps, table names, and query fingerprints while switching between browser tabs and terminal sessions.
This fragmentation has a cost beyond inconvenience. When an incident happens, the first 20 minutes are spent gathering context: which queries are slow, what changed, which tables are affected, is replication lagging, are connections exhausted. In a setup with 4+ tools, those 20 minutes are spent logging into different systems and cross-referencing data manually. With 5 PostgreSQL instances across production, staging, and replicas, the matrix of things to check grows multiplicatively.
The deeper problem is that fragmented monitoring discourages proactive work. Nobody opens four tools to do a routine health check. The tools only come out during incidents — which means problems are discovered reactively instead of caught early.
How to Detect It
Each individual tool gives a partial view. Here is what a complete health check looks like across separate tools:
System metrics (Grafana or htop):
# CPU, memory, disk I/O, disk space
top -bn1 | head -5
df -h /var/lib/postgresql
iostat -x 1 3
Query performance (pg_stat_statements):
SELECT queryid, calls, mean_exec_time, total_exec_time,
       rows, shared_blks_hit, shared_blks_read
FROM pg_stat_statements
ORDER BY total_exec_time DESC LIMIT 10;
Table health (pg_stat_user_tables):
SELECT relname, n_dead_tup, n_live_tup, last_autovacuum,
       seq_scan, idx_scan,
       pg_size_pretty(pg_total_relation_size(relid)) AS total_size
FROM pg_stat_user_tables
ORDER BY n_dead_tup DESC LIMIT 10;
Replication status (pg_stat_replication):
SELECT application_name, state, sent_lsn, write_lsn,
       flush_lsn, replay_lsn,
       pg_wal_lsn_diff(sent_lsn, replay_lsn) AS replay_lag_bytes
FROM pg_stat_replication;
Four queries, four different result sets, four mental models. You can do this. You have probably done it hundreds of times. The question is whether this is a good use of your time during an incident when every minute matters — or during a Tuesday afternoon when you could be building features instead of running health check scripts.
How myDBA.dev Shows It
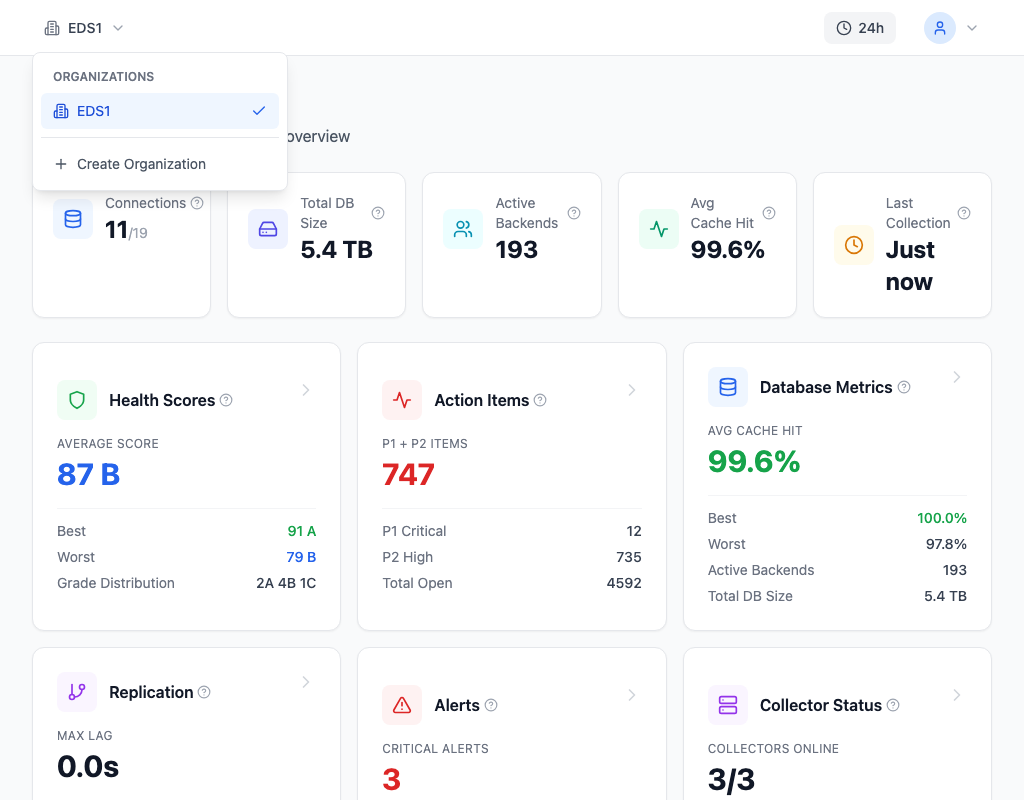
myDBA.dev consolidates everything into a single dashboard. The main view shows the metrics that matter most at a glance: active sessions (current and trending), transaction rate (commits and rollbacks per second), cache hit ratio, replication lag in bytes and time, disk usage with growth projection, and an overall health score computed from 60+ automated checks across 10 domains.
Each metric is a time series, not a snapshot. Transaction rate is not just "450 TPS right now" — it is a chart showing the last 24 hours so you can see the spike at 2 PM and correlate it with everything else on the same timeline. Click any metric to drill into the detail: the transaction rate chart leads to the query analysis page, which shows which specific queries drove the spike.
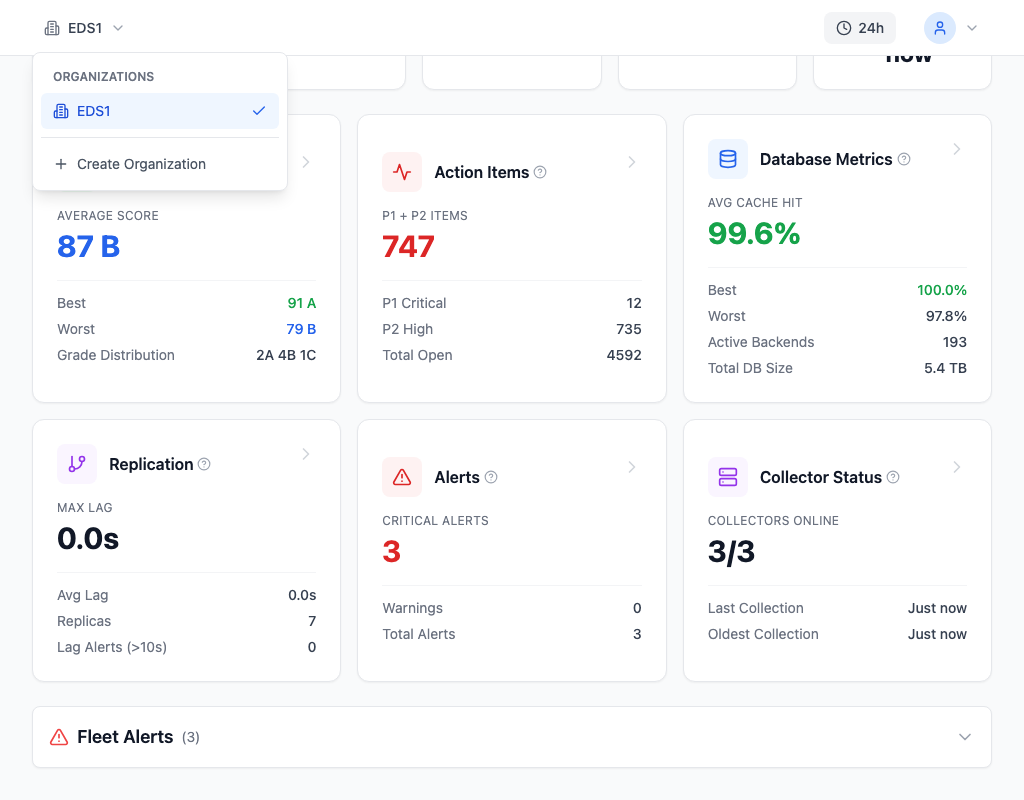
The fleet view shows every PostgreSQL instance in one place. Each row displays the instance name, version, connection count, health score, replication role (primary or replica), and key alerts. Color-coded health scores make it possible to scan 10 instances in seconds and focus on the one that needs attention. The fleet view answers "is anything broken right now?" without opening separate monitoring for each instance.
Beyond the dashboard, myDBA.dev includes query performance tracking with EXPLAIN plan analysis, index advisor recommendations, health checks with specific fix suggestions, extension monitoring for TimescaleDB and pgvector, lock chain visualization, schema diff between snapshots, and configurable alerting. Every feature reads from the same metric store, so correlating a slow query with a bloated table with a vacuum backlog happens automatically — no manual cross-referencing between tools.
How to Fix It
Getting started takes 5 minutes. The collector is a single Go binary (~15 MB) that runs as a systemd service on any Linux machine with network access to your PostgreSQL instance.
# Download and install
curl -L https://mydba.dev/download/linux-amd64 -o /usr/local/bin/mydba-collector
chmod +x /usr/local/bin/mydba-collector

# Run as systemd service
# (full setup instructions at mydba.dev/docs/collector)
The collector uses under 1% CPU and approximately 50 MB RAM. It collects metrics in three tiers: Fast (every 15 seconds — sessions, locks, replication lag), Medium (every 60 seconds — table stats, index usage, query performance), and Slow (every 5 minutes — bloat estimates, extension health, configuration changes). Metrics flow within 15 seconds of starting the collector. These base intervals apply on Pro and during the first seven days of Free; Free collection frequency reduces after 7 days.
Shared managed collection and self-hosted collector software are included. The optional dedicated managed collector costs £50 per machine/month. A managed collector needs a supported network route to your PostgreSQL instance; running the collector in your network can reach private databases and sends telemetry to the hosted MyDBA service.
Both options provide identical monitoring capabilities. The self-hosted collector is for teams that require the collection agent to run within their own network. The managed collector is for teams that want zero operational overhead.
How to Prevent It
Free covers one primary or standalone PostgreSQL instance, no replicas, all databases on that instance, all team members, all non-AI diagnostics and 30-day history. Collection frequency reduces after 7 days. On either plan, use an OpenRouter, OpenAI or Anthropic key with no product monthly AI quota; provider API usage is billed by the provider. New Pro subscriptions also include 20 platform-funded AI operations per organization per UTC calendar month.
Pro costs £50 per primary and £25 per replica per month (GBP), with every monitored instance billed, including the first. All databases, team members, non-AI diagnostics and 30-day history are included.
Pro adds fleet capacity, sustained collection frequency and the included platform AI allowance. Both plans include all non-AI diagnostics and 30-day history.
Start at mydba.dev. Five minutes to first metrics.