PostgreSQL monitoring: what to watch and which tools do it
Monitor six things in PostgreSQL: query time from pg_stat_statements, sessions and locks from pg_stat_activity and pg_locks, storage and WAL growth, replication lag and slot retention, vacuum health, and a small set of leading metrics such as connections and transaction-ID age. The built-in views hold all of it; tools add history, alerting and interpretation.
Key facts
| Fact | Value | |---|---| | pg_stat_activity | One row per server process; the columns that matter are state, wait_event_type/wait_event and query_start (docs) | | pg_stat_statements | Cumulative per-statement counters; read total_exec_time and calls as deltas between snapshots. Needs shared_preload_libraries and a restart; keeps 5,000 statements by default (docs) | | pg_stat_database | Per-database temp_bytes, deadlocks, xact_rollback and the blks_hit/blks_read pair behind every cache-hit ratio (docs) | | pg_stat_replication | On the primary, one row per standby with write_lag, flush_lag and replay_lag as intervals plus sent_lsn/replay_lsn for lag in bytes (docs) | | pg_replication_slots | active, wal_status and (PostgreSQL 13+) safe_wal_size: an inactive slot retains WAL until the disk fills unless max_slot_wal_keep_size is set (docs) | | pg_stat_user_tables | n_dead_tup, n_live_tup, last_autovacuum and seq_scan per table; the vacuum and index-usage signals live here (docs) | | pg_locks | One row per lock held or awaited; granted = false is a waiter, and pg_blocking_pids(pid) names who it waits on (docs) | | pg_stat_checkpointer (PostgreSQL 17+) | num_requested versus num_timed; requested checkpoints outnumbering timed ones means max_wal_size (default 1 GB) is too small for the write rate (docs) | | pg_stat_io (PostgreSQL 16+) | reads, hits and evictions per backend type and I/O context, which separates autovacuum and bulk-load I/O from client-backend I/O (docs) | | Fleet data (MyDBA seo_aggregate_health_stats, 2026-09-16) | Across 50 monitored instances, 86.0% have no auto_explain configured; across 38, 52.6% run with log_lock_waits off; across 31, 67.7% carry duplicate indexes |
PostgreSQL ships with more monitoring data than most databases: the cumulative statistics system, the dynamic activity views, the pg_locks catalog and a handful of extensions cover almost everything a tool later shows you. What the built-in views do not do is remember anything, compare anything to yesterday, or wake anyone up. This guide is in two halves: what to watch, organised into six themes with a deeper article on each, and which tools do the watching, with the trade-offs stated plainly.
What to monitor
The themes below are ordered by how often they explain an incident, not by how often they appear in dashboards. Cache-hit ratio is famous and rarely decisive; an inactive replication slot is obscure and fills disks.
Queries
Query time is where most PostgreSQL performance work starts and ends, and pg_stat_statements is the only built-in source that aggregates it per statement. It has to be loaded through shared_preload_libraries and needs a restart, then CREATE EXTENSION per database; without both steps the view does not exist (docs). Its counters are cumulative since the last reset, so the useful number is never mean_exec_time on its own but the change in total_exec_time and calls between two readings. A statement that was expensive last month and is idle today still tops a lifetime ranking.
Two blind spots are worth knowing before you trust the numbers. The view exposes min, max, mean and stddev for execution time but no percentiles, so a p95 has to come from elsewhere (docs). And a statement cancelled by statement_timeout leaves calls = 0 in its row, so the queries that hurt most can be the ones the view appears to say never ran. The pg_stat_statements guide below measures that on PostgreSQL 18.
Wait events are the other half of query monitoring. pg_stat_activity.wait_event_type and wait_event say what an active backend is waiting for right now: a lock, a buffer pin, I/O, a client (docs). Sampled every few seconds and grouped by statement, they turn "this query is slow" into "this query spends its time on LWLock:BufferMapping" or "on Lock:transactionid", which points at different fixes. Sampling is the key word: the view is a snapshot, so any wait-event history is something a tool has to build.
Read: How do you set up and read pg_stat_statements in PostgreSQL?, Postgres wait events guide, MyDBA wait event analysis
Activity and locks
pg_stat_activity is the first view to open in an incident. It has one row per server process, including autovacuum workers and WAL senders, so filter on backend_type = 'client backend' for user sessions (docs). The two states that matter most are active, ordered by now() - query_start to find the longest runner, and idle in transaction, which holds locks and blocks vacuum from removing dead rows while doing nothing. idle_in_transaction_session_timeout defaults to 0, meaning off, so an application that forgets to commit can hold a transaction open for days unless you set it (docs).
Locks are the activity problem that is hardest to read from the raw views. pg_locks lists every lock held or awaited, but a chain of blocked sessions has to be reconstructed by calling pg_blocking_pids() for each waiter and following the result upward to the root blocker (docs). The session to cancel is the one at the top of that tree, which is rarely the one that first caught your eye. Turning on log_lock_waits writes a log line whenever a session waits longer than deadlock_timeout (default 1 s), which is the cheapest form of lock history there is (docs); across 38 instances in MyDBA's aggregate stats, 52.6% still have it off.
Connection count belongs here too, because it is the metric that moves from "fine" to "down" fastest. max_connections defaults to 100 (docs), each connection is a process with its own memory, and raising the limit without a pooler trades a connection error for a memory problem. The two guides below cover how much memory a connection really costs and when PgBouncer or a built-in pooler is the right answer.
Read: How do you see what is running right now in PostgreSQL?, MyDBA activity monitor, Postgres max connections memory guide, Postgres connection pooling
Storage and capacity
Storage monitoring has two questions: how big is it, and when does it hit the wall. Size is well served by the built-in functions. pg_database_size() gives one database in bytes, pg_total_relation_size() gives a table with its TOAST data and indexes, and the difference between pg_table_size() and pg_indexes_size() shows how much of a table is index (docs). None of them include WAL, temp files or other databases, which is why du on the data directory and the RDS console both report more than the sum of your databases. A daily snapshot of these numbers into a table of your own is the smallest useful monitoring system you can build.
Runway is the harder question because PostgreSQL has four separate cliffs. Disk fills. pg_wal grows past max_wal_size (a soft target, not a cap) whenever an inactive replication slot or a slow archiver holds segments back, and max_slot_wal_keep_size defaults to -1, unlimited (docs). An integer sequence stops at 2,147,483,647 (docs). And transaction-ID age approaches wraparound, at which point PostgreSQL refuses new transactions when fewer than 3 million remain (docs). Each has its own query and its own lead time, and each is quiet until it is not.
Vacuum is the mechanism behind two of those cliffs, so it gets monitored alongside them. pg_stat_user_tables.n_dead_tup against n_live_tup and last_autovacuum per table tell you whether autovacuum is keeping up; the default trigger is 50 rows plus 20% of the table, which on a billion-row table means 200 million dead rows before a vacuum starts (docs). Bloat, the dead space left behind when vacuum falls behind, is only an estimate from the outside; across 50 instances in MyDBA's aggregate stats, 44.0% fail the index-bloat check.
Read: How do you check the size of tables and schemas in PostgreSQL?, How do I check the total size of a PostgreSQL database?, How do you plan PostgreSQL capacity for disk, WAL and sequences?, MyDBA WAL and vacuum monitoring
Replication
Replication lag is one number in most dashboards and four in PostgreSQL. pg_stat_replication on the primary reports write_lag, flush_lag and replay_lag per standby, each a stage in the journey of a WAL record from the primary's send buffer to being visible on the replica (docs). The sent_lsn/replay_lsn pair gives the same lag in bytes, which is the only form that still works when the replica is not replaying at all, since the interval columns go NULL. On the standby side, pg_last_xact_replay_timestamp() compared to now() is the replica's own view of how far behind it is, and it lies during quiet periods when no WAL is arriving to replay.
Slot retention is the replication metric that costs the most when missed. A replication slot exists to stop the primary discarding WAL a consumer has not yet received; when the consumer disappears, the slot keeps working exactly as designed and the disk fills. pg_replication_slots.active = false with a growing distance between restart_lsn and pg_current_wal_lsn() is the signature, and wal_status = 'lost' means the damage is already done (docs).
Read: Postgres replication lag four stages
Health and alerting
Everything above is a metric; a health check is a metric with a threshold and an opinion. The difference matters because the useful thresholds in PostgreSQL are not obvious. Cache-hit ratio below 99% is fine on an analytics workload whose working set never fits in memory. XID age at 200 million is the point autovacuum starts a forced freeze (autovacuum_freeze_max_age default), not an emergency (docs). A requested-checkpoint count that exceeds the timed count is a configuration finding, not a failure. The twelve-metrics guide below is an attempt to pick the leading indicators, the ones that move in the days before an outage, and give each a defensible threshold with a source.
Alerting is where monitoring gets expensive if it is wrong. The two failure modes are alerts on metrics that are only interesting in context, which train people to ignore the channel, and alerts that only fire once the database is already down. The practical middle is a short list of conditions that are always bad (connections above 90% of max_connections, XID age past the freeze threshold, an inactive slot retaining WAL, disk below a fixed free percentage) delivered to a channel someone actually reads, with everything else left to a score you look at weekly.
Scheduled jobs are the health item most tools skip. If you run pg_cron, cron.job_run_details records each run's status and duration, and a job that has been silently failing for a fortnight looks identical to a healthy one from the outside (pg_cron README). Monitoring it means monitoring the last successful run time per job, not the job count.
Read: Which 12 PostgreSQL metrics predict an outage before it happens?, MyDBA health score tracking, MyDBA alerting, MyDBA dashboard overview, pg_cron monitoring for Postgres scheduled jobs
Managed providers
Managed PostgreSQL changes what is worth monitoring, and sometimes what is possible. On Aurora PostgreSQL the storage layer is shared across the cluster and grows automatically, so per-instance disk-free is not the capacity metric it is on a self-hosted box; the questions move to storage cost, I/O billing and replica lag measured in milliseconds rather than WAL bytes (AWS docs). On Neon, compute scales to zero and the first query after a pause pays a cold-start cost, which shows up in latency percentiles as a shape rather than a level. None of this is visible from pg_stat_*; it comes from the provider's own metrics.
What managed providers do not change is the inside of the database. pg_stat_statements, pg_stat_activity, vacuum, bloat, missing indexes and idle-in-transaction sessions all behave the same on RDS as on a VM, and the provider console generally shows the host, not the workload. The hosting comparison below is written from that angle: what each provider exposes, what it hides, and what you still have to bring yourself.
Read: Aurora PostgreSQL storage model, Neon Postgres review, Best Postgres hosting
Which tools do it
Every tool in this section reads the same views listed in the key facts. They differ in what they keep, how they present it, and who has to run them. The honest version of the comparison is that each category is the right answer for somebody.
Built-in views and psql
The zero-cost option is the one every other tool is built on: psql, the pg_stat_* views, pg_stat_statements, and the server log with log_min_duration_statement, log_lock_waits and log_checkpoints enabled (docs). It answers "what is happening right now" completely and "what happened an hour ago" not at all, unless you snapshot the views into a table on a schedule, which many teams do and which is a monitoring tool in all but name. The cost is engineering time, the trade-off is that the person who wrote the snapshot job is the only one who understands it, and the strength is that there is nothing to install, license or trust.
Open source
pgwatch (formerly pgwatch2, from CYBERTEC) is a PostgreSQL-only collector that runs SQL metric definitions on a schedule, stores results in PostgreSQL or Prometheus, and ships Grafana dashboards (GitHub). It is the most Postgres-aware of the free options and the metric set is editable SQL, so anything you can query you can graph. You run three components and alerting is whatever Grafana gives you.
postgres_exporter + Prometheus + Grafana is the standard choice for teams already on Prometheus (GitHub). The exporter exposes the statistics views as metrics; everything else is your Prometheus setup. Query-level detail depends on extra queries you configure, and the default dashboards are instance-level.
PgHero is a Rails application that reads pg_stat_statements and the catalog and presents slow queries, unused and duplicate indexes, and connection state on a single page (GitHub). It is quick to stand up and easy to read; history and alerting are limited.
pgBadger parses the server log rather than querying the database, producing an HTML report of slowest queries, lock waits, checkpoints, temp files and errors (pgBadger). It is a report generator, not a monitor, and the depth of the report is set entirely by your logging configuration. It adds no load to the database.
Percona Monitoring and Management (PMM) is a self-hosted server with Grafana dashboards and a Query Analytics view that covers PostgreSQL alongside MySQL and MongoDB (Percona docs). It is the most complete free option for a mixed estate, and the trade-off is the operational weight of running the PMM server itself.
Across all five the pattern is the same: no licence, real depth if you invest the time, and an ongoing operations burden that lands on the same people who run the databases.
Provider consoles
Amazon RDS and Aurora expose Performance Insights, which AWS has been folding into CloudWatch Database Insights: wait-event load per instance, top SQL by load, and host metrics in the same console (AWS docs). Retention beyond seven days and the advanced tier are paid. Google Cloud SQL has Query Insights, which gives per-query latency and load with tags for application context (Google docs). Azure Database for PostgreSQL exposes server metrics through Azure Monitor and Query Store data for statement history (Microsoft docs).
The strength of all three is that they are already there: no collector, no credentials, and host metrics the database views cannot see. The limits are that each only covers its own provider, none of them scores health or explains a finding, and the deeper diagnostics usually sit behind a paid tier. If your whole estate is on one cloud, the console is a reasonable starting point; the moment there is a second provider or a self-hosted instance it stops being one tool.
Postgres-native SaaS
pganalyze is the longest-established PostgreSQL-specific service: a collector ships statistics and log data, and the product focuses on query performance, index recommendations, EXPLAIN plan collection via auto_explain, and schema change tracking (pganalyze docs). pgDash covers a similar surface from a collector called pgmetrics, with dashboards for queries, replication, locks and vacuum and a self-hosted option (pgDash). MyDBA is what this site runs and is described in the next section; the short version is a Go collector, a continuous 135-check health score across 16 domains, and an estate view that rolls each cluster up to its worst member.
The common trade-off is a monthly cost and a new vendor in exchange for depth that general tools do not reach and operations you do not run. Each of the three reads the database differently, prices differently, and makes different choices about what to show first. The comparison articles linked below try to be specific about where MyDBA is behind as well as ahead: MyDBA vs pganalyze is the closest match.
General observability platforms
Datadog Database Monitoring collects query metrics, explain plans and wait-event samples from PostgreSQL and correlates them with APM traces and host metrics (Datadog docs). New Relic has a PostgreSQL integration that reports instance and database-level metrics into the same platform as application telemetry (New Relic docs). The strength is correlation: when a request is slow, the database is one panel among many, and that is often the fastest way to find out whether the database is even the problem.
The limits are that PostgreSQL is one of hundreds of integrations, so vacuum health, bloat, index quality and configuration review are thin or absent, and per-host or per-query pricing across a large fleet adds up. If you already pay for one of these platforms, its PostgreSQL integration is worth enabling before buying anything else; whether it is enough depends on how often the database turns out to be the problem. MyDBA vs Datadog goes through this in detail.
Side by side
| Category | Query-level detail | Health checks with thresholds | Alerting | Cost and ops burden | |---|---|---|---|---| | Built-in views + psql | Full, but no history unless you snapshot it | None; you set the thresholds | None | Free; engineering time to build anything durable | | Open source (pgwatch, postgres_exporter, PgHero, pgBadger, PMM) | Good with pg_stat_statements; pgBadger from logs | Dashboards, not scored checks | Via Grafana or Prometheus Alertmanager | Free licence; you run and upgrade every component | | Provider consoles (RDS/Aurora, Cloud SQL, Azure) | Good for the provider's own instances | Recommendations vary by provider; no cross-provider view | Cloud-native alarms | Included at a basic tier; deeper retention paid; one provider only | | Postgres-native SaaS (pganalyze, pgDash, MyDBA) | Deep: plans, index advice, wait events | Yes, with opinions and fix SQL | Built in | Monthly fee; collector to install; no servers to run | | General observability (Datadog, New Relic) | Query samples and plans on paid tiers | Thin for PostgreSQL specifics | Strong, cross-stack | Per-host or per-query fees; already paid for if you use the platform |
Two more comparisons from the same series: MyDBA vs pgwatch and MyDBA vs PMM. For a broader survey that includes tools for other engines, see best database monitoring tools.
How MyDBA covers this
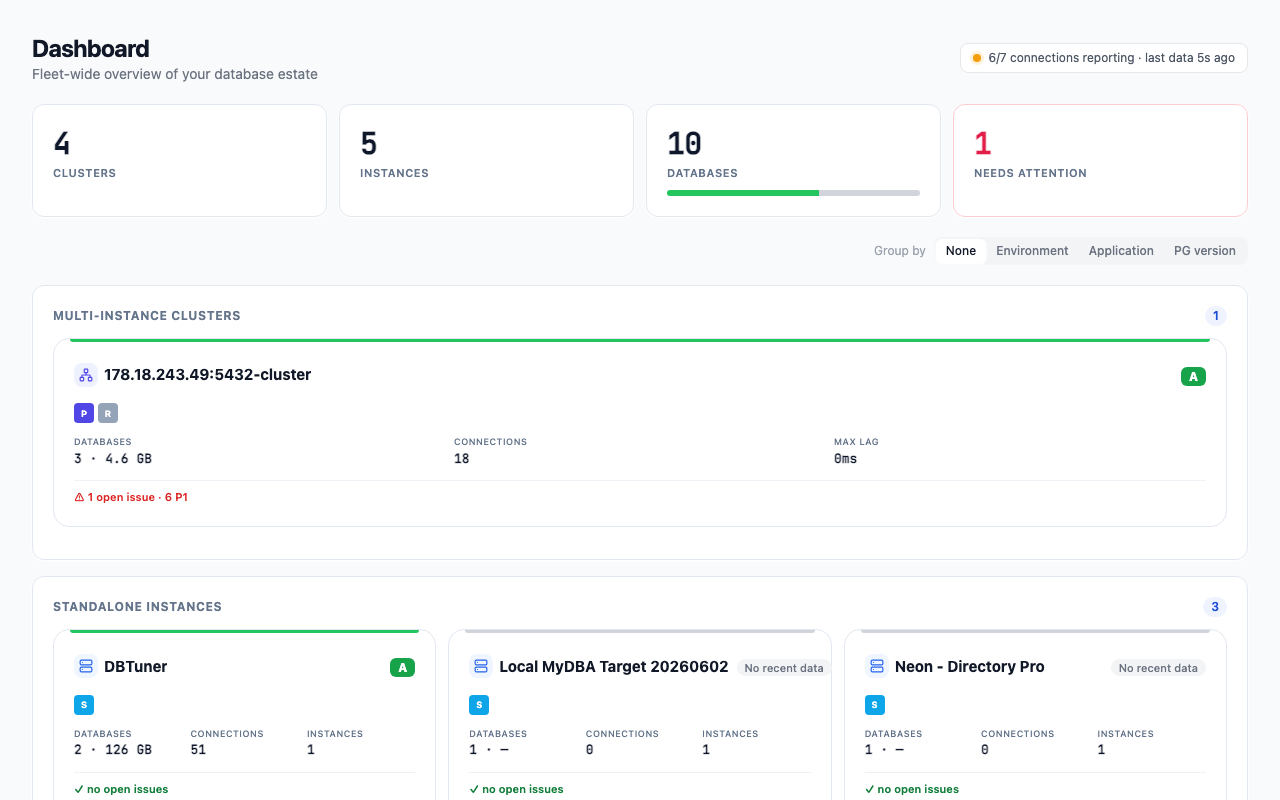
The Estate view is the dashboard: one card per cluster, graded by its worst member, so a healthy primary cannot hide a replica that is 40 minutes behind. Expanding a card shows the replication topology, the databases on each member, and 24-hour CPU, memory and disk-throughput sparklines per instance where the collector can see the host. The grade on the card is the same grade the health-check page shows for the weakest connection in the cluster, which keeps the two from disagreeing.
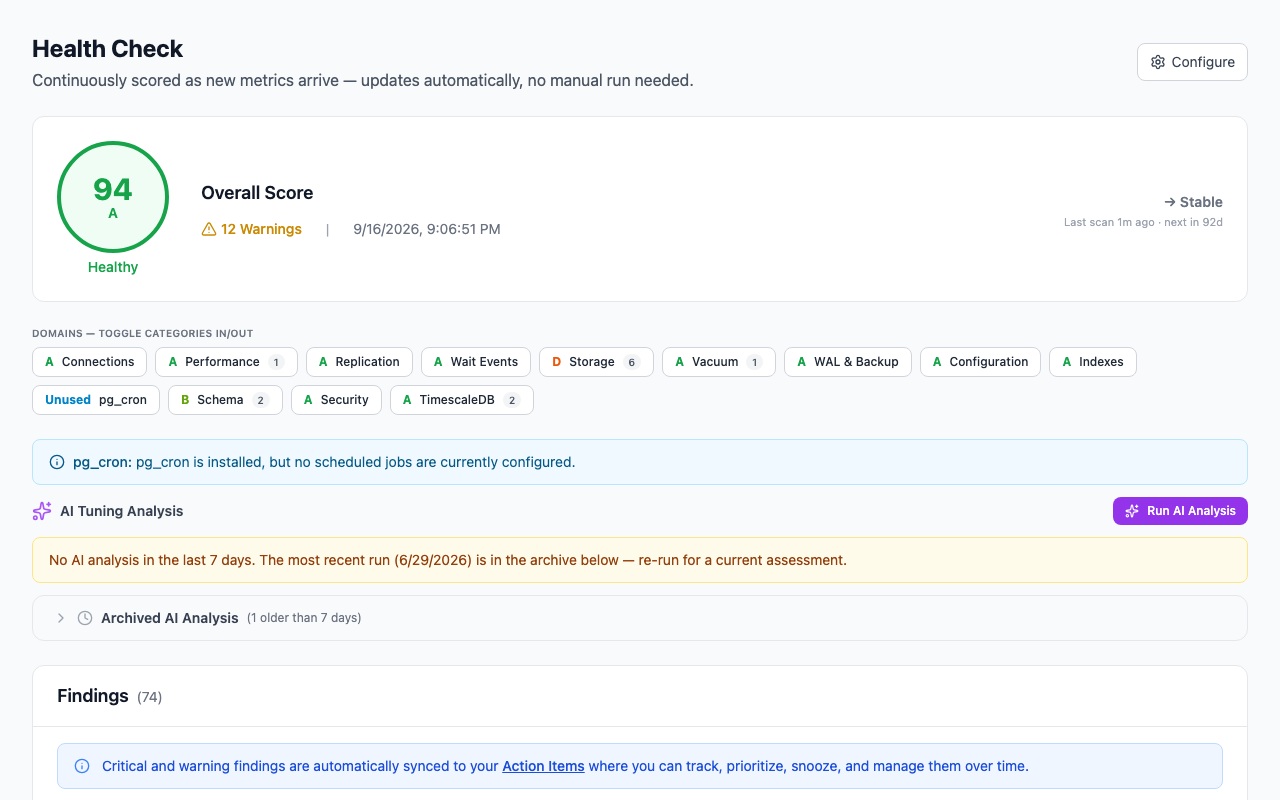
There is no "run health check" button anywhere in the product. The 135 checks are grouped into 16 domains and each domain is re-scored on its own tier: fast domains such as connections, locks and replication roughly every 120 seconds, medium domains such as performance, vacuum and WAL every 900 seconds, and slow ones such as configuration, security, schema and indexes once a day. A domain is skipped, and the skip reason recorded, when no new data has arrived since its last run or no collector is online, so a stale grade is labelled as stale rather than shown as current. The fleet figures quoted in this guide come from those scores aggregated across MyDBA's monitored instances over the last 7 days, with any check evaluated on fewer than 20 instances excluded: across 50 instances, 86.0% have no auto_explain configured, which is the single most common finding; across 31, 67.7% carry at least one duplicate index; across 26, 61.5% have a table without a primary key; across 38, 52.6% run with log_lock_waits off; and across 50, 44.0% fail the index-bloat check.
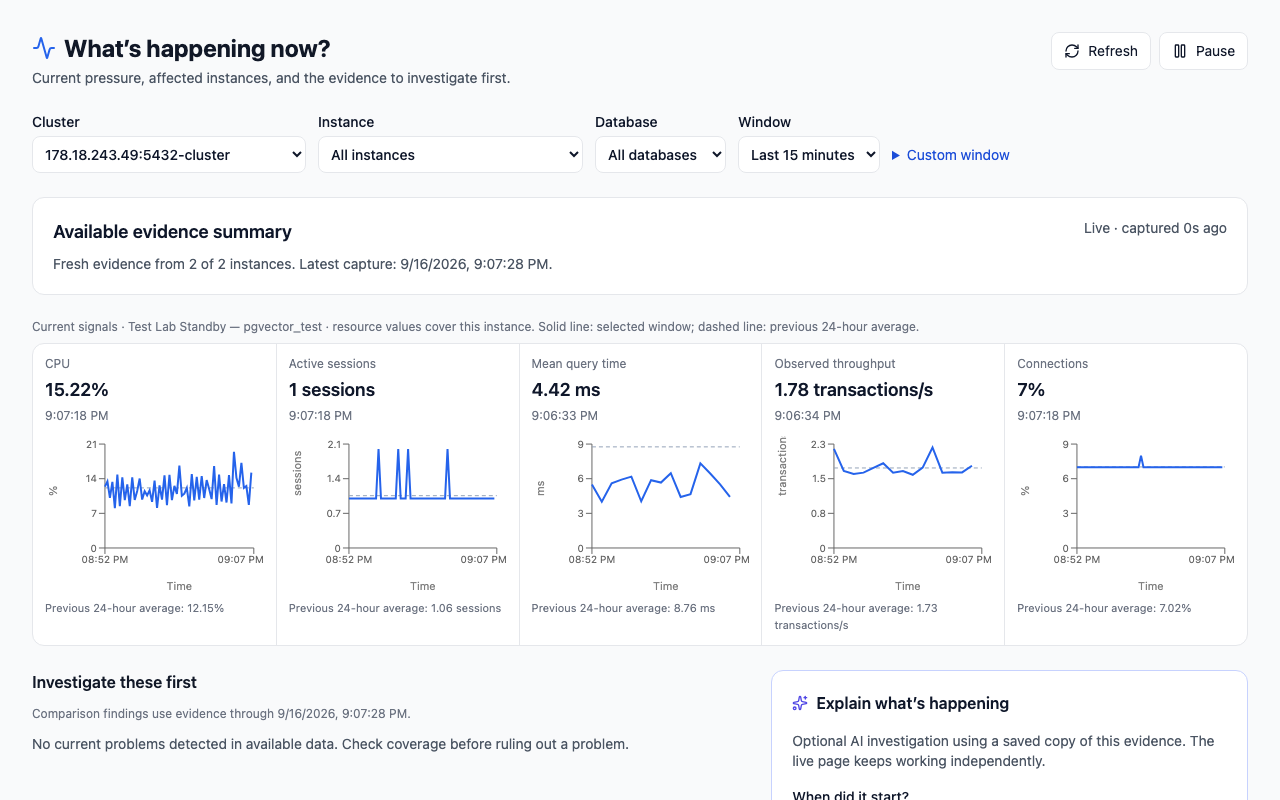
The Now page ("What's happening now?") is the incident view. It combines the current per-instance signals, a ranked list of deterministic findings for the selected cluster, instance or database, a timeline comparing the last few minutes against the previous 24-hour average, and query workload changes, so a spike reads as a spike rather than a number. Beneath it sit the pages that correspond to the themes in this guide: the Activity Monitor sampling pg_stat_activity on the collector's 15-second fast tier, the Lock Monitor resolving pg_blocking_pids() into a tree with the root blocker labelled, the Queries page ranking statements by the delta in total_exec_time rather than the lifetime counter, and the vitals strip showing connections, cache hit, XID age, replication lag and disk against their thresholds. The free PostgreSQL health check runs the same 135 checks continuously on one cluster and one database, with 30-day history and no card required.
FAQ
Is pg_stat_statements enough on its own?
For finding the statements that consume the most total time, yes, and it is the first thing to enable on any instance that does not have it. It is not enough for three things: it has no percentiles, so p95 latency has to come from sampling or log timings; it records calls = 0 for statements cancelled by statement_timeout, so the worst offenders can be invisible; and it says nothing about locks, vacuum, replication or capacity. Treat it as the query half of monitoring, not the whole.
Do I need a monitoring tool if I am on RDS or Aurora?
Performance Insights and CloudWatch cover the host and the top-SQL view well, and for a single instance on one provider that may be all you need. What the console does not do is score vacuum health, bloat, index quality, idle-in-transaction sessions or configuration against thresholds, and it stops at the provider boundary. If you have more than one provider, a self-hosted instance alongside, or you want findings explained rather than graphed, you will end up adding something. The Aurora storage model article covers which metrics change meaning on Aurora specifically.
How often should PostgreSQL metrics be collected?
It depends on the metric. Session state, locks and wait events change second to second and are only useful sampled every 10 to 15 seconds; a lock chain that lasts 40 seconds is invisible at a one-minute interval. Query statistics, vacuum counters and WAL position are fine at 60 seconds. Table sizes, index usage and bloat estimates barely move within an hour and are expensive to compute, so once an hour or once a day is enough. MyDBA's collector uses three tiers, 15, 60 and 300 seconds, for exactly this reason, and the health checks that read the data run on their own 120-second, 900-second and daily tiers.
What is the difference between monitoring and observability for a database?
Monitoring answers questions you decided to ask in advance: is replication lag above 30 seconds, is disk below 10% free. Observability is being able to answer a question you did not anticipate, from data you already kept: why was this query slow at 03:14 last Tuesday, and what else was happening. In PostgreSQL terms, monitoring is thresholds on pg_stat_* counters; observability is retained samples of pg_stat_activity, stored EXPLAIN plans, and enough history to compare any window against another. The database observability guide goes further into what that means in practice.
Can I monitor PostgreSQL for free?
Yes, at every level. The built-in views and the server log cost nothing. pgwatch, postgres_exporter, PgHero, pgBadger and PMM are all open source, with the cost paid in the time to run them. Provider consoles include a basic tier. MyDBA's free plan runs the same 135 continuous checks, the dashboard and action items on one cluster and one database with 30-day retention; the deep-dive pages are on paid plans. This guide lives at /blog/postgres-monitoring-tools and the spoke articles it links are all free to read.
Run the free PostgreSQL health check against your own instance to see which of these apply to you.
Last verified against PostgreSQL 18, 2026-09-16.