MyDBA.dev vs Datadog Database Monitoring: PostgreSQL-Native vs Full-Stack Observability
MyDBA.dev vs Datadog Database Monitoring: PostgreSQL-Native vs Full-Stack Observability
The Quick Summary
Datadog is an excellent full-stack observability platform. MyDBA.dev is a specialist PostgreSQL monitoring tool. They solve different problems, and the right choice depends entirely on what you need.
Here is how they compare across the capabilities that matter most for PostgreSQL teams:
| Capability | MyDBA.dev | Datadog DBM | |---|---|---| | PostgreSQL depth | Purpose-built, PostgreSQL only | Generic DB monitor (MySQL, SQL Server, Oracle, etc.) | | Health checks | 75+ checks with SQL fix scripts | Basic recommendations | | Health scoring | Scored across 10 domains (A-F grades) | No scoring system | | Index advisor | Cluster-aware with cost/benefit analysis | Missing index hints only | | XID wraparound monitoring | Dedicated tracking with age trends | Not covered | | pgvector monitoring | Index stats, recall, storage, 13 health checks | Not supported | | TimescaleDB monitoring | Chunks, compression, jobs, continuous aggregates | Not supported | | PostGIS monitoring | Spatial indexes, geometry quality, anti-patterns | Not supported | | EXPLAIN plan analysis | Automatic plan collection with regression detection | EXPLAIN ANALYZE via UI | | Query monitoring | Full query lifecycle with sample parameters | Query metrics + EXPLAIN | | APM integration | None (database-focused) | Deep APM correlation | | Infrastructure monitoring | None (database-focused) | Full-stack (hosts, containers, network) | | Multi-database support | PostgreSQL only | 15+ database engines | | Dashboard customization | Fixed, purpose-built views | Highly customizable | | Deployment | Lightweight Go collector (single binary) | Datadog Agent (full-stack) | | Pricing | Free: one primary or standalone, no replicas; Pro: £50/primary + £25/replica/month (GBP) | See current Datadog rates |
Where Datadog Excels
Datadog is a strong choice when PostgreSQL is one piece of a larger monitoring puzzle. Its strengths are real and worth acknowledging.
APM correlation is Datadog's standout feature for database teams. You can trace a slow API request from the application layer, through the service mesh, down to the specific PostgreSQL query causing the latency. No PostgreSQL-specific tool can do this because it requires instrumentation across the entire application stack.
Wait event analysis in Datadog DBM shows which wait events are consuming the most time across your queries. This is genuinely useful for diagnosing contention -- you can see whether queries are waiting on locks, I/O, or CPU without digging through pg_stat_activity manually.
Query metrics with EXPLAIN plans provide a solid baseline for query performance monitoring. Datadog captures normalized query statistics, tracks latency percentiles, and lets you pull EXPLAIN ANALYZE plans directly from the UI.
Dashboard flexibility is another genuine advantage. Datadog lets you build custom dashboards that combine database metrics with application metrics, infrastructure metrics, and log data. If your team lives in Datadog for everything else, having database monitoring in the same interface reduces context-switching.
Multi-database support matters for polyglot environments. If you run PostgreSQL alongside MySQL, MongoDB, and Redis, Datadog monitors all of them from a single agent and interface. MyDBA.dev monitors PostgreSQL only.
Where MyDBA.dev Goes Further
The trade-off of a generalist tool is that it cannot go as deep on any single database engine. Here is where PostgreSQL-specific monitoring makes a material difference.
Health Scoring with Fix Scripts
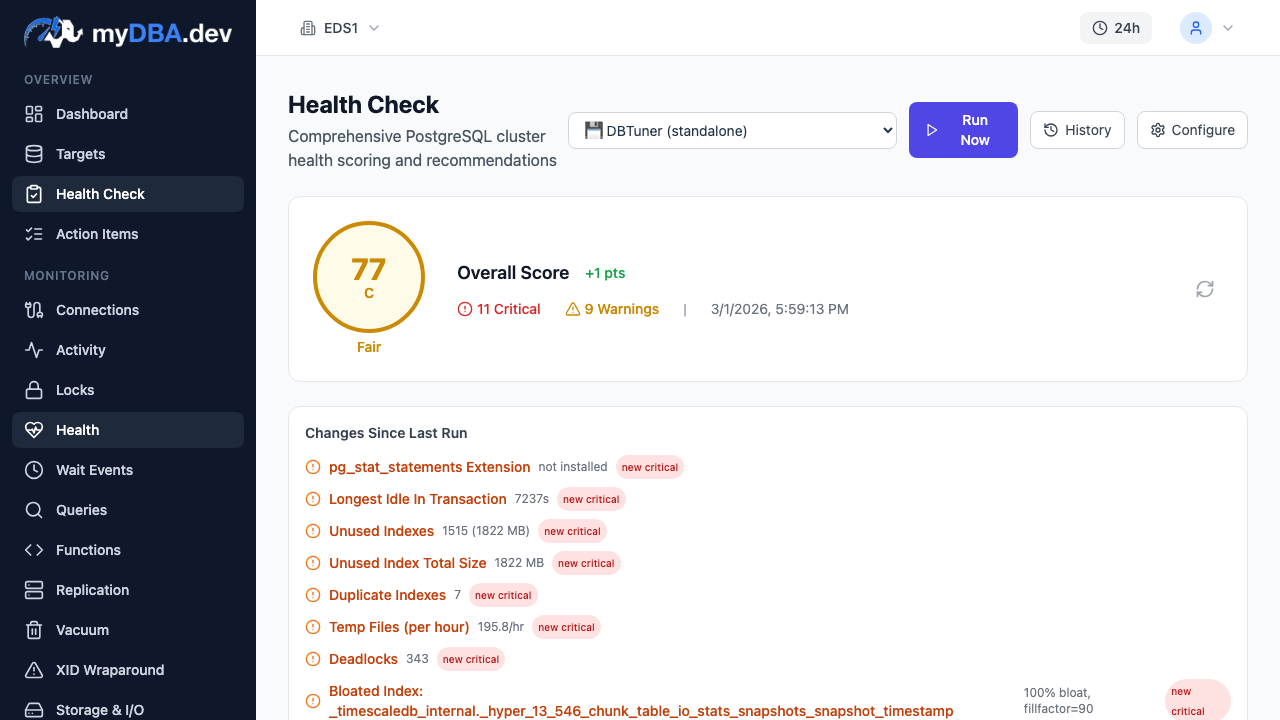
MyDBA.dev runs 75+ automated health checks across 10 domains: Connections, Indexes, Performance, Replication, Schema, Security, Storage, Vacuum, WAL & Backup, and Extensions. Each finding includes a severity level, a plain-English explanation, and a SQL fix script you can run immediately. The overall score (A through F) gives you a single metric to track over time -- after applying fixes, run the check again and see the score improve.
Datadog surfaces basic recommendations but does not provide a structured health-scoring system or ready-to-run remediation scripts. The difference is between "here is a problem" and "here is a problem, here is why it matters, and here is the exact SQL to fix it."
Extension Monitoring
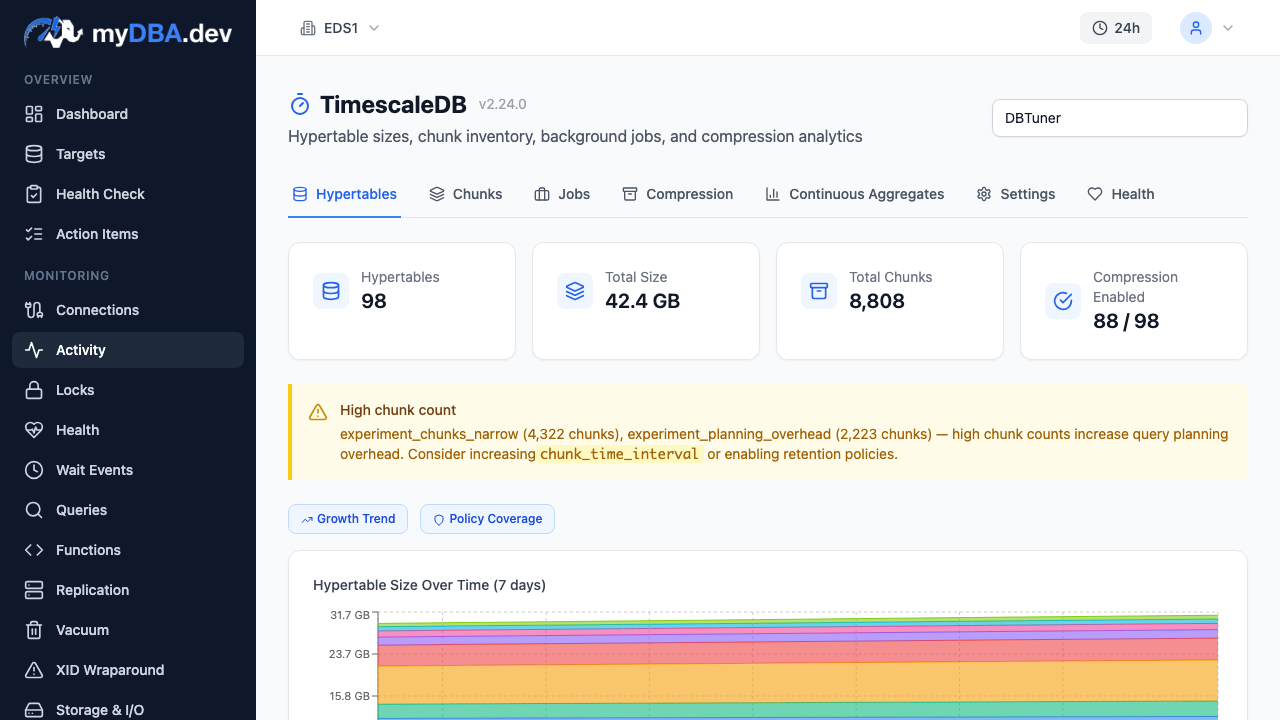
Datadog has no monitoring for TimescaleDB, pgvector, or PostGIS. If you use any of these extensions -- and a growing number of PostgreSQL deployments do -- Datadog treats them as opaque. You get no visibility into TimescaleDB chunk sizes or compression ratios, no pgvector index recall or storage metrics, no PostGIS spatial index efficiency or geometry quality checks.
MyDBA.dev monitors all three with dedicated dashboards and extension-specific health checks. For pgvector alone, there are 13 health checks covering index configuration, recall estimation, quantization settings, and storage efficiency. For TimescaleDB, the monitoring covers hypertable chunks, compression status, continuous aggregate freshness, background job health, and retention policies.
XID Wraparound Protection
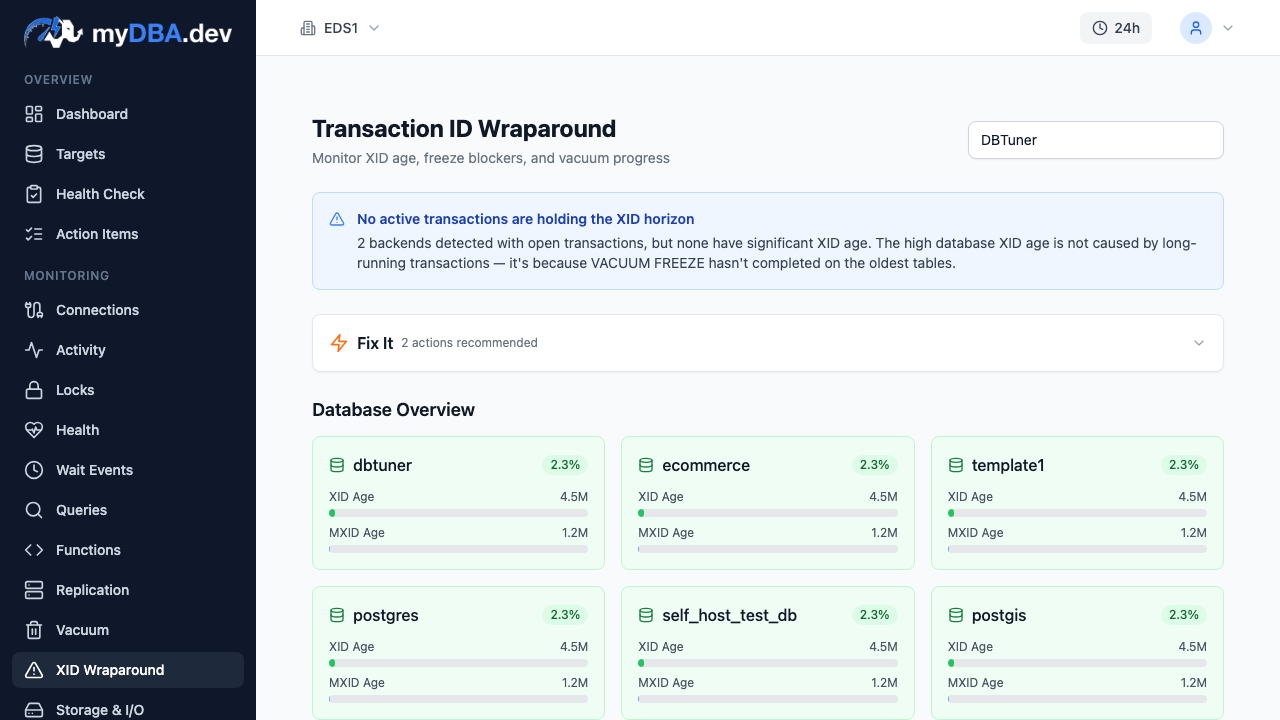
Transaction ID wraparound is PostgreSQL's most dangerous failure mode. When a database approaches the 2-billion XID limit without adequate vacuuming, PostgreSQL forces a full-database freeze that blocks all writes. It is a production emergency that can take hours to resolve.
MyDBA.dev tracks XID age trends over time, alerts on rising age, and shows exactly which tables are contributing to the problem. Datadog does not monitor XID wraparound at all. For a PostgreSQL-specific failure mode that can take down production, this is a significant gap.
Index Advisor
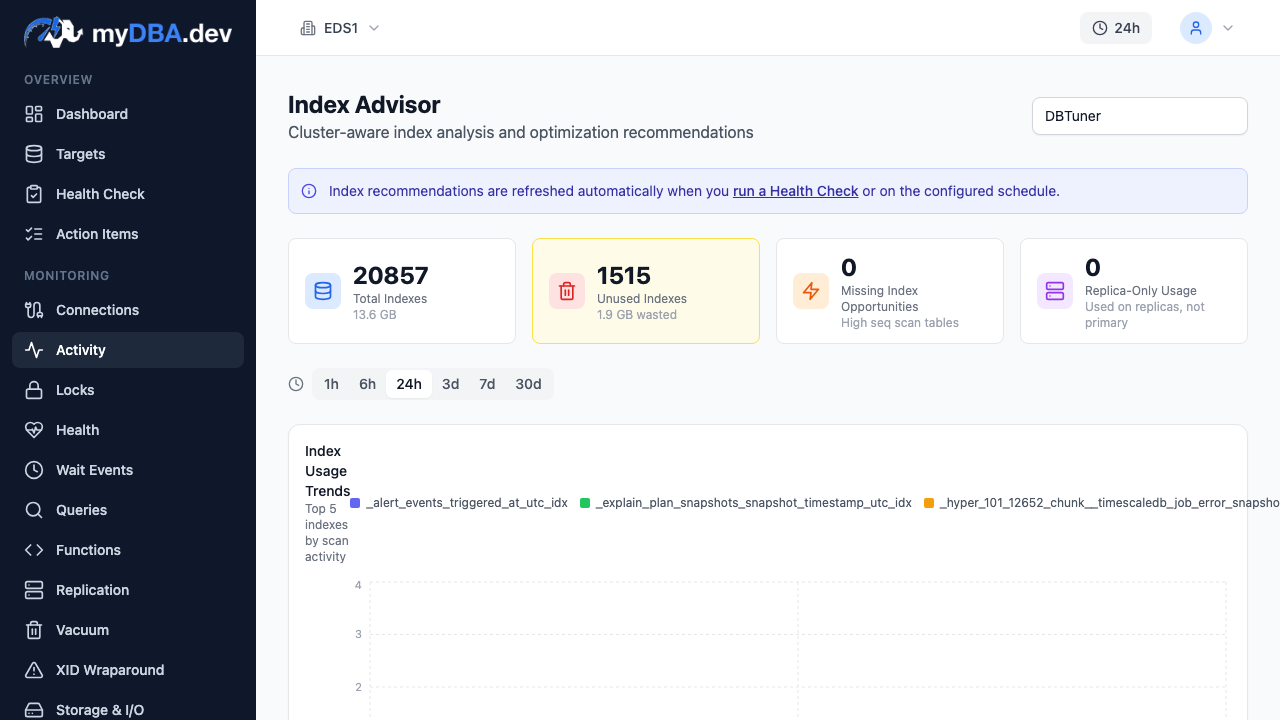
MyDBA.dev's index advisor analyzes query workloads and recommends specific indexes with estimated cost savings, impact on write performance, and ready-to-run CREATE INDEX statements. It is cluster-aware -- recommendations account for replication topology and existing index overlap.
Datadog provides basic missing index detection (tables with high sequential scan counts) but does not perform workload-based index analysis or provide cost/benefit estimates.
Query Monitoring Depth
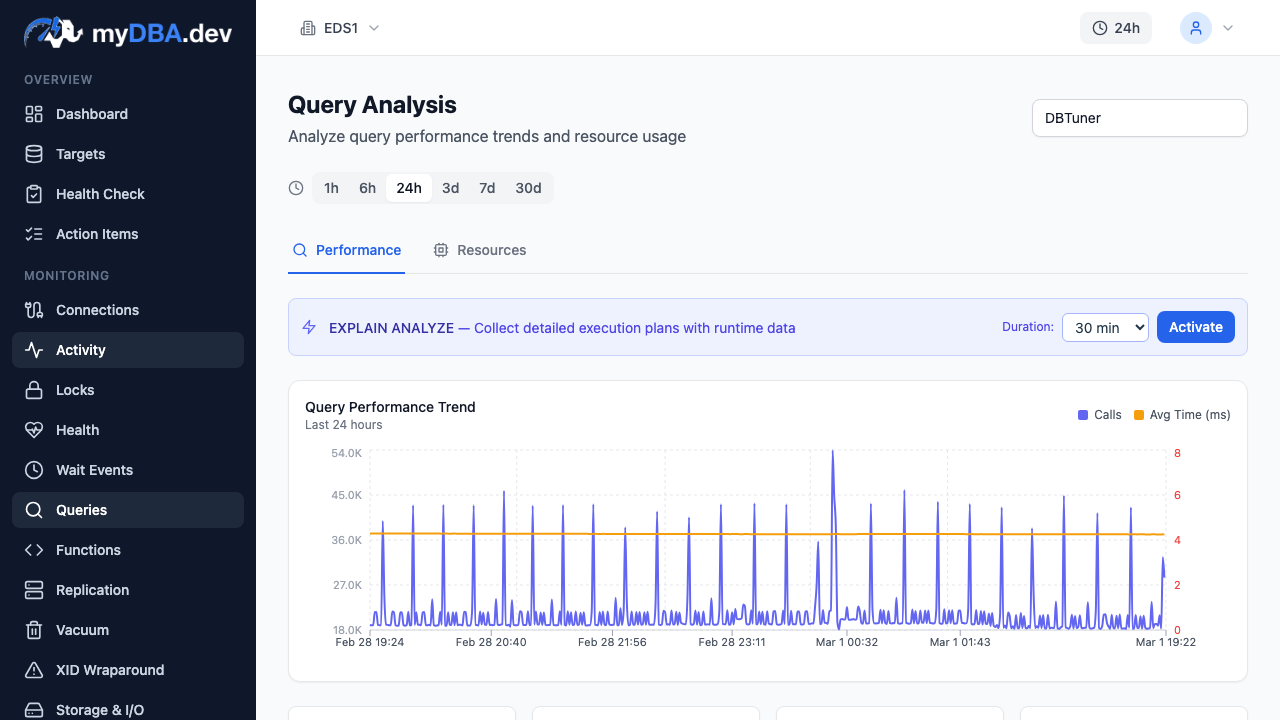
Both tools monitor query performance. MyDBA.dev adds automatic EXPLAIN plan collection with plan regression detection (alerting when a query's execution plan changes for the worse), query sample parameters for reproducing exact query executions, and statement-type filtering. Datadog's query monitoring is competent but focuses on metrics rather than plan-level intelligence.
Pricing Comparison
Compare prices for the same topology and monitoring requirements.
See Datadog pricing for current Database Monitoring rates, billing commitments and any infrastructure charges (checked 14 September 2026).
| Primary or standalone instances (no replicas) | MyDBA.dev Pro monthly | 12 months at that monthly rate | |---|---|---| | 1 | £50 | £600 | | 5 | £250 | £3,000 | | 10 | £500 | £6,000 | | 25 | £1,250 | £15,000 |
Pro costs £50 per primary and £25 per replica per month (GBP), with every monitored instance billed, including the first. All databases, team members, non-AI diagnostics and 30-day history are included. The table annualizes monthly charges for comparison; it does not offer an annual plan. One primary plus two replicas costs £100/month.
Free covers one primary or standalone PostgreSQL instance, no replicas, all databases on that instance, all team members, all non-AI diagnostics and 30-day history. Collection frequency reduces after 7 days. On either plan, use an OpenRouter, OpenAI or Anthropic key with no product monthly AI quota; provider API usage is billed by the provider. New Pro subscriptions also include 20 platform-funded AI operations per organization per UTC calendar month.
When to Choose Datadog
- You need full-stack observability across applications, infrastructure, and databases
- You run multiple database engines (MySQL, MongoDB, Redis) alongside PostgreSQL
- APM trace-to-query correlation is critical for your debugging workflow
- Your team already has a significant Datadog investment and switching costs are high
- Dashboard customization and alerting flexibility are priorities
When to Choose MyDBA.dev
- PostgreSQL is your primary or only database
- You need deep PostgreSQL-specific intelligence: health scoring, fix scripts, index advisory
- You use PostgreSQL extensions (TimescaleDB, pgvector, PostGIS) that need monitoring
- XID wraparound protection is important for your production databases
- Cost matters -- especially if you monitor multiple servers
- You want a lightweight collector that does one thing well, without a full-stack agent
The Bottom Line
Datadog is the better choice when PostgreSQL monitoring is a subset of a broader observability strategy. It excels at connecting database performance to application behavior across a complex, multi-service architecture.
MyDBA.dev is the better choice when PostgreSQL performance is the primary concern. It goes deeper on the problems that actually cause PostgreSQL outages -- XID wraparound, missing indexes, vacuum failures, extension misconfiguration -- and provides actionable fix scripts rather than generic recommendations. Compare current quotes for the same topology, features and billing terms.
The two tools are not mutually exclusive. Some teams run Datadog for full-stack observability and MyDBA.dev for PostgreSQL-specific depth. If you have to pick one, the deciding factor is whether you need breadth (Datadog) or depth (MyDBA.dev).