Database Observability: What Your PostgreSQL Monitoring Is Missing
Database Observability: The Complete Guide for Production Teams
Your application has observability. Your database probably does not.
Most engineering teams have invested heavily in application-level observability. They have Datadog or Grafana tracking request latency. They have distributed tracing connecting frontend clicks to backend services. They have structured logging piped into Elasticsearch or Loki. But ask them what their database monitoring looks like and the answer is almost always the same: a CPU graph, maybe a connection count, and a vague sense that "the DBA handles it."
That gap is where the hardest production incidents live. The ones where application dashboards show a latency spike but nobody can explain why. The ones that end with someone running EXPLAIN ANALYZE by hand at 2 AM.
This guide covers what database observability actually means, why application monitoring is not a substitute, and what a production-ready implementation looks like.
What Database Observability Actually Means
The observability community settled on three pillars years ago: metrics, logs, and traces. Most teams apply all three rigorously to their applications. Almost nobody applies all three to their databases.
Here is what each pillar looks like when properly applied to a PostgreSQL database:
Pillar 1: Metrics
This is the pillar most teams have -- partially. They track CPU, memory, connections, maybe disk I/O. That is infrastructure monitoring, not database observability. True database metrics include:
- Active connections and connection pool utilization -- are you exhausting your connection limit?
- Cache hit ratio -- what percentage of reads are served from shared buffers versus disk?
- Replication lag -- how far behind are your replicas, and is the gap growing?
- Transaction rate and rollback rate -- are transactions failing at an unusual rate?
- Dead tuple accumulation -- is autovacuum keeping up, or are tables bloating?
- WAL generation rate -- how much write-ahead log is being generated, and is it sustainable?
A CPU graph tells you the database server is busy. These metrics tell you what it is busy doing.
Pillar 2: Logs
PostgreSQL logs are extraordinarily rich, but most teams never configure them properly. The defaults log almost nothing useful. Properly configured database logging includes:
- Slow query log (
log_min_duration_statement) -- every query exceeding a threshold, with its duration and parameters - Error log -- connection failures, constraint violations, out-of-memory events
- Autovacuum completion log -- every vacuum and analyze operation with rows processed, pages scanned, and duration
- Checkpoint log (
log_checkpoints) -- checkpoint frequency, duration, and buffer write statistics - Lock wait log (
log_lock_waits) -- queries that waited longer thandeadlock_timeoutfor a lock
Most teams have none of these enabled. The slow query log alone, properly analyzed, would have prevented half of the performance incidents that made it to production.
Pillar 3: Traces
In application observability, traces follow a request across services. In database observability, the equivalent is understanding the internal execution path of a query:
- EXPLAIN plans -- how the query planner chose to execute a query (sequential scan, index scan, nested loop, hash join)
- Wait events -- what a query is waiting on when it is not actively computing (I/O, locks, network, internal contention)
- Lock chains -- which sessions are blocking which other sessions, and what resources they are contending over
- Plan history -- how the execution plan for a given query has changed over time
This is the pillar that almost nobody has. And it is the one that answers the question every application observability tool leaves unanswered: why is this query slow?
Why Application Observability Is Not Enough
Your APM tool can tell you that a specific API endpoint went from 50ms to 800ms. It can show you that the database query inside that endpoint is the bottleneck. It might even show you the SQL text.
But it cannot tell you why the query slowed down. Consider the possible causes:
- Missing index -- a sequential scan on a table that grew past the tipping point
- Stale statistics -- autovacuum ANALYZE has not run recently, so the planner has incorrect row count estimates
- Lock contention -- the query is fast when it runs, but it spends 700ms waiting for a row-level lock held by another session
- Plan regression -- the query planner switched from an index scan to a hash join because a statistics update changed its cost estimate
- Table bloat -- dead tuples have inflated the table to 3x its logical size, and every scan reads pages full of invisible garbage rows
- Replication lag -- reads going to a replica that is 30 seconds behind, returning stale data that triggers retry logic
Every one of these is a database-level problem. Every one requires database-level observability to diagnose. Your APM tool sees the symptom (slow query). Database observability reveals the cause.
Without database observability, teams fall back on guessing. "Maybe we need more CPU." "Maybe we should add a cache." These guesses are expensive, often wrong, and occasionally make the problem worse.
The 10 Things Your Database Should Be Telling You
Think of this as a checklist. If your current monitoring cannot answer these questions, you have gaps in your database observability.
1. Query performance trends over time. Not just current latency -- how has this query's mean execution time changed over the past week? The past month? A slow drift upward is invisible in real-time dashboards but obvious in trend data.
2. EXPLAIN plan changes. When a query's execution plan changes, you need to know immediately. A plan regression -- where the planner switches from an efficient index scan to an expensive sequential scan -- is one of the most common causes of sudden performance degradation. It happens silently, and it persists until someone investigates.
3. Index health. This has three dimensions: missing indexes (tables with high sequential scan ratios), unused indexes (consuming write overhead and storage for zero read benefit), and bloated indexes (fragmentation that degrades lookup performance).
4. Vacuum and autovacuum status. Which tables have the most dead tuples? When did autovacuum last run on each table? Are autovacuum workers saturated? Is any table approaching emergency anti-wraparound vacuum territory?
5. Replication lag and topology. If you have replicas, you need to know the lag in bytes and seconds, whether it is stable or growing, and which replica is furthest behind. You also need to see your replication topology -- which nodes are connected to which, and where the bottlenecks are.
6. Lock contention and deadlocks. Which sessions are blocking other sessions right now? What lock types are involved? How deep is the lock chain? Are deadlocks occurring, and on which tables?
7. Connection pool utilization. How many connections are active versus idle? Are you approaching your max_connections limit? Are connections being leaked (opened but never returned to the pool)?
8. Storage growth and table bloat. Which tables are growing fastest? What is the ratio of live data to dead data? Are any tables candidates for VACUUM FULL or pg_repack?
9. Transaction ID (XID) age. PostgreSQL uses 32-bit transaction IDs that wrap around after roughly 2 billion transactions. If a database approaches this limit without adequate vacuuming, PostgreSQL will shut down to prevent data corruption. This is a catastrophic failure mode that is entirely preventable with proper monitoring.
10. Extension-specific health. If you use TimescaleDB, you need to monitor chunk sizes, compression ratios, and continuous aggregate freshness. If you use pgvector, you need to track index recall accuracy and build progress. If you use PostGIS, you need spatial index health and geometry validity metrics. Generic monitoring tools know nothing about these extensions.
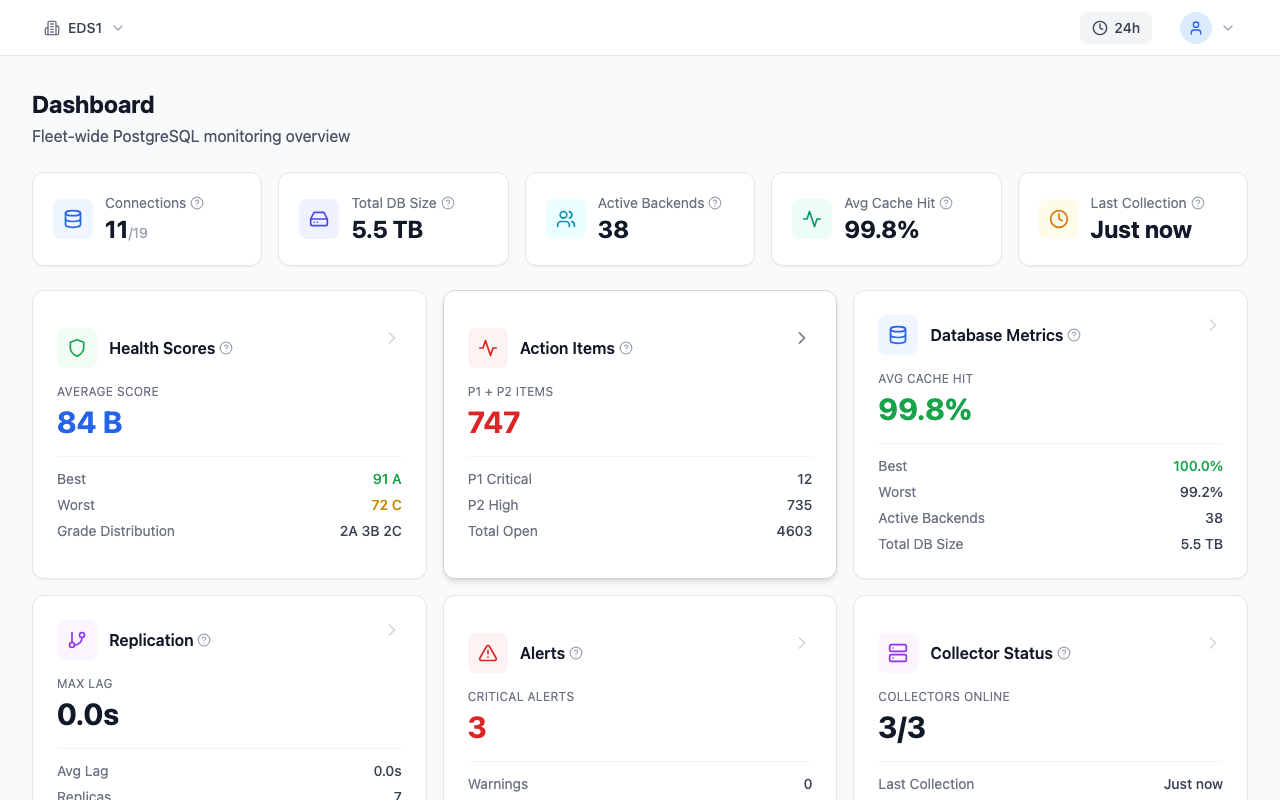
Tools like myDBA.dev implement all 10 of these observability dimensions for PostgreSQL, with 75+ automated health checks, automatic EXPLAIN plan capture, and plan regression alerts.
The Building Blocks: What PostgreSQL Gives You for Free
PostgreSQL ships with powerful introspection capabilities. The problem is that they require configuration, continuous collection, and analysis to be useful. Here are the five most important building blocks and how to use them.
pg_stat_statements
The foundation of query performance monitoring. This extension tracks execution statistics for every distinct query:
-- Enable the extension (requires a restart for shared_preload_libraries)
-- postgresql.conf: shared_preload_libraries = 'pg_stat_statements'
CREATE EXTENSION IF NOT EXISTS pg_stat_statements;

-- Top 10 queries by total execution time
SELECT
    substring(query, 1, 100) AS query_text,
    calls,
    round(total_exec_time::numeric, 1) AS total_time_ms,
    round(mean_exec_time::numeric, 1) AS avg_time_ms,
    round(stddev_exec_time::numeric, 1) AS stddev_ms,
    rows
FROM pg_stat_statements
ORDER BY total_exec_time DESC
LIMIT 10;
The stddev_exec_time column is underused but critical. A query with a 5ms average but a 200ms standard deviation has a consistency problem -- it runs fast most of the time but occasionally takes 40x longer. That variance is invisible without this column.
pg_stat_activity
Real-time view of every active session:
-- Current sessions with wait events
SELECT
    pid,
    state,
    wait_event_type,
    wait_event,
    now() - query_start AS query_duration,
    substring(query, 1, 80) AS current_query
FROM pg_stat_activity
WHERE backend_type = 'client backend'
    AND state != 'idle'
ORDER BY query_start;
The wait_event_type and wait_event columns tell you what a session is actually doing when it is not computing. A query showing Lock / relation is waiting for a table lock. A query showing IO / DataFileRead is waiting for disk. This is the database equivalent of a flame graph.
pg_stat_user_tables
Per-table statistics that reveal vacuum health and scan patterns:
-- Tables with vacuum problems
SELECT
    schemaname,
    relname AS table_name,
    n_dead_tup AS dead_tuples,
    n_live_tup AS live_tuples,
    CASE WHEN n_live_tup > 0
        THEN round(100.0 * n_dead_tup / n_live_tup, 1)
        ELSE 0
    END AS dead_tuple_percentage,
    last_autovacuum,
    last_autoanalyze
FROM pg_stat_user_tables
WHERE n_dead_tup > 1000
ORDER BY n_dead_tup DESC
LIMIT 15;
A table with a dead_tuple_percentage above 10% and a last_autovacuum timestamp from hours ago is accumulating bloat. The autovacuum settings for that table are not aggressive enough for its update rate.
auto_explain
Automatically logs execution plans for slow queries. Add it to shared_preload_libraries, set the minimum duration, and every query exceeding that threshold gets its full EXPLAIN plan written to the PostgreSQL log:
ALTER SYSTEM SET auto_explain.log_min_duration = '100ms';
ALTER SYSTEM SET auto_explain.log_analyze = on;
ALTER SYSTEM SET auto_explain.log_buffers = on;
ALTER SYSTEM SET auto_explain.log_format = 'json';
SELECT pg_reload_conf();
This is the single most valuable configuration change for database observability. When a query suddenly slows down, you already have the execution plan -- no need to reproduce the problem.
log_min_duration_statement
The slow query log. Set it to 500ms initially and tighten as you resolve the obvious problems:
ALTER SYSTEM SET log_min_duration_statement = '200ms';
SELECT pg_reload_conf();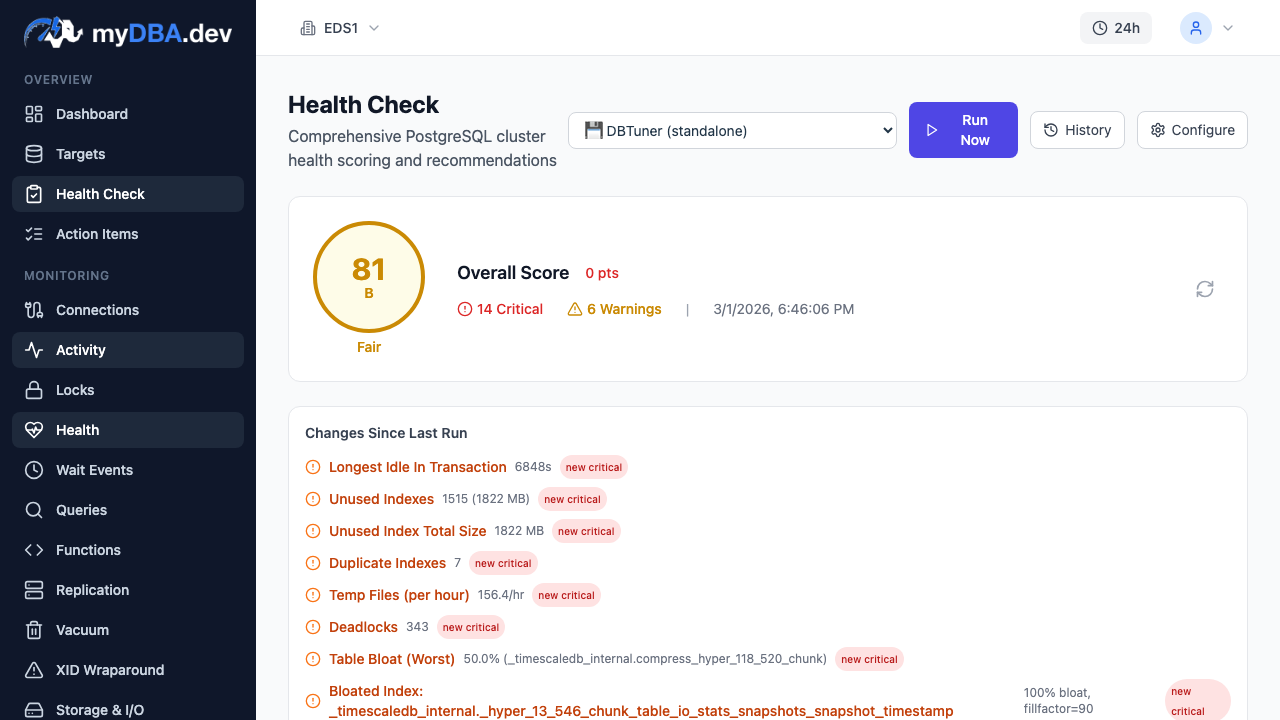
DIY vs. Dedicated Tools
There is a legitimate question about whether to build database observability in-house or use a dedicated tool. Here is an honest assessment.
The DIY Approach (Prometheus + Grafana)
Most DIY implementations follow a pattern: install postgres_exporter, scrape metrics into Prometheus, build Grafana dashboards.
What you get:
- Time-series metrics for connections, cache ratio, replication lag, transaction rates
- Custom dashboards tailored to your specific concerns
- Integration with existing alerting (PagerDuty, Opsgenie)
- Full control over data retention and storage
What you do not get:
- Automated EXPLAIN plan capture and analysis
- Plan regression detection
- Index usage analysis and recommendations
- Vacuum health assessment with fix suggestions
- Wait event analysis
- Lock chain visualization
- Health scoring across multiple domains
The metrics layer is straightforward to build. The analysis layer -- the part that turns data into actionable recommendations -- is where DIY becomes expensive. Writing SQL to collect dead tuple counts is easy. Building a system that correlates dead tuple growth with vacuum frequency, identifies the root cause as a misconfigured autovacuum_vacuum_scale_factor, and recommends the specific ALTER TABLE fix requires deep PostgreSQL expertise codified into automation.
Generic APM Tools (Datadog, New Relic)
APM tools add database monitoring as one integration among dozens.
What you get:
- Database metrics alongside application metrics
- Correlation between application latency and database performance
- Query-level performance tracking
- Unified alerting and dashboards
What you do not get:
- Deep query plan analysis
- Index advisor
- Vacuum and bloat analysis
- Extension-specific monitoring
- Health scoring
- Remediation guidance
These tools excel at telling you that the database is contributing to a problem. They are weak at telling you what specific database issue is causing it and how to fix it.
Specialized Database Monitoring (myDBA.dev, pganalyze)
Purpose-built tools for PostgreSQL. They provide everything above plus automated EXPLAIN plan capture, plan regression detection, index recommendations, health checks with specific fix guidance, and extension-aware monitoring. The trade-off is another tool in the stack and, for SaaS options, data leaving your infrastructure.
Comparison Table
| Capability | DIY (Prometheus/Grafana) | Generic APM (Datadog) | Specialized (myDBA.dev) | |---|---|---|---| | Basic metrics | Yes | Yes | Yes | | Custom dashboards | Yes | Yes | Yes | | EXPLAIN plan capture | No | No | Yes | | Plan regression detection | No | No | Yes | | Index advisor | No | No | Yes | | Vacuum health analysis | Manual SQL | No | Automated | | Lock chain visualization | No | No | Yes | | Wait event analysis | No | Partial | Yes | | Health scoring | No | No | Yes | | Extension monitoring | No | No | Yes | | Fix recommendations | No | No | Yes | | Setup time | Days-weeks | Hours | Minutes | | Ongoing maintenance | You | Managed | Managed |
What Good Database Observability Looks Like in Practice
Theory is useful. A concrete scenario is better. Here is a real-world example that demonstrates why each layer of database observability matters.
The scenario: A query that retrieves order details for a customer dashboard has run consistently at 5ms for six months. One Tuesday morning, the p95 latency for the dashboard endpoint jumps to 200ms. Application monitoring confirms the database query is the bottleneck.
Without database observability: The team opens a database connection and runs EXPLAIN ANALYZE manually. They see a sequential scan where there used to be an index scan. They check -- the index still exists. They run ANALYZE on the table and the problem goes away. They close the incident and move on, never understanding the root cause. Three weeks later, it happens again.
With database observability: The team gets an automated alert: "Plan regression detected for query SELECT ... FROM orders WHERE customer_id = $1 AND .... Execution plan changed from Index Scan to Seq Scan. Previous avg: 4.8ms. Current avg: 195ms."
They open the query monitoring dashboard and see the plan change timestamped to 3:47 AM -- exactly when autovacuum last ran ANALYZE on the orders table. The ANALYZE updated the planner statistics, and the new row count estimates caused the planner to believe a sequential scan would be cheaper than the index scan.
The fix is targeted: adjust the statistics target for the relevant columns so that ANALYZE collects more granular data, preventing the planner from making incorrect cost estimates:
ALTER TABLE orders ALTER COLUMN customer_id SET STATISTICS 1000;
ANALYZE orders;
The root cause is documented. The fix is permanent. And the next time a plan regression happens on any query, the alert fires before users notice.
That is the difference between monitoring and observability. Monitoring tells you something is wrong. Observability tells you what is wrong, why it happened, and how to prevent it from happening again.
Getting Started: Minimum Viable Database Observability
You do not need to implement everything at once. Here is the highest-value sequence.
Step 1: Enable pg_stat_statements. This is non-negotiable. Add pg_stat_statements to shared_preload_libraries, restart, and run CREATE EXTENSION IF NOT EXISTS pg_stat_statements. Without it, no tool can give you meaningful query performance data.
Step 2: Configure slow query logging. Set log_min_duration_statement to 500ms, enable log_checkpoints and log_lock_waits, then SELECT pg_reload_conf(). Once you resolve the queries above 500ms, lower the threshold to 200ms.
Step 3: Add a monitoring tool. Point-in-time queries are useful for debugging but useless for trend analysis. You need continuous collection. A specialized tool like myDBA.dev can be collecting metrics within minutes. For DIY, start with postgres_exporter and Prometheus -- but accept that you will only have the metrics layer initially.
Step 4: Enable auto_explain. Add it to shared_preload_libraries, set auto_explain.log_min_duration to 200ms, and keep log_analyze off initially (it adds execution overhead). The plan structure alone is enormously valuable for detecting regressions.
Step 5: Set up alerting on five critical thresholds. Replication lag exceeding 30 seconds. Connection count exceeding 80% of max_connections. Cache hit ratio below 95%. Dead tuple ratio exceeding 20% on any table. Transaction ID age exceeding 500 million. These five alerts alone will catch the majority of database-level incidents before they become user-facing.
The Gap Is the Opportunity
Database observability is not a new idea. But it is a new practice for most teams. The tooling has matured, the cost has dropped, and the complexity of modern database workloads -- with extensions like TimescaleDB, pgvector, and PostGIS -- has made the old approach of "run a few SQL queries when something breaks" untenable.
The teams that invest in database observability spend less time debugging. They catch plan regressions before users report latency spikes. They fix vacuum configurations before tables bloat. They right-size indexes instead of guessing. And they sleep better at night because their alerting covers the database, not just the application sitting on top of it.
Start with pg_stat_statements and a slow query log. Build from there. The gap between what your application tells you and what your database could tell you is almost certainly larger than you think.