PostgreSQL Connection Pooling: PgBouncer, Supavisor & Built-In
PostgreSQL Connection Pooling: PgBouncer, Supavisor & Built-In
PostgreSQL connection pooling multiplexes many application connections onto a smaller pool of database connections, reducing memory overhead, context switching, and connection startup latency. PgBouncer is the most widely deployed pooler, but Supavisor, pgcat, and application-level pools offer alternatives for different workloads.
The Problem
Every PostgreSQL connection consumes resources. Each backend process allocates roughly 5-10 MB of memory for work_mem, temp_buffers, and shared catalog caches. A server with max_connections = 200 might use 2 GB of RAM just for connection overhead before a single query runs. At 500 connections, you are looking at 5 GB of memory consumed by connection infrastructure alone.
The problem compounds in modern architectures. A containerized application with 20 replicas, each maintaining a connection pool of 10, creates 200 persistent connections. During a deployment rolling restart, the old and new replicas briefly coexist, doubling the connection count. A serverless function architecture is worse -- each invocation might open its own connection, creating hundreds of short-lived connections per second. PostgreSQL was not designed for this pattern. Each new connection requires forking a new OS process, authenticating, loading shared catalog data, and negotiating TLS -- a process that takes 50-100ms or more with TLS enabled.
Without connection pooling, teams hit two walls. The first is max_connections exhaustion: the application gets "too many connections" errors and requests start failing. The common reaction is to increase max_connections, which hits the second wall: memory exhaustion. At 1,000 connections, PostgreSQL consumes so much RAM for connection overhead that there is little left for shared_buffers, work_mem, and the OS page cache. Query performance degrades as memory pressure forces data out of cache.
Connection pooling solves this by maintaining a fixed pool of database connections and sharing them among application connections. The application opens a connection to the pooler, the pooler assigns a database connection from the pool for the duration of a transaction (or statement), then returns it to the pool for reuse. A pool of 20 database connections can serve hundreds of application connections, because most application connections are idle at any given moment.
How to Detect It
Check your current connection usage and whether you are approaching limits:
-- Current connection count by state and application
SELECT
    state,
    usename AS username,
    application_name,
    count(*) AS connection_count,
    count(*) FILTER (WHERE state = 'idle') AS idle_connections,
    count(*) FILTER (WHERE state = 'idle in transaction') AS idle_in_transaction
FROM pg_stat_activity
WHERE backend_type = 'client backend'
GROUP BY state, usename, application_name
ORDER BY connection_count DESC;

-- Connection utilization as a percentage of max_connections
SELECT
    count(*) AS active_connections,
    current_setting('max_connections')::int AS max_connections,
    round(100.0 * count(*) / current_setting('max_connections')::int, 1)
        AS utilization_percentage
FROM pg_stat_activity
WHERE backend_type = 'client backend';
A utilization_percentage consistently above 70% means you are at risk of exhaustion during traffic spikes or deployments. A high idle_connections count relative to total connections indicates that connections are being held open unnecessarily -- a pooler would reclaim these.
Check whether connection churn is an issue:
-- Connection establishment rate (requires pg_stat_database)
SELECT
    datname AS database_name,
    numbackends AS current_connections,
    xact_commit + xact_rollback AS total_transactions,
    CASE WHEN numbackends > 0
        THEN round((xact_commit + xact_rollback)::numeric / numbackends, 0)
        ELSE 0
    END AS transactions_per_connection
FROM pg_stat_database
WHERE datname NOT LIKE 'template%'
ORDER BY numbackends DESC;
A low transactions_per_connection ratio suggests connections are being opened and closed frequently rather than being reused -- exactly the pattern that connection pooling fixes.
Check for idle-in-transaction connections wasting pool capacity:
-- Find long-lived idle-in-transaction connections
SELECT
    pid,
    usename,
    application_name,
    state,
    now() - state_change AS idle_duration,
    now() - xact_start AS transaction_duration,
    left(query, 100) AS last_query
FROM pg_stat_activity
WHERE state = 'idle in transaction'
  AND now() - state_change > interval '5 minutes'
ORDER BY state_change;
These connections hold database-side resources (locks, snapshots) while doing nothing. In a pooled environment, they also hold a pool slot hostage, preventing other application connections from using it.
How myDBA.dev Shows It
myDBA.dev's Connections Monitor tracks connection usage in real time, showing the current count by state (active, idle, idle in transaction), the trend over time, and how close you are to max_connections. The historical view is particularly useful for connection pooling decisions -- it reveals patterns like connection spikes during deployments, gradual connection leaks over days, and the ratio of idle to active connections.
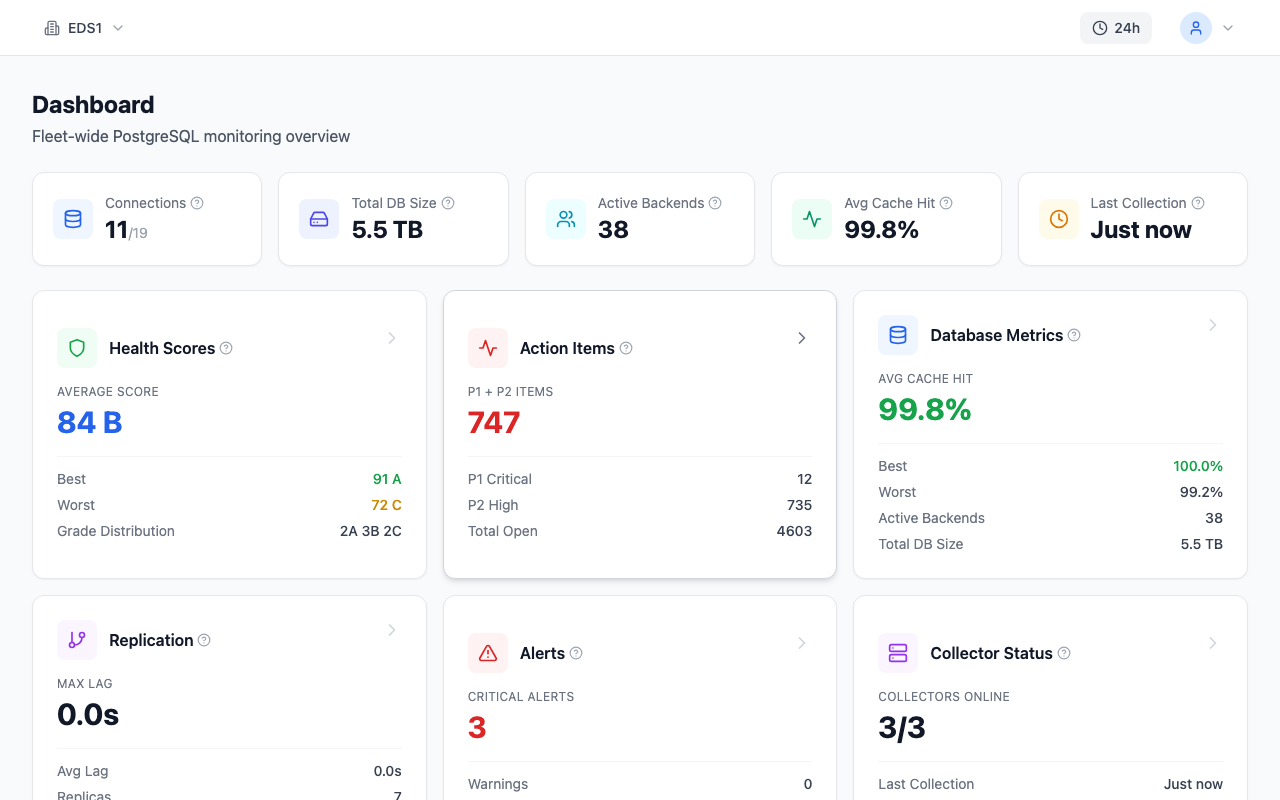
The dashboard provides a high-level overview with connection utilization as one of the key metrics. A glance at the connections gauge tells you whether you are operating with comfortable headroom or dangerously close to the limit. The trend line reveals whether connection usage is stable, growing, or exhibiting periodic spikes.
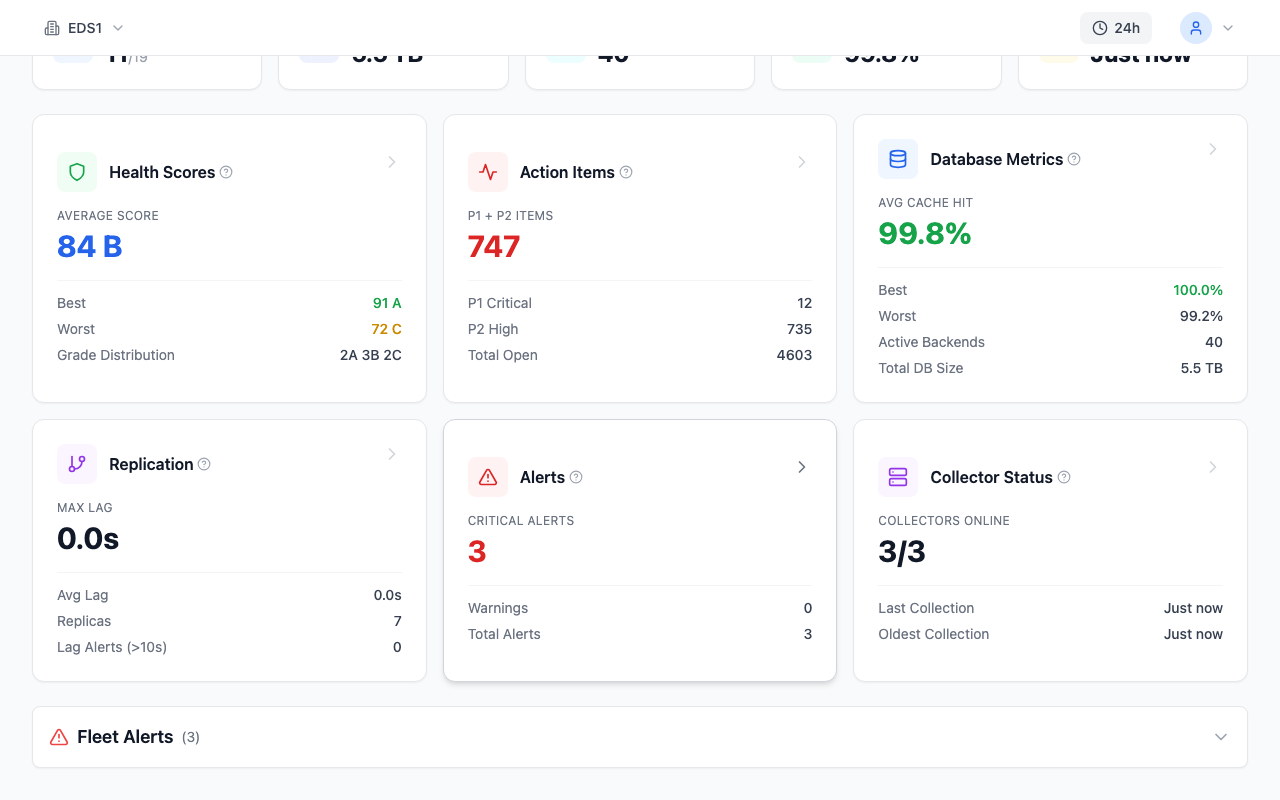
myDBA.dev also alerts on connection utilization thresholds, notifying you before you hit max_connections rather than after. This early warning gives you time to investigate and fix the root cause -- whether that means configuring a pooler, reducing pool sizes in the application, or terminating leaked connections.
How to Fix It
PgBouncer setup (most common)
PgBouncer is the most widely deployed PostgreSQL connection pooler. It is lightweight (single process, low memory), supports transaction-mode pooling, and handles thousands of client connections with minimal overhead:
; /etc/pgbouncer/pgbouncer.ini

[databases]
myapp = host=127.0.0.1 port=5432 dbname=myapp

[pgbouncer]
listen_addr = 0.0.0.0
listen_port = 6432
auth_type = scram-sha-256
auth_file = /etc/pgbouncer/userlist.txt

; Transaction mode: connection returned to pool after each transaction
pool_mode = transaction

; Pool sizing
default_pool_size = 20        ; connections per user/database pair
min_pool_size = 5             ; keep at least this many connections warm
reserve_pool_size = 5         ; extra connections for burst traffic
reserve_pool_timeout = 3      ; seconds before using reserve pool

; Connection limits
max_client_conn = 1000        ; max application connections to PgBouncer
max_db_connections = 50       ; max total connections to PostgreSQL

; Timeouts
server_idle_timeout = 600     ; close idle server connections after 10 min
client_idle_timeout = 0       ; disable client idle timeout (application manages this)
query_timeout = 300           ; kill queries running longer than 5 min
The critical setting is pool_mode. In transaction mode, a database connection is assigned when a transaction begins and returned when it commits or rolls back. This provides the best connection reuse but means you cannot use session-level features like prepared statements, SET commands, LISTEN/NOTIFY, or temporary tables across transactions.
# Connect to PgBouncer admin console
psql -p 6432 -U pgbouncer pgbouncer

# Check pool status
SHOW POOLS;
SHOW STATS;
SHOW SERVERS;
Pool sizing formula
The optimal pool size depends on your hardware, not your application's concurrency:
optimal_pool_size = (number_of_CPU_cores * 2) + number_of_disksFor a server with 8 cores and SSD storage (count as 1 disk), the optimal pool is around 17 connections. This may seem small, but PostgreSQL can only truly execute as many queries in parallel as it has CPU cores. Beyond that, connections compete for CPU time and context switching reduces throughput.
-- Check how many connections are actually active (not idle) at any time
-- This tells you how many pool connections you actually need
SELECT
    count(*) FILTER (WHERE state = 'active') AS truly_active,
    count(*) FILTER (WHERE state = 'idle') AS idle,
    count(*) FILTER (WHERE state = 'idle in transaction') AS idle_in_txn,
    count(*) AS total
FROM pg_stat_activity
WHERE backend_type = 'client backend';
If truly_active is consistently below 20, a pool size of 20-25 is sufficient regardless of how many application instances you have. Setting the pool larger just wastes memory.
Supavisor (cloud-native alternative)
Supavisor is Supabase's open-source connection pooler built in Elixir, designed for multi-tenant cloud environments:
# supavisor configuration
tenants:
  - id: "my-tenant"
    db_host: "localhost"
    db_port: 5432
    db_database: "myapp"
    pool_size: 20
    mode: "transaction"  # or "session"
    # Supavisor supports named prepared statements in transaction mode
    # (unlike PgBouncer which requires session mode for prepared statements)
Supavisor's key advantages over PgBouncer: it is multi-threaded (handles more client connections per instance), supports named prepared statements in transaction mode, and provides per-tenant pool isolation for multi-tenant architectures.
Application-level pooling
Most database drivers include built-in connection pooling. Use it in addition to (not instead of) an external pooler:
# Python: SQLAlchemy connection pool
from sqlalchemy import create_engine

engine = create_engine(
    "postgresql://user:password@pgbouncer-host:6432/myapp",
    pool_size=5,           # connections per application instance
    max_overflow=10,       # burst capacity
    pool_timeout=30,       # seconds to wait for a connection
    pool_recycle=3600,     # recreate connections after 1 hour
    pool_pre_ping=True,    # verify connections before use
)
// Node.js: pg connection pool
const { Pool } = require('pg');
const pool = new Pool({
host: 'pgbouncer-host',
port: 6432,
database: 'myapp',
max: 5, // connections per application instance
idleTimeoutMillis: 30000, // close idle connections after 30s
connectionTimeoutMillis: 5000,
});The application pool size should be small (5-10 per instance) when connecting through PgBouncer. The application pool handles connection lifecycle within the application, while PgBouncer handles multiplexing across all application instances.
Preventing idle-in-transaction connection waste
-- Set server-level timeout for idle-in-transaction connections
ALTER SYSTEM SET idle_in_transaction_session_timeout = '60s';
SELECT pg_reload_conf();

-- Set statement timeout to prevent runaway queries from holding connections
ALTER SYSTEM SET statement_timeout = '300s';
SELECT pg_reload_conf();
How to Prevent It
Right-size your pool from the start
Do not set max_connections = 1000 and hope for the best. Start with the formula (CPU cores * 2) + disks and measure. If your application instances have 5 connections each and you run 10 instances, that is 50 application connections -- PgBouncer's default_pool_size = 20 can handle this easily because most connections are idle at any moment.
Monitor connection utilization trends
Connection problems build gradually. A connection leak adds one connection per hour. A new microservice starts with 5 connections, then someone increases it to 20 during a load test and never reverts it. myDBA.dev tracks connection counts continuously, making it easy to spot these slow-building issues before they cause an outage. Set alerts at 70% of max_connections to give yourself time to investigate.
Use transaction mode pooling by default
Transaction mode gives the best connection reuse. Only switch to session mode if you explicitly need prepared statements (and PgBouncer rather than Supavisor), LISTEN/NOTIFY, temporary tables, or session-level SET commands. If you need these features for a specific workload, consider running two PgBouncer instances: one in transaction mode for the general workload and one in session mode for the specific use case.
Set timeouts to prevent connection hoarding
Configure idle_in_transaction_session_timeout (terminate transactions that sit idle), statement_timeout (prevent runaway queries), and client_idle_timeout in PgBouncer (close unused client connections). These safety nets prevent a single misbehaving application from consuming all pool connections.
FAQ
Does PostgreSQL have built-in connection pooling?
PostgreSQL does not have a built-in connection pooler as of version 17. Each client connection creates a new OS process. There has been ongoing development toward built-in pooling and connection multiplexing, but as of early 2026 it is not production-ready. Use PgBouncer, Supavisor, pgcat, or application-level pooling instead.
What is the best PostgreSQL connection pooler?
PgBouncer is the most battle-tested option, used in production by organizations of all sizes. It is lightweight, stable, and well-documented. Supavisor is better for multi-tenant and cloud-native environments, and supports prepared statements in transaction mode. pgcat (by Instacart) offers sharding and load balancing. For most single-tenant deployments, PgBouncer in transaction mode is the standard choice.
What is the purpose of connection pooling?
Connection pooling reduces the overhead of creating and maintaining database connections. Without pooling, each application request creates a new connection (50-100ms with TLS), and idle connections consume 5-10 MB of memory each. Pooling maintains a fixed set of database connections and shares them among application connections, reducing memory usage, eliminating connection startup latency, and allowing far more application concurrency than max_connections would otherwise allow.
What is the recommended PostgreSQL connection pool size?
The formula (number_of_CPU_cores * 2) + number_of_disks gives a starting point for the database-side pool size. For an 8-core server with SSD, that is about 17. This is the total across all application instances -- each instance should use a small pool (5-10) connecting through an external pooler. Setting the pool larger than this wastes memory without improving throughput, because PostgreSQL can only execute as many queries in parallel as it has CPU cores.