A detailed Postgres health check, free
Connect your primary instance. MyDBA starts finding real problems within minutes, then sends you four reports over your first week as query, index and workload history builds up.
Read-only access · managed collector · disconnect any time
How it works
Three steps, and the longest one is deciding what to call the connection.
Create an account
Email and password. No credit card, no sales call, no trial clock.
Connect your primary instance
The setup wizard generates the SQL for a read-only monitoring user, detects which extensions you already have, and tells you what is missing. A managed collector connects to it — nothing is installed on your infrastructure.
Read your findings
Findings appear as useful data arrives. First-week and weekly reports follow your notification preferences and require enough collected data.
More detail on the setup assistant, how collection works and what the collector can access.
Your first week, report by report
Four reports, each one built from more data than the last. They arrive by email as PDFs.
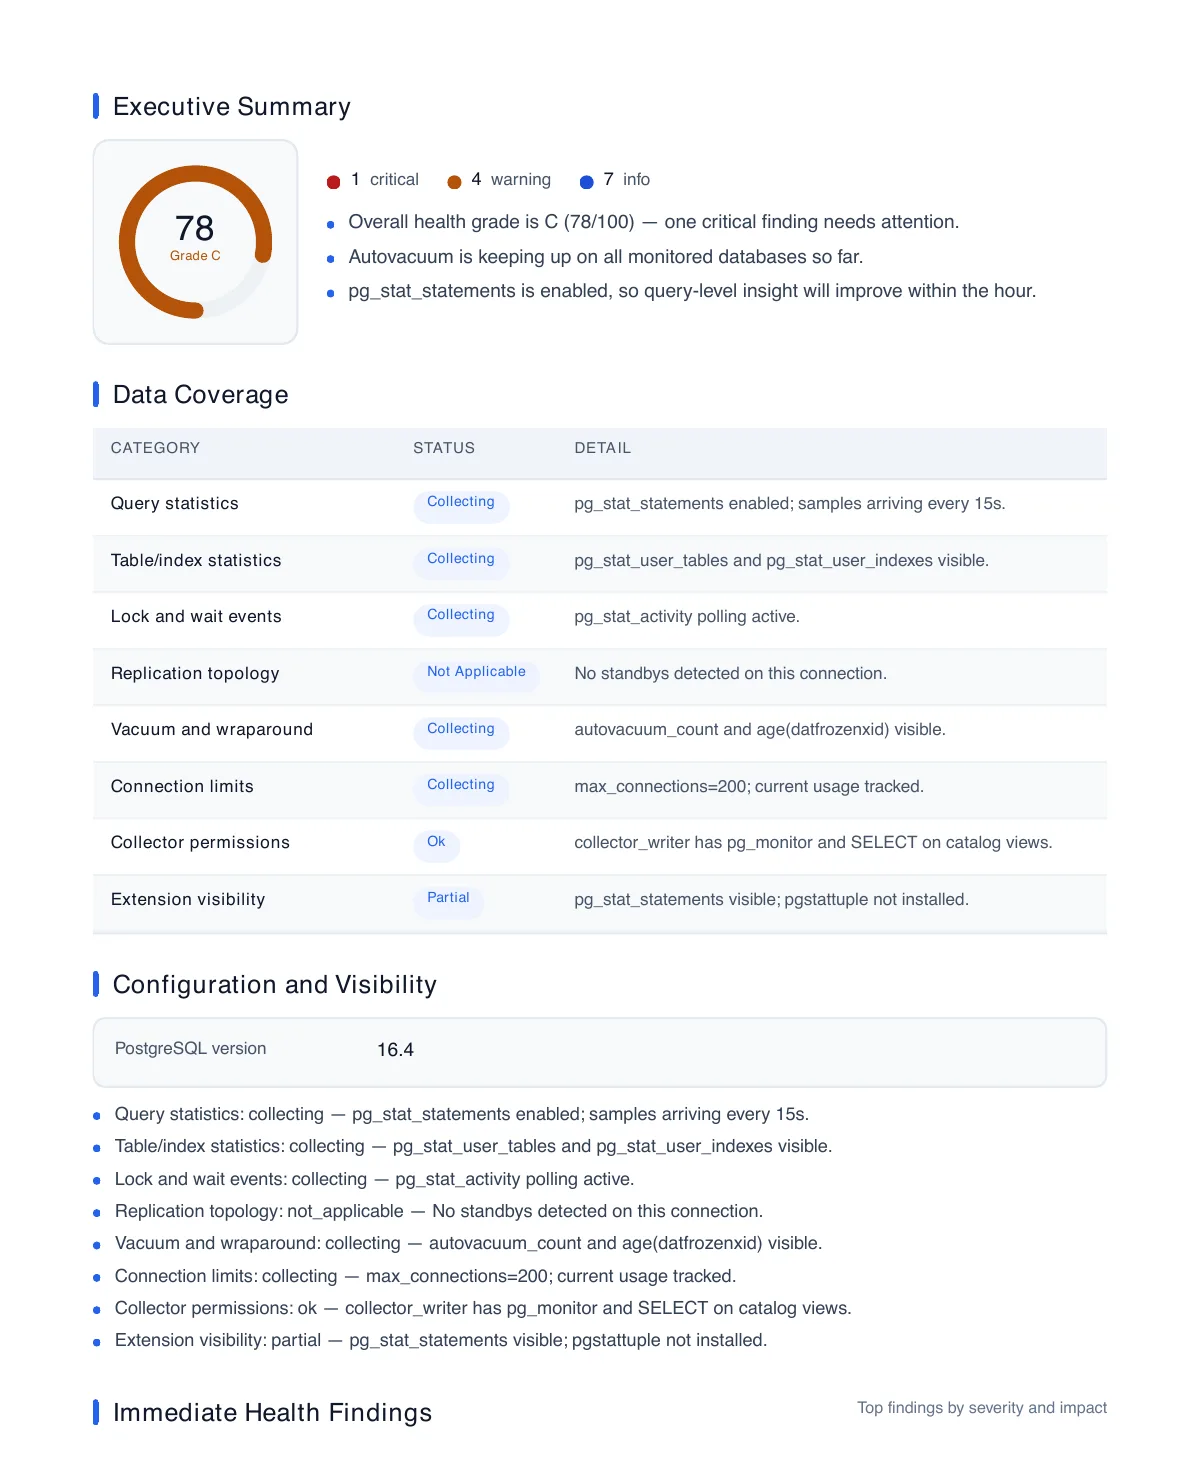
Initial health snapshot
Your first health grade, and the problems MyDBA can already see — tables that are not being vacuumed, connection pressure, configuration that will bite you later. It also tells you exactly what it can and cannot see yet, so you know how much to trust it.
- Overall health grade and a score for each domain
- The top five findings in detail, with a count of the rest
- A confidence label on every finding
- A data-coverage panel showing what is being collected
First workload signals
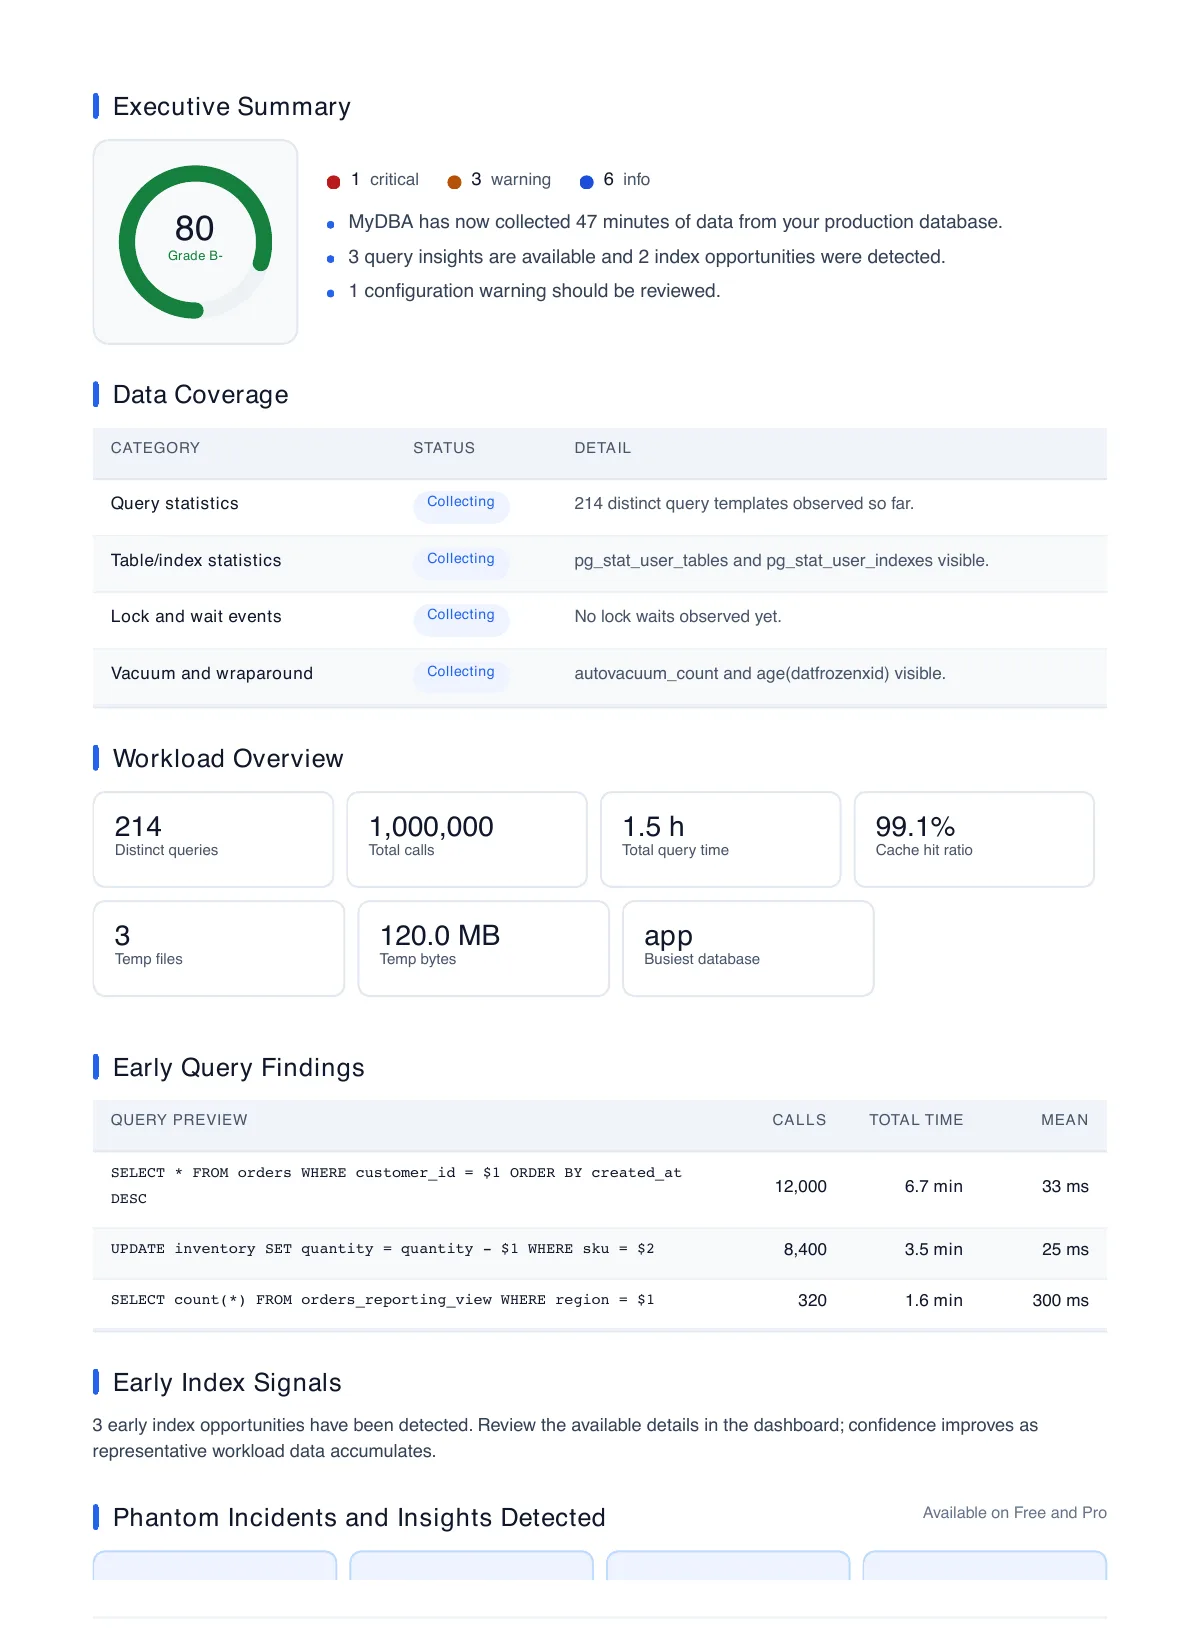
Enough query data has arrived to say something about your workload: which query shapes dominate, and where the first index opportunities are. The grade updates as the picture fills in.
- Workload overview across the first hour
- Your top five queries, previewed
- Counts of the query insights and index opportunities found so far
24-hour recommendation review
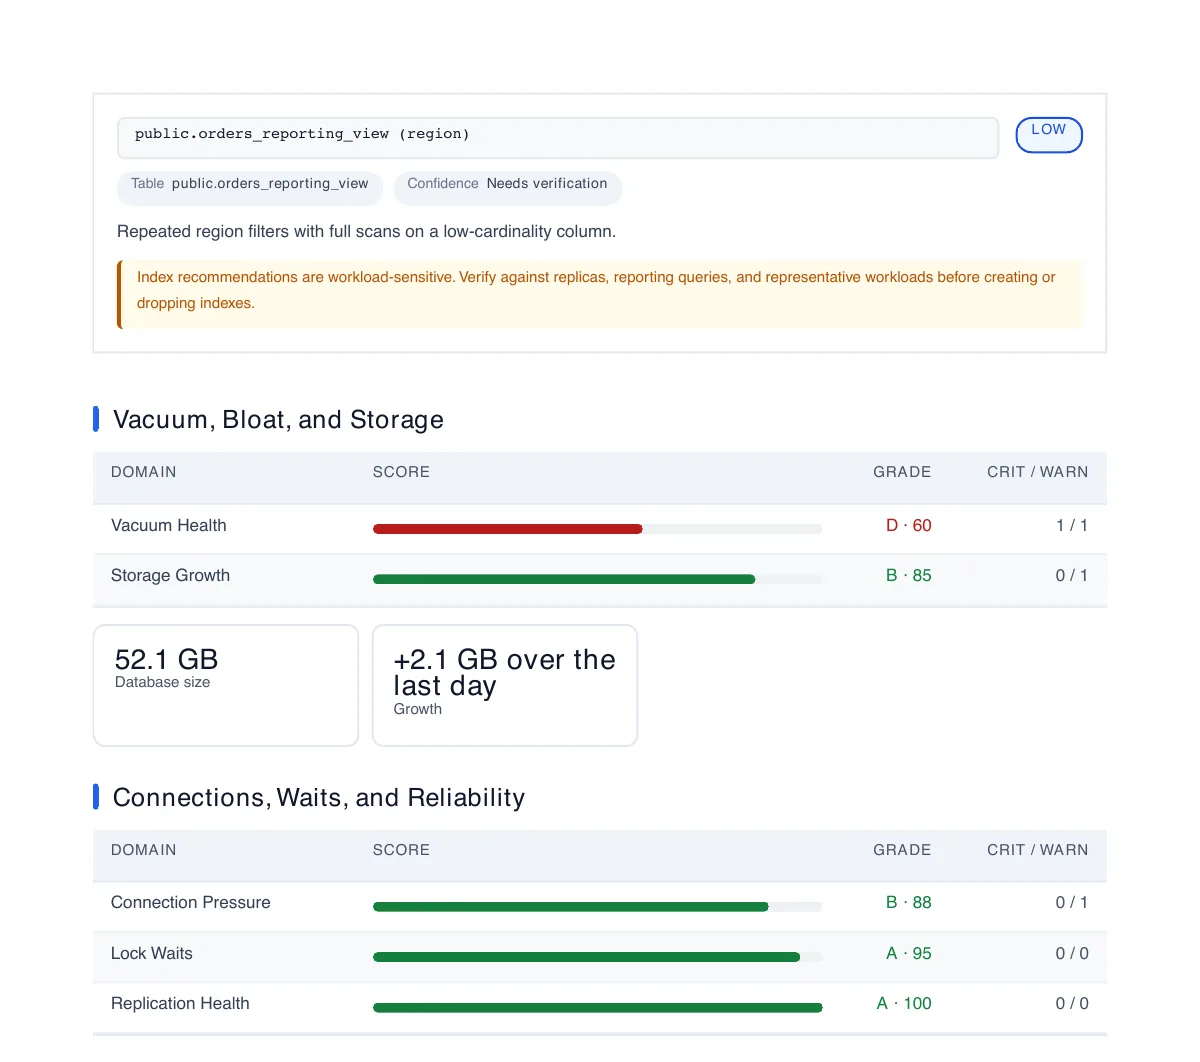
A full day of workload means real recommendations: which indexes look worth adding, where bloat and vacuum are heading, and what to do first. Every index suggestion carries a verification warning, because a recommendation from one day of traffic is a candidate, not an instruction.
- Index opportunity review — candidate shapes, never raw SQL to paste
- Vacuum, bloat and storage growth
- Connections, waits and reliability
- A prioritised 24-hour action plan
Week-one health review
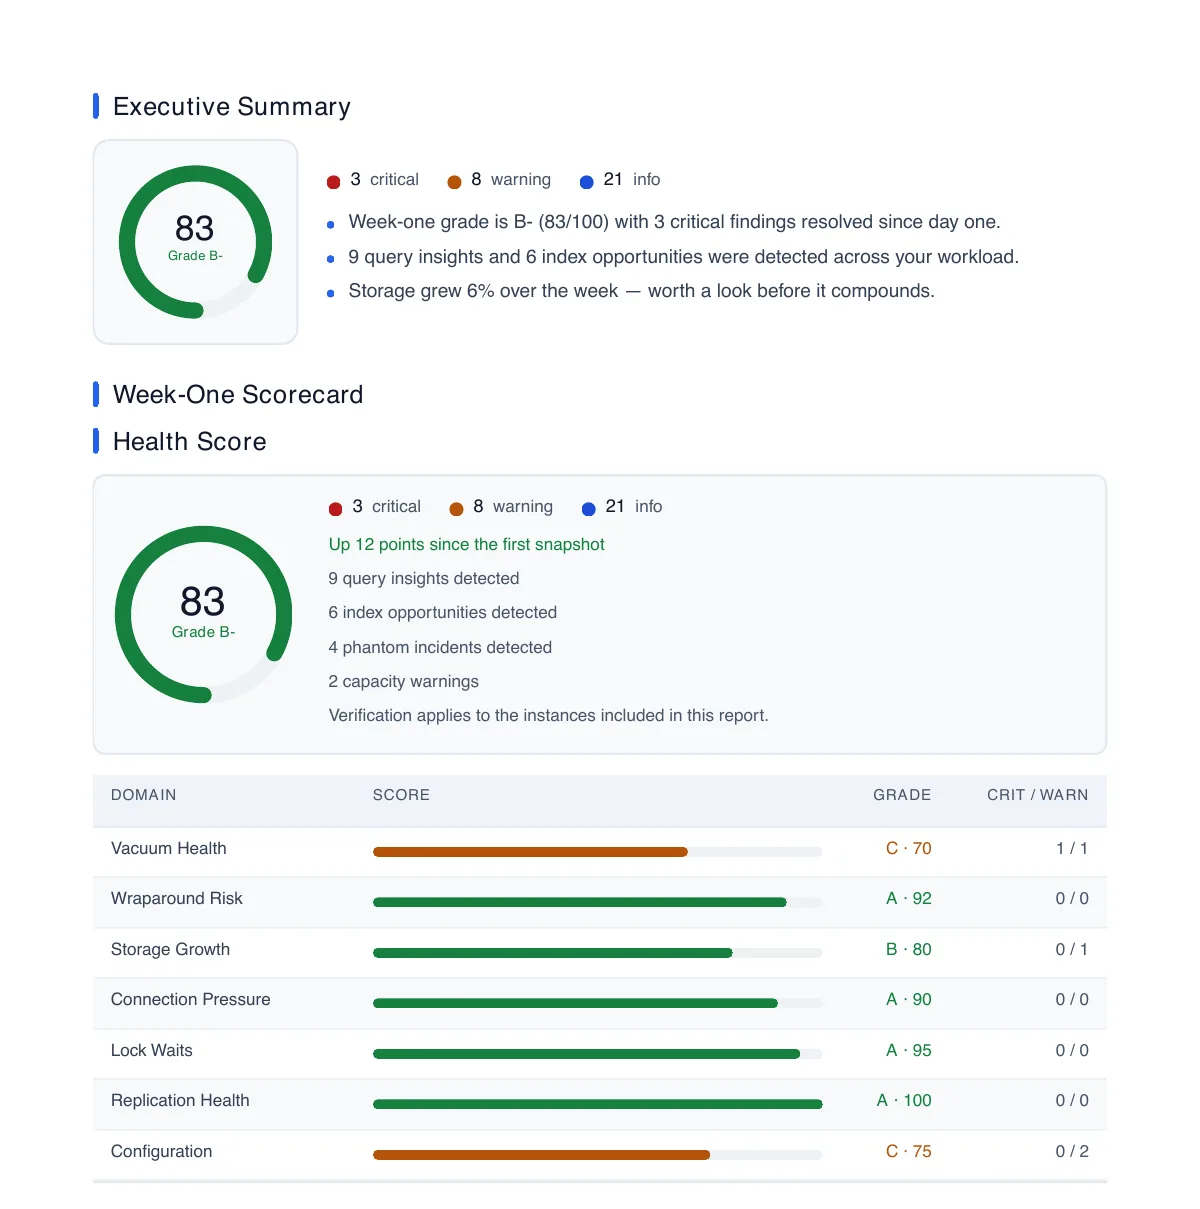
The one that is actually worth keeping. A week of history means MyDBA can show you what changed since day one, where your storage and capacity are trending, and a plan for the week ahead.
- Week-one scorecard — now versus the first reading
- Capacity and growth trends, or an honest "needs more time"
- A seven-day action plan
What these reports will not do
Reports get more accurate as data accumulates. Index and query recommendations are candidates to review, not verified-safe SQL to paste into production. Recommendations become more accurate with more workload history, replicas, and non-production environments, because query and index usage can differ across your estate.
If there is not yet enough useful data for a stage, MyDBA waits rather than sending you an empty report.
And then it keeps going
You keep every included feature after the first week. New Free connections get seven days of full collection, then reduced sampling. Free and Pro include 30 days of monitoring history.
A weekly health report
What changed since last week, subject to your report preferences and sufficient collected data.
Continuous health scoring
Scores keep updating across every domain, not just during the first week.
Dashboard and health checks
Full access for your Unlimited monitored databases.
30-day history
Enough to see a trend rather than a single reading.
What free includes, and what it doesn't
Free includes the tools to investigate and act on findings. Pro adds more monitored instances and a monthly built-in AI allowance.
Included on free
- Health scores and grades across every domain
- The four-report first-week sequence and ongoing weekly report
- All monitoring and investigation pages
- Alerting and notifications
- Query and index drill-downs, EXPLAIN plans and incident analysis
- All databases on one primary instance and team access
- Shared managed or self-hosted collector included
- Unlimited bring-your-own-key AI (provider charges apply)
Sized for Unlimited monitored databases on 1 primary instance, with team access included.
Not on free
- Additional primary instances and replicas — Pro bills every primary at £50 and every replica at £25 per month
- Platform-funded AI — new Pro subscriptions include 20 operations per organization per UTC month; your own API key works on either plan
- Dedicated managed collectors — Shared managed collection and self-hosted collector software are included on Free and Pro. Dedicated managed collectors cost £50 per machine per month and do not increase your monitoring allowance.
All non-AI features remain available on Free. Compare the plans.
Questions people actually ask
Find out what your database is hiding
Connect your primary instance and read your first health grade in about fifteen minutes. No credit card required.
Start your free health check