MyDBA.dev vs pganalyze: Which PostgreSQL Monitor Should You Choose?
MyDBA.dev vs pganalyze: Which PostgreSQL Monitor Should You Choose?
Choosing a PostgreSQL monitoring tool is a decision you'll live with for years. The wrong choice doesn't usually break anything -- it just means you miss problems until they become incidents. Both MyDBA.dev and pganalyze are PostgreSQL-focused monitoring platforms (not generic infrastructure tools that bolt on database support as an afterthought), but they take meaningfully different approaches to what "monitoring" means.
This comparison is based on each tool's publicly documented capabilities as of early 2026. We'll be honest about where pganalyze is stronger and where MyDBA.dev goes further.
The Quick Summary
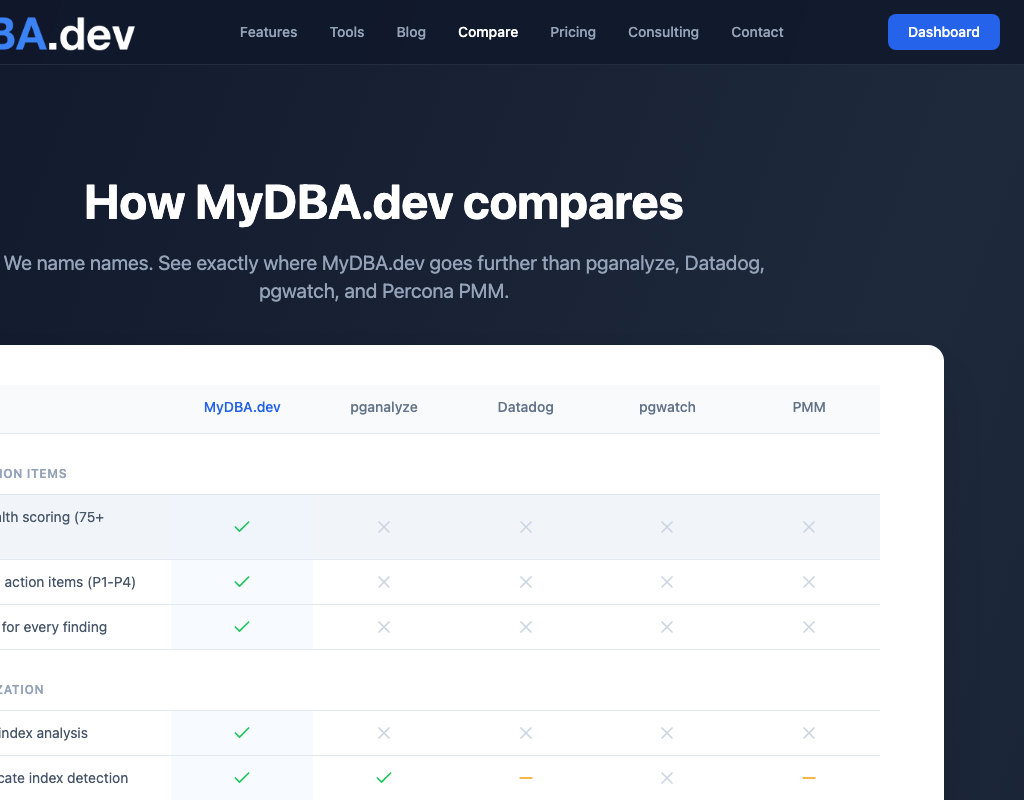
| Capability | MyDBA.dev | pganalyze | |-----------|-----------|-----------| | Pricing | Free: one primary or standalone, no replicas; Pro: £50/primary + £25/replica/month (GBP) | Current plans and trial: pganalyze pricing | | Health checks | 75+ automated checks with SQL fix scripts | ~20-30 checks, no fix scripts | | Index advisor | Cluster-aware (aggregates across replicas) | "What If?" hypothetical analysis | | VACUUM advisor | Health checks with remediation SQL | Per-table recommendations with freezing analysis | | XID wraparound | Dedicated dashboard, blocker detection, recovery scripts | Basic xmin horizon detection | | Extension monitoring | TimescaleDB, pgvector, PostGIS | None | | Query analysis | EXPLAIN plans, statement type filtering, sample parameters | EXPLAIN plans, log insights, wait events | | Schema diff | Cross-instance comparison with ALTER scripts | Not available | | Deployment | Lightweight Go collector (single binary) | Ruby-based collector | | Lock analysis | Visual lock chain trees | Wait event analysis |
Where pganalyze Excels
pganalyze has been in the PostgreSQL monitoring space since 2013 and has built real depth in several areas.
Index advisor with "What If?" analysis. pganalyze's index advisor uses hypothetical index simulation (via HypoPG-style analysis) to recommend new indexes and estimate their impact before you create them. It evaluates candidate indexes against your actual query workload and predicts the performance improvement. This is a genuinely useful approach -- you can see estimated cost reduction before committing to an index that consumes disk space and slows writes.
VACUUM advisor with per-table recommendations. pganalyze provides detailed per-table VACUUM recommendations, including analysis of freezing behavior and specific autovacuum setting suggestions. Their VACUUM dashboard shows freeze age progression and highlights tables approaching wraparound. For teams that need granular autovacuum tuning guidance, this is well-executed.
Query analysis with log insights. pganalyze parses PostgreSQL logs to surface connection errors, checkpoint issues, lock timeouts, and other events that pg_stat_statements alone cannot capture. Their log insights feature categorizes log entries and correlates them with performance events, which helps teams that rely heavily on log analysis for troubleshooting.
Mature and stable. pganalyze has been refining their product for over a decade. The UI is polished, the collector is battle-tested across thousands of deployments, and their documentation is thorough. If you need a tool that "just works" with minimal surprises, pganalyze delivers that.
Where MyDBA.dev Goes Further
MyDBA.dev launched in 2025 with a different philosophy: monitoring should tell you what's wrong AND how to fix it, not just show you charts and leave the diagnosis to you.
Health Scoring with Fix Scripts
MyDBA.dev runs 75+ automated health checks across 12 domains (indexes, vacuum, security, WAL, replication, storage, connections, configuration, queries, extensions, locks, and XID). Each failing check includes a severity score, a plain-English explanation of the problem, and a ready-to-run SQL fix script.
pganalyze surfaces around 20-30 check-style findings, but without generated fix scripts. The difference matters at 3am when you're debugging a production issue -- having a tested remediation query ready to copy-paste saves meaningful time.
Extension Monitoring
This is arguably the largest gap between the two platforms. MyDBA.dev provides dedicated monitoring dashboards for three major PostgreSQL extensions:
- TimescaleDB -- chunk health, compression ratios, continuous aggregate staleness, job monitoring, retention policy tracking, and 15+ TimescaleDB-specific health checks
- pgvector -- index type analysis (IVFFlat vs HNSW), recall estimation, vector dimension tracking, storage analysis, and 13 pgvector-specific health checks
- PostGIS -- spatial index coverage, geometry quality sampling, SRID consistency, coordinate system validation, and 19 PostGIS-specific health checks
pganalyze has zero extension monitoring. If you're running TimescaleDB for time-series data, pgvector for AI/ML embeddings, or PostGIS for geospatial workloads, pganalyze provides no visibility into the extension-specific behavior that dominates your performance profile.
XID Wraparound Protection
Transaction ID wraparound is the one PostgreSQL failure mode that can force your database into read-only emergency mode. MyDBA.dev provides a dedicated XID wraparound dashboard that shows:
- Current XID age across all databases and tables
- Tables approaching the 2-billion-transaction danger zone
- Blocker detection -- long-running transactions, abandoned replication slots, and prepared transactions that prevent XID advancement
- Ready-to-run recovery scripts for each blocker type
pganalyze shows basic xmin horizon information and flags tables with high XID age, but doesn't provide the blocker analysis or remediation scripts. When you're racing to prevent an emergency wraparound vacuum, knowing what is blocking progress and how to fix it matters more than knowing the current age number.
Cluster-Aware Index Advisor
Most PostgreSQL deployments use streaming replication, which means read traffic is split across primary and replicas. MyDBA.dev's index advisor aggregates index usage statistics across the entire replication topology -- primary and all replicas -- to determine whether an index is truly unused or just unused on one server.
An index that appears unused on the primary may be heavily used on a read replica serving your analytics workload. Dropping it based on primary-only data would break replica queries. pganalyze's index advisor analyzes each server independently, which can produce misleading "unused index" recommendations in replica topologies.
Schema Diff
MyDBA.dev includes a schema diff tool that compares the schemas of two PostgreSQL instances and generates the ALTER statements needed to bring them into alignment. This is useful for catching schema drift between staging and production, or between primary and a logical replica. pganalyze does not offer schema comparison.
Pricing Comparison
This is where the difference is most stark.
pganalyze: See pganalyze pricing for current plans, billable-server definitions and free-trial terms (checked 14 September 2026).
MyDBA.dev: Free covers one primary or standalone PostgreSQL instance, no replicas, all databases on that instance, all team members, all non-AI diagnostics and 30-day history. Collection frequency reduces after 7 days. Pro costs £50 per primary and £25 per replica per month (GBP), with every monitored instance billed, including the first. All databases, team members, non-AI diagnostics and 30-day history are included. On either plan, use an OpenRouter, OpenAI or Anthropic key with no product monthly AI quota; provider API usage is billed by the provider. New Pro subscriptions also include 20 platform-funded AI operations per organization per UTC calendar month.
For four primary or standalone PostgreSQL instances, MyDBA.dev Pro costs £200/month. One primary plus three replicas costs £125/month. These examples use monthly GBP rates; compare a current pganalyze quote for the same topology and features before deciding.
When to Choose pganalyze
pganalyze is a strong choice if:
- You need mature VACUUM advisory with per-table freezing analysis and specific autovacuum setting recommendations
- Your team values "What If?" hypothetical index analysis that estimates impact before you create indexes
- You rely heavily on PostgreSQL log analysis for troubleshooting (pganalyze's log insights are well-built)
- You're already using pganalyze and it covers your monitoring needs -- switching tools has a real cost
- You don't use TimescaleDB, pgvector, or PostGIS (so the extension monitoring gap doesn't affect you)
When to Choose MyDBA.dev
MyDBA.dev is the better fit if:
- You want health checks that tell you what's wrong AND provide fix scripts, not just alerts
- You run PostgreSQL extensions (TimescaleDB, pgvector, PostGIS) and need visibility into extension-specific behavior
- XID wraparound protection is a priority and you need blocker detection with remediation guidance
- You use read replicas and need index analysis that accounts for cross-replica query patterns
- You need to evaluate monitoring on one primary or standalone instance before paying for a larger fleet
- You want schema diff capabilities for catching drift between environments
Both tools are PostgreSQL-focused and well-built. The right choice depends on which capabilities matter most for your specific workload and team. If you're unsure, MyDBA.dev's free tier lets you evaluate with production data at no cost -- which is ultimately the only way to know if a monitoring tool works for your environment.
---
Try MyDBA.dev free at mydba.dev -- one primary or standalone instance, no replicas, all databases and team members, all non-AI diagnostics, 30-day history; reduced collection frequency after 7 days. No credit card required.