WAL and Vacuum Monitoring: The Two Metrics That Predict Every Outage
WAL and Vacuum Monitoring: The Two Metrics That Predict Every Outage
The Problem
The two most common PostgreSQL failure modes share a pattern: they are slow-moving, fully preventable, and invisible until the moment they are not.
Failure mode 1: Disk exhaustion. WAL segments accumulate because archiving falls behind or replication slots retain old WAL. Temporary files pile up from large sorts. The pg_wal directory grows from 1 GB to 50 GB over a weekend. Monday morning, the disk is full, the database cannot write WAL, and all transactions hang.
Failure mode 2: XID wraparound. Dead tuples accumulate because autovacuum is blocked, throttled, or misconfigured. Transaction ID age creeps from 100 million to 500 million to 1.5 billion. Eventually PostgreSQL refuses new transactions to prevent data corruption. The database becomes effectively read-only.
Both failures are predicted by the same two signals: WAL generation rate and vacuum health. If WAL generation is outpacing archive or cleanup, disk will eventually fill. If dead tuples are accumulating faster than vacuum removes them, XID wraparound is approaching. Both problems develop over days or weeks. Both produce no visible symptoms until the final failure — no slow queries, no error messages, no degraded throughput. Just a sudden, total outage.
The challenge is not that these signals are hard to collect. It is that they require continuous monitoring with trend analysis. A snapshot query showing "WAL rate is 500 MB/hour" is meaningless without knowing whether that is normal for this workload or 5x higher than yesterday.
How to Detect It
WAL generation rate — compare LSN positions over time:
-- Current WAL position (run twice with interval to calculate rate)
SELECT pg_current_wal_lsn() AS current_lsn,
       pg_wal_lsn_diff(pg_current_wal_lsn(), '0/0') / 1024 / 1024 AS total_wal_mb;

-- Checkpoint frequency and timing
SELECT checkpoints_timed, checkpoints_req,
       buffers_checkpoint, buffers_backend,
       checkpoint_write_time, checkpoint_sync_time
FROM pg_stat_bgwriter;
When checkpoints_req (forced checkpoints) is growing faster than checkpoints_timed (scheduled checkpoints), WAL is being generated faster than the configured checkpoint_timeout expects. This means larger I/O spikes during checkpoints and more WAL retained on disk.
Dead tuple accumulation — the leading indicator for vacuum health:
-- Tables with the most dead tuples
SELECT schemaname, relname, n_dead_tup, n_live_tup,
       last_autovacuum, last_autoanalyze,
       CASE WHEN n_live_tup > 0
           THEN round(100.0 * n_dead_tup / n_live_tup, 1) ELSE 0
       END AS dead_pct
FROM pg_stat_user_tables
WHERE n_dead_tup > 1000
ORDER BY n_dead_tup DESC LIMIT 10;

-- Active autovacuum workers (saturation check)
SELECT count(*) AS active_workers,
       current_setting('autovacuum_max_workers')::int AS max_workers
FROM pg_stat_activity
WHERE query LIKE 'autovacuum:%';
If active workers consistently equals max workers, tables are queuing for vacuum. Dead tuples accumulate during the wait, and each vacuum run takes longer because there is more work to do — a feedback loop that gets worse over time.
The fundamental limitation of these queries is that they show the current state, not the trend. You need to run them repeatedly, store the results, and compute deltas. That is monitoring infrastructure work that most teams skip until after the first outage.
How myDBA.dev Shows It
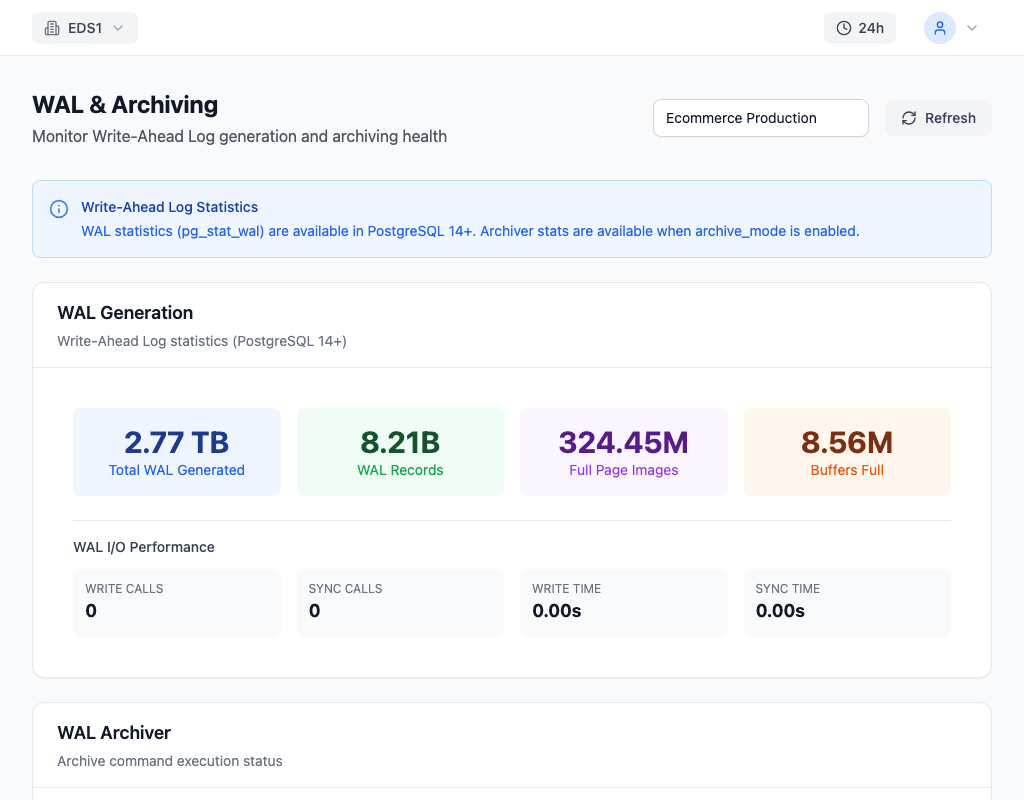
myDBA.dev tracks WAL generation rate as a continuous time series. The chart shows WAL output in MB/hour correlated with checkpoint events and I/O throughput. When WAL generation spikes, you can see the corresponding checkpoint I/O increase and determine whether it is a one-time event (a large batch import) or a sustained trend (an application change generating more writes). Archive lag is overlaid on the same timeline — if the archive process falls behind the generation rate, the divergence is visible days before disk actually fills.
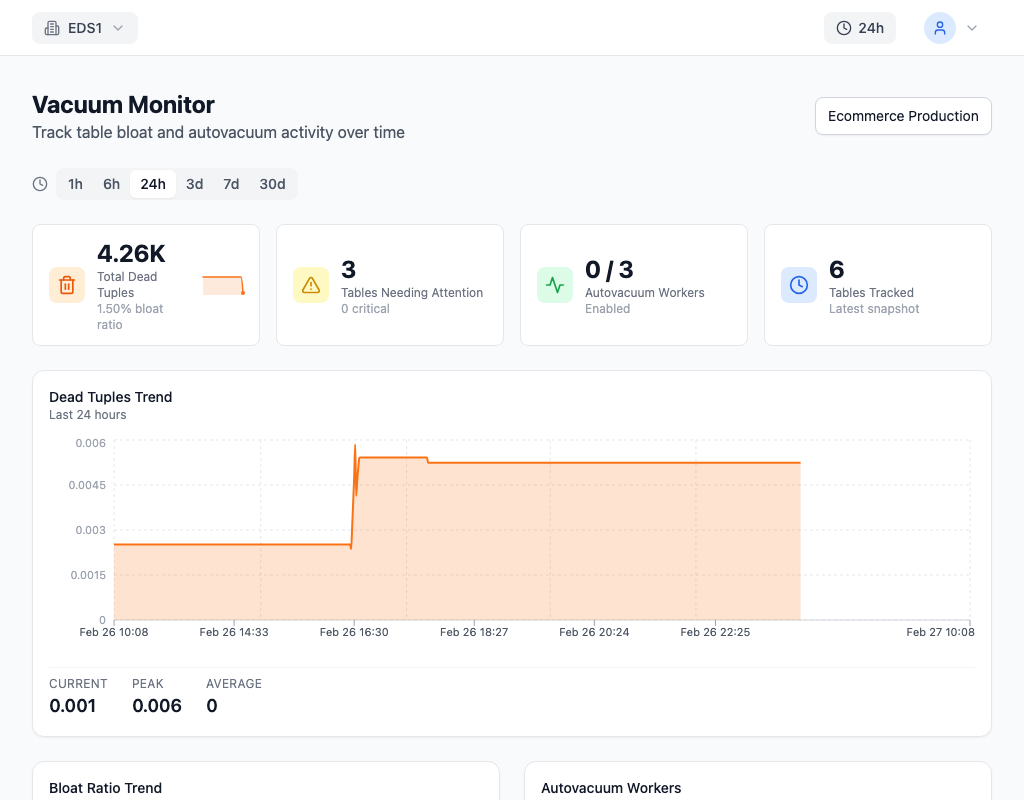
The vacuum monitoring view shows per-table dead tuple ratios as a time series, not just a point-in-time snapshot. You can see which tables have steady-state dead tuples (healthy — vacuum is keeping up) versus tables where dead tuples are climbing (unhealthy — vacuum is falling behind). Autovacuum worker timelines show when each worker started and finished, revealing whether workers are saturated. Vacuum run duration trends answer the critical question: "Is vacuum taking longer on this table than it used to?" If duration is increasing, bloat is accumulating between runs and you need to trigger vacuum more frequently.
Together, these two views form an early warning system. WAL trends predict disk exhaustion. Vacuum trends predict XID wraparound. Both give you days or weeks of lead time to intervene.
How to Fix It
WAL accumulation — tune checkpoint and WAL configuration:
-- Increase max_wal_size to reduce forced checkpoints
ALTER SYSTEM SET max_wal_size = '4GB';
-- Spread checkpoint I/O over the full interval
ALTER SYSTEM SET checkpoint_completion_target = 0.9;
-- Compress WAL to reduce disk usage and archive bandwidth
ALTER SYSTEM SET wal_compression = 'lz4';
SELECT pg_reload_conf();
If WAL accumulation is caused by a lagging replication slot, either fix the subscriber or drop the slot:
-- Check slot lag
SELECT slot_name, active,
       pg_size_pretty(pg_wal_lsn_diff(pg_current_wal_lsn(), restart_lsn)) AS lag
FROM pg_replication_slots;
Vacuum backlog — per-table autovacuum tuning:
-- More aggressive vacuum on high-churn tables
ALTER TABLE events SET (
    autovacuum_vacuum_scale_factor = 0.02,
    autovacuum_vacuum_cost_delay = 2,
    autovacuum_vacuum_cost_limit = 1000
);

-- Add more workers if all are consistently busy
-- In postgresql.conf (requires restart):
-- autovacuum_max_workers = 5
For immediate dead tuple cleanup, run a manual vacuum on the worst tables:
VACUUM (VERBOSE) events;
VACUUM (VERBOSE) sessions;
The VERBOSE flag outputs per-page statistics including pages scanned, tuples removed, and pages truncated — confirming that vacuum is actually making progress.
How to Prevent It
Monitor both metrics continuously with alerts on trend, not just threshold. A WAL generation rate that doubles in a week is an alert-worthy event even if the absolute value is still within disk capacity. A dead tuple count that is climbing on a specific table is a signal even if XID age is still low.
Set concrete alert thresholds:
- WAL: alert when generation rate exceeds 2x the 7-day average, or when
pg_waldirectory exceeds 50% of available disk - Vacuum: alert when any table's dead tuple ratio exceeds 20%, or when all autovacuum workers are busy for more than 10 consecutive minutes
myDBA.dev tracks both WAL and vacuum metrics with historical trending, making it possible to spot the slow divergence that precedes both failure modes. The goal is not to react to outages — it is to see them forming days in advance and intervene when the fix is a configuration change rather than an emergency recovery.