Understanding and Fixing Table Bloat in PostgreSQL
Understanding and Fixing Table Bloat in PostgreSQL
The Problem
PostgreSQL uses Multi-Version Concurrency Control (MVCC) to allow readers and writers to operate without blocking each other. When you UPDATE a row, PostgreSQL does not modify it in place — it marks the old version as dead and writes a new version elsewhere in the table. When you DELETE, the row is marked dead but not physically removed. These leftover rows are called dead tuples.
Autovacuum is responsible for reclaiming dead tuples, but when updates outpace vacuuming — or when long-running transactions prevent cleanup — dead tuples accumulate faster than they are removed. The table file grows larger than it needs to be. This is table bloat.
The effects compound in ways that are not immediately obvious. Sequential scans read dead rows alongside live ones, wasting I/O bandwidth. Indexes still point to dead tuples, inflating index size and making index scans read more pages. The shared buffer cache fills with pages containing dead data, reducing the effective amount of memory available for useful data. A table with 40% bloat uses 40% more disk, 40% more memory, and performs roughly 40% more I/O than the same data without bloat.
High-churn OLTP tables are especially vulnerable. An orders table processing hundreds of status updates per second can accumulate thousands of dead tuples per minute. Even with autovacuum running, the default settings (trigger vacuum when 20% of rows are dead) mean a 10-million-row table accumulates 2 million dead tuples before autovacuum kicks in — by which point the damage is done.
How to Detect It
The pg_stat_user_tables view tracks dead tuple counts and vacuum history for every table:
-- Find tables with high dead tuple counts and stale vacuums
SELECT
    schemaname,
    relname AS table_name,
    n_live_tup AS live_tuples,
    n_dead_tup AS dead_tuples,
    CASE WHEN n_live_tup > 0
        THEN round(100.0 * n_dead_tup / n_live_tup, 1)
        ELSE 0
    END AS dead_tuple_percentage,
    last_autovacuum,
    last_autoanalyze
FROM pg_stat_user_tables
WHERE n_dead_tup > 1000
ORDER BY n_dead_tup DESC
LIMIT 20;
A dead_tuple_percentage above 10% is a warning sign. Above 20% means autovacuum is falling behind and you need to investigate why. Check last_autovacuum — if it is NULL or hours old on a high-churn table, autovacuum may be misconfigured, starved for workers, or blocked by long-running transactions.
For a more accurate picture of actual disk bloat (as opposed to dead tuple counts), use the pgstattuple extension:
CREATE EXTENSION IF NOT EXISTS pgstattuple;
SELECT * FROM pgstattuple('sim_events');
This returns dead_tuple_percent and free_space — the actual physical bloat in the table file. The dead tuple count from pg_stat_user_tables is an estimate; pgstattuple reads the table directly and gives you the real number.
The limitation of both approaches is that they show a point-in-time snapshot. You cannot tell from a single query whether bloat is trending up (getting worse), flat (stable), or regularly spiking and recovering (healthy autovacuum cycling). You need historical tracking for that.
How myDBA.dev Shows It
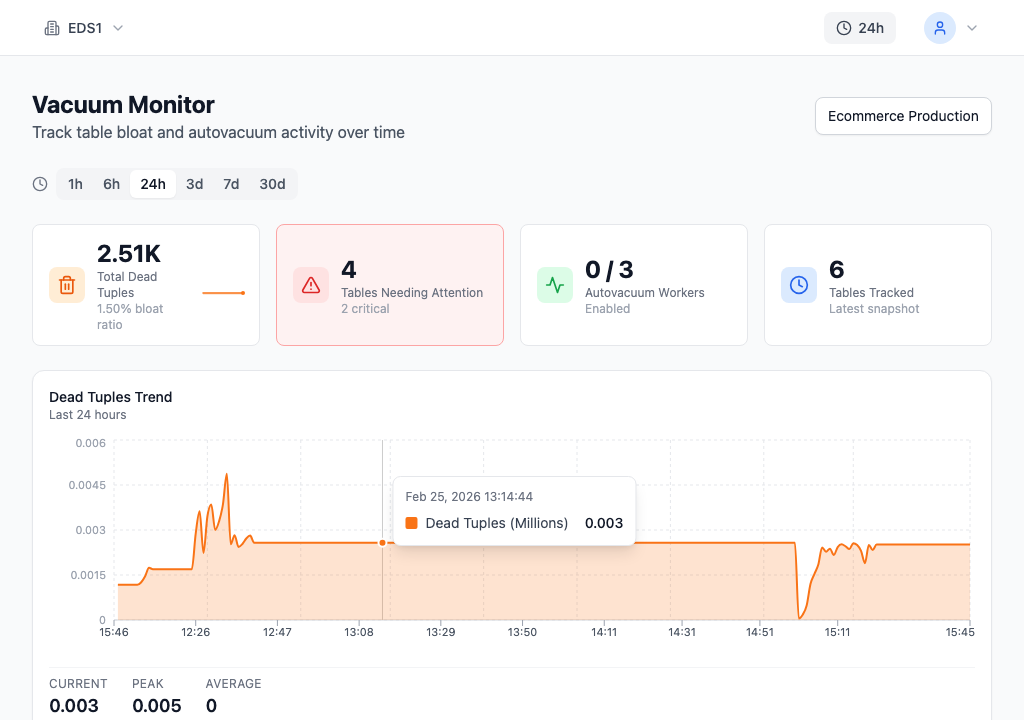
myDBA.dev's Vacuum Monitor tracks dead tuple counts continuously, making bloat trends visible at a glance. The summary cards show the current state at a glance: 2.51K total dead tuples with a 1.50% bloat ratio, 4 tables needing attention (2 critical), autovacuum workers at 0 of 3 active, and 6 tables tracked. The Dead Tuples Trend chart below shows how dead tuples accumulate over time — you can see the spike during a high-update workload, where dead tuples climbed sharply before autovacuum could catch up, then the recovery as vacuum runs completed.
This kind of time-series visibility is what makes bloat manageable. A single point-in-time query tells you "there are 2,500 dead tuples right now." The trend chart tells you whether that number is rising (vacuum is falling behind), flat (stable), or regularly spiking and recovering (healthy autovacuum cycling). Without the trend, you are guessing.
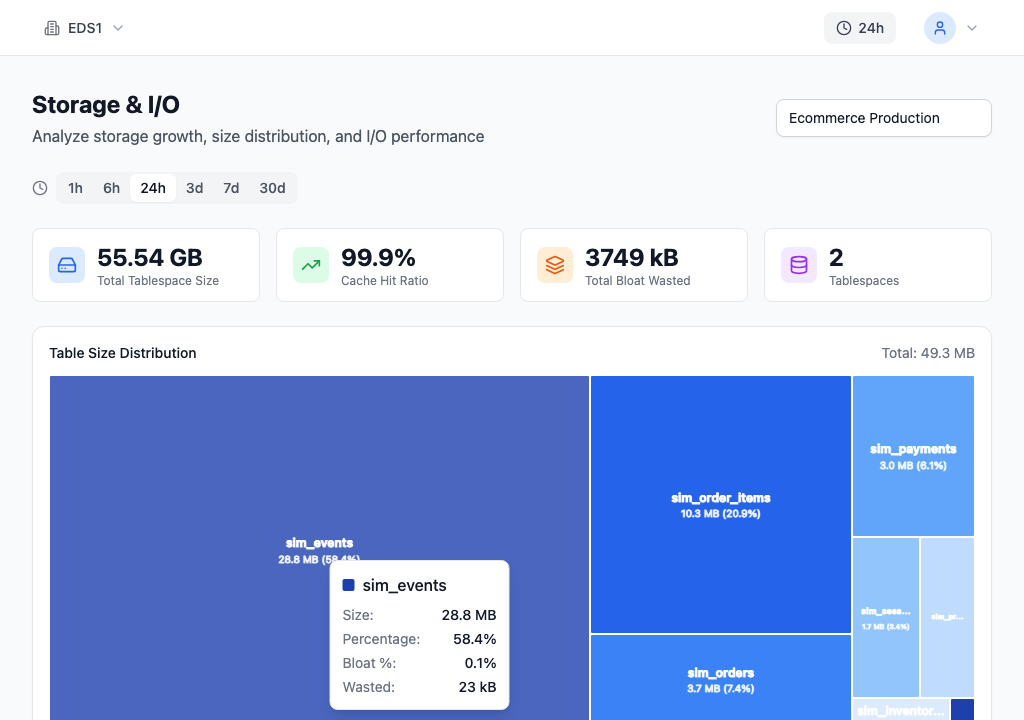
The Storage & I/O page shows the physical impact. The treemap visualization sizes each table rectangle proportionally to disk usage, making it immediately obvious which tables dominate storage. In this example, sim_events occupies the largest area at 28.8 MB (58.4% of total), with the tooltip showing its bloat percentage and wasted space. sim_order_items at 10.3 MB and sim_orders at 3.7 MB are also visible. The summary cards at the top show 55.54 GB total tablespace, 99.9% cache hit ratio, and 3,749 kB of total bloat wasted across the database.
The combination of the Vacuum Monitor's time-series trends and the Storage page's spatial overview gives you both the "is it getting worse?" and "how much space is affected?" views — catching bloat before it compounds into a performance problem.
How to Fix It
For moderate bloat (under 50% dead tuples), a standard VACUUM reclaims dead tuples within the existing table structure:
-- Reclaim dead tuples (does not lock the table for reads)
VACUUM VERBOSE sim_events;
Standard VACUUM marks space as reusable but does not return it to the operating system — the table file stays the same size on disk, but new inserts reuse the freed space rather than extending the file. This is usually fine for tables with ongoing write activity, since the reclaimed space gets reused quickly.
For severe bloat where you need to physically shrink the table and reclaim disk space:
-- VACUUM FULL rewrites the entire table — blocks ALL reads and writes
-- Only run during maintenance windows
VACUUM FULL sim_events;

-- Verify the size decreased
SELECT pg_size_pretty(pg_relation_size('sim_events')) AS table_size;
VACUUM FULL takes an ACCESS EXCLUSIVE lock, blocking every query against the table for the duration. On a 10GB table, this can take minutes to hours. Only use it during maintenance windows when you can afford the downtime.
For large production tables where downtime is unacceptable, pg_repack performs an online table rewrite without exclusive locks:
-- Install the extension (once)
CREATE EXTENSION pg_repack;

-- Repack a table online (no exclusive lock)
-- Run from the command line:
pg_repack -d mydb -t sim_events
pg_repack creates a new copy of the table, replays any changes that happened during the copy, then swaps the old and new tables atomically. It needs roughly 2x the table size in free disk space during the operation.
How to Prevent It
Tune autovacuum per table based on update frequency. The default autovacuum_vacuum_scale_factor of 0.2 (20%) is far too conservative for large, high-churn tables:
-- Make autovacuum trigger 10x earlier on high-churn tables
ALTER TABLE sim_events SET (
    autovacuum_vacuum_scale_factor = 0.02,   -- 2% instead of 20%
    autovacuum_vacuum_threshold = 500
);
With this setting, autovacuum triggers after 2% of rows are dead rather than 20%. On a table with 100,000 rows, that means vacuum starts at 2,000 dead tuples instead of waiting for 20,000. The table stays compact and queries stay fast.
Monitor dead tuple trends continuously rather than spot-checking. A rising trend line means autovacuum is falling behind — you need to either make vacuum more aggressive (lower scale factor, higher cost limit) or add more autovacuum workers. myDBA.dev tracks these metrics over time, making it straightforward to identify tables where dead tuples are accumulating faster than they are being cleaned up.
Avoid long-running transactions on high-churn databases. A single forgotten BEGIN in a psql session holds back the vacuum horizon, preventing cleanup of any rows created after that transaction started. Kill idle-in-transaction sessions proactively with idle_in_transaction_session_timeout.