How do you set up and read pg_stat_statements in PostgreSQL?
Add pg_stat_statements to shared_preload_libraries, restart PostgreSQL, run CREATE EXTENSION pg_stat_statements in each database you care about, then query the view ordered by total_exec_time. Every column is a cumulative counter, so compare two snapshots, not one. Two blind spots: statements cancelled by statement_timeout record calls = 0, and PostgreSQL 18 drops leading comments from the stored text.
Key facts
| Fact | Value | |---|---| | Load method | shared_preload_libraries = 'pg_stat_statements' plus a server restart; CREATE EXTENSION per database (docs) | | Default entry limit | pg_stat_statements.max = 5000 distinct statements; the least-executed entries are discarded when it overflows (docs) | | Default scope | pg_stat_statements.track = top (top-level statements only), track_utility = on, track_planning = off (docs) | | I/O timing columns | shared_blk_read_time and friends stay at zero unless track_io_timing = on, which is off by default (docs) | | Percentiles | None. The view exposes min_exec_time, max_exec_time, mean_exec_time, stddev_exec_time only (docs) | | Eviction visibility | pg_stat_statements_info.dealloc counts discarded entries since the last reset (PostgreSQL 14+) (docs) | | Cancelled statements | A statement cancelled by statement_timeout leaves calls = 0 in its row (measured on PostgreSQL 18.4, 2026-08-17; see below) | | Fleet data | Across 50 monitored instances, 16% have no pg_stat_statements extension installed; across 38, 28.9% run with track_io_timing off (MyDBA aggregate health stats, 2026-09-16) |
Why this happens
pg_stat_statements is a loadable module, not a built-in view. It hooks the planner and executor of every backend, so it must be loaded at server start via shared_preload_libraries; loading it later with LOAD gives you the functions but no shared-memory statistics, and the docs say as much (pg_stat_statements). The CREATE EXTENSION step only creates the view and the reset function in one database. The counters themselves are cluster-wide and keyed by (userid, dbid, toplevel, queryid), so a single database's view already shows statements from every database on the server.
Statements are grouped by queryid, a hash of the post-parse-analysis tree. Constants are replaced with $1, $2, ... in the stored query text, which is why SELECT * FROM t WHERE id = 7 and ... id = 9 share a row while a change in column list, alias or join order creates a new one (docs). The hash ignores comments. Two consequences follow, both of which we learned the hard way while attributing traffic to monitoring tools:
- The stored text is fixed when the entry is created. Adding a
/ app:checkout /tag to a query that already has a row changes nothing untilpg_stat_statements_reset()or eviction creates a fresh entry. - PostgreSQL 18 stores the text from the statement's first token. Across 16 monitored PostgreSQL 18 connections running the same tagged collector query, none retained a leading
/ tag / SELECT ...comment; on PostgreSQL 17 the same query kept its tag on 7 of 20 connections. Put the tag after the first keyword (SELECT / app:checkout / ...) and it survives on every version we have seen.
The bigger blind spot is what never gets counted. Execution counters are written when a statement finishes. A statement that is cancelled, whether by statement_timeout, pg_cancel_backend() or a client disconnect, never reaches that point. We verified this on PostgreSQL 18.4 with SET statement_timeout = '50ms'; SELECT pg_sleep(2); and found the row SELECT pg_sleep($1) present with calls = 0 and zero execution time (the row exists because planning was tracked). A query that always times out can burn CPU for weeks while being absent from every "top queries" list built on this view, including ours. Absence from pg_stat_statements is not evidence that a query never ran.
Finally, every column is a running total since the last reset. mean_exec_time is a lifetime average, so a query that got 10x slower yesterday barely moves it. The stats_since and minmax_stats_since columns added in PostgreSQL 17 tell you how old each row's counters are (docs).
How to detect it
Confirm the module is loaded and the extension exists before anything else:
SHOW shared_preload_libraries;
SELECT extversion FROM pg_extension WHERE extname = 'pg_stat_statements';
SELECT dealloc, stats_reset FROM pg_stat_statements_info;
If the first line lacks pg_stat_statements, stop: CREATE EXTENSION will succeed but the view will raise an error that the module was not loaded. A non-zero dealloc means the 5,000-entry cap has been hit and the least-executed statements are being silently dropped.
Then take the top consumers by total execution time:
SELECT queryid,
       calls,
       round(total_exec_time::numeric, 0)      AS total_ms,
       round(mean_exec_time::numeric, 2)       AS mean_ms,
       rows,
       shared_blks_hit,
       shared_blks_read,
       left(query, 80)                         AS query
FROM   pg_stat_statements
ORDER  BY total_exec_time DESC
LIMIT  10;
The two shapes to look for are a row with a very high calls count and a small mean_ms (cheap per call, expensive in aggregate) and a row with few calls and a mean_ms in the seconds (rare but slow). Both can top the list; they need different fixes, and neither is visible if you sort by mean_exec_time alone. shared_blks_read against shared_blks_hit shows whether a query is disk-bound. To see other users' query text you need the pg_read_all_stats role; without it the query column reads <insufficient privilege> (docs).
To turn cumulative counters into a rate, capture the view into a table on a schedule and subtract:
CREATE TABLE pgss_snap AS
SELECT now() AS taken_at, queryid, dbid, userid, calls, total_exec_time, rows
FROM   pg_stat_statements;
-- later:
INSERT INTO pgss_snap
SELECT now(), queryid, dbid, userid, calls, total_exec_time, rows FROM pg_stat_statements;

SELECT b.queryid,
       b.calls - a.calls                                   AS calls_delta,
       round((b.total_exec_time - a.total_exec_time)::numeric, 0) AS ms_delta
FROM   pgss_snap a
JOIN   pgss_snap b USING (queryid, dbid, userid)
WHERE  a.taken_at = (SELECT min(taken_at) FROM pgss_snap)
AND    b.taken_at = (SELECT max(taken_at) FROM pgss_snap)
AND    b.calls >= a.calls
ORDER  BY ms_delta DESC
LIMIT  10;
The b.calls >= a.calls guard drops rows that were reset or evicted between snapshots. That is the whole of what most monitoring tools do with this view; the rest is storage and charting. The database observability guide covers where this fits alongside logs and wait events.
How MyDBA shows this
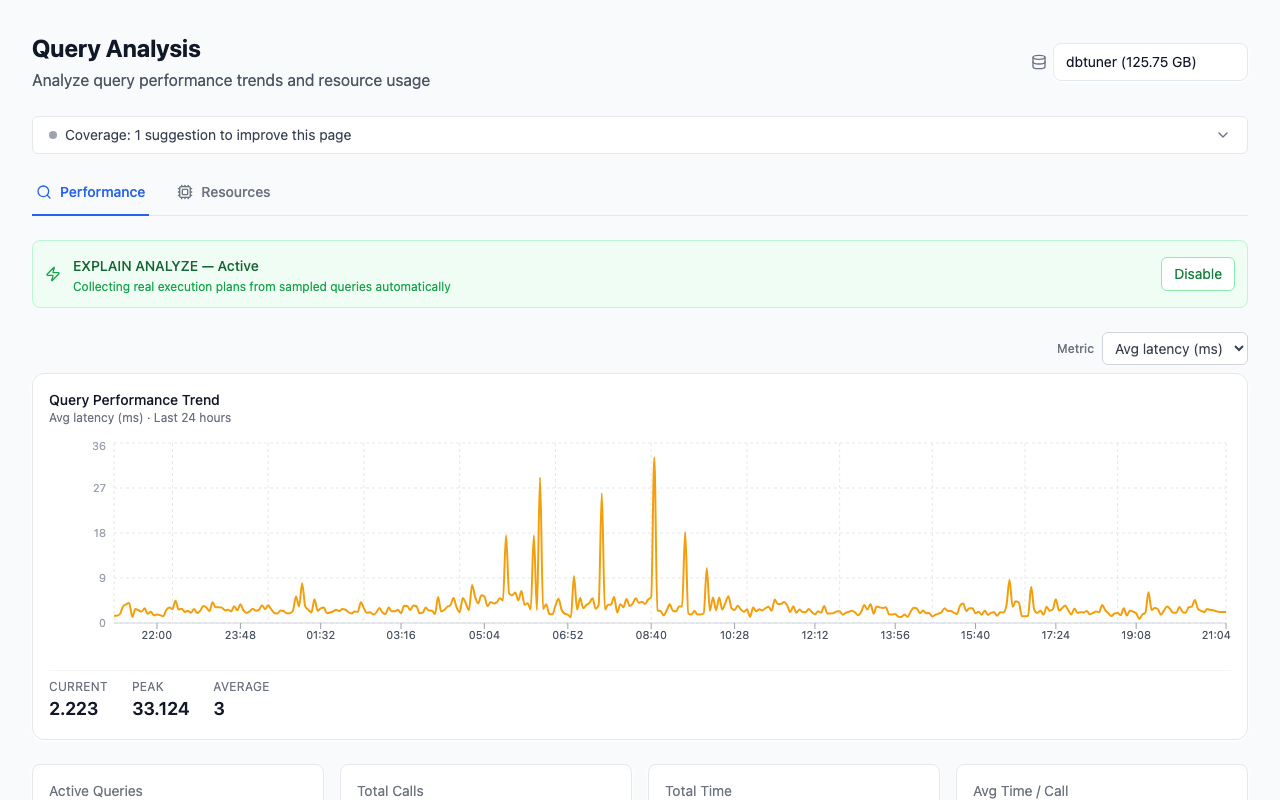
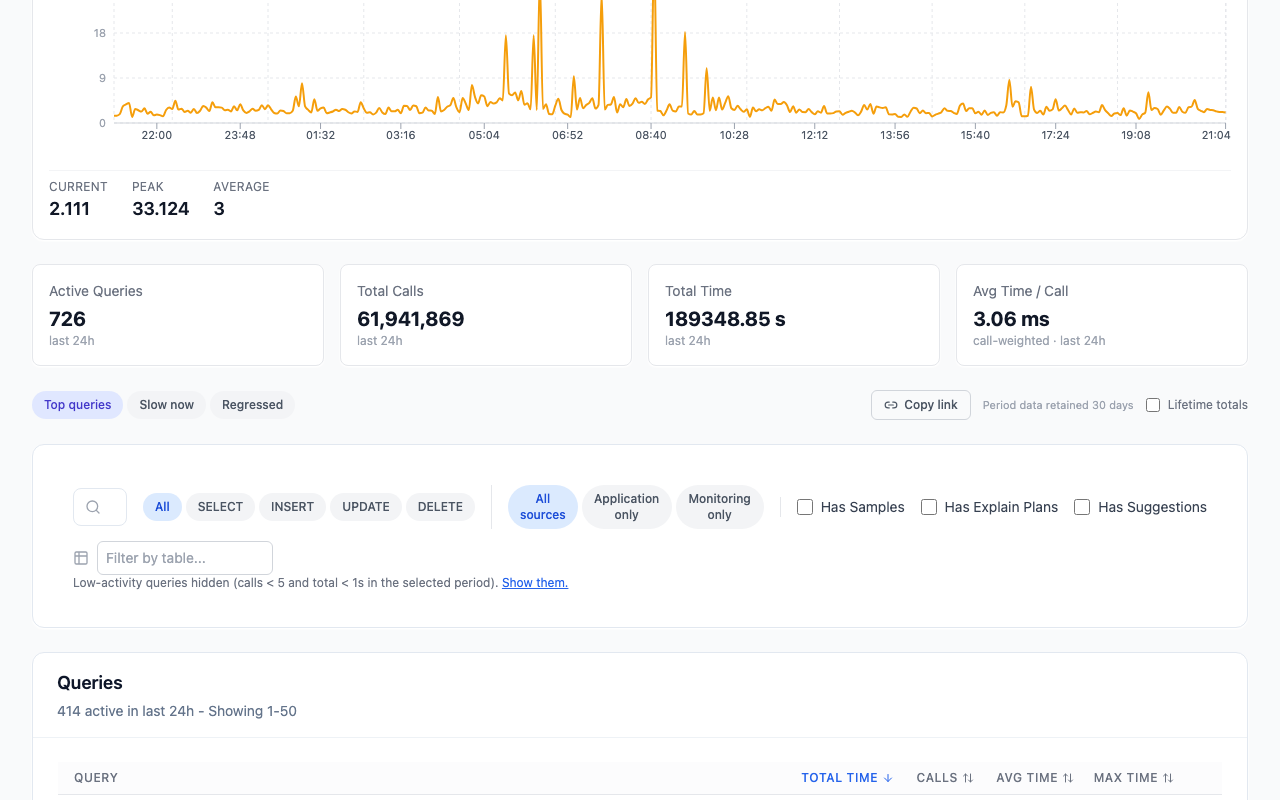
The Queries page ranks statements by total time over the selected window, computed from the difference between successive pg_stat_statements snapshots rather than the lifetime counters, so a query that was hot last night and quiet today drops down the list instead of coasting on its history. Each row carries calls, total time, mean time and rows for the period, a 24-slot sparkline, and a Source badge when the statement was issued by a monitoring tool rather than the application. Lifetime totals are a separate toggle, and a collection gap shows a "no data since" banner rather than a silently stale list. Opening a row shows the per-period trend below.
The detail view plots calls, mean time and total time per interval, with stored EXPLAIN plans where the collector captured one. The calls = 0 case above is why the Queries page cannot be the only place you look: a statement that always times out has no delta to chart. Our free health check flags the missing extension and track_io_timing = off on the configuration domain.
How to fix it
1. Load the module. In postgresql.conf set shared_preload_libraries = 'pg_stat_statements' (append to the existing list if there is one) and restart the server. On RDS and Aurora edit the parameter group; on most managed platforms it is preloaded already (docs). 2. Create the extension in the database you will query from: CREATE EXTENSION IF NOT EXISTS pg_stat_statements;. Repeat per database if you want the view available everywhere, though one is enough to see cluster-wide rows. 3. Turn on track_io_timing = on if you want shared_blk_read_time to mean anything. Check pg_test_timing first on older or virtualised hosts; the overhead is usually negligible on modern kernels (docs). 4. Grant pg_read_all_stats to the monitoring role so it can read every user's query text without superuser. 5. Raise pg_stat_statements.max (a restart is required) if pg_stat_statements_info.dealloc keeps climbing, or normalise your ORM's statement shapes so fewer distinct entries exist. 6. Tag application queries after the first keyword, e.g. SELECT / checkout:list_orders / ..., then SELECT pg_stat_statements_reset(); once so existing entries pick up the new text. Reset also zeroes every counter, so take a snapshot first if you need the history. 7. For statements that time out, instrument the caller. Record the elapsed time and the cancellation in application logs or log_min_duration_statement, because the view will never show them.
How to prevent it
- Alert on
pg_stat_statements_info.deallocincreasing between checks; a growing number means your top-N list is losing entries you never saw. - Snapshot the view at a fixed interval (60 seconds is a common choice) and keep the deltas, so a regression shows up as a step in
ms_delta, not a slow drift inmean_exec_time. - Pair the view with pg_stat_activity for what is running now and with wait events for why it is slow.
pg_stat_statementstells you which statement; it cannot tell you whether the time went to CPU, locks or I/O beyond the block counters. - Watch for
statement_timeoutcancellations in the logs. Underlog_min_error_statement = error(the default) each one is logged ascanceling statement due to statement timeout, which is the only record you will get. - Keep
pg_stat_statements.track = topunless you are debugging functions;alladds a row per nested statement and fills the cap faster.
FAQ
Does pg_stat_statements slow the database down?
The module adds a small fixed cost to planning and execution hooks; the PostgreSQL docs describe it as low overhead and most managed platforms preload it by default. The measurable costs are track_io_timing on hosts with a slow clock source and a very high pg_stat_statements.max with track = all, which grows the shared-memory hash table and the query-text file.
Why does mean_exec_time not change after a query got slower?
Because it is total_exec_time / calls since the last reset. A query with a million historical calls at 2 ms will show a mean of about 2 ms for a long time after each new call starts taking 200 ms. Compare deltas between two snapshots, or reset the statistics, to see current behaviour.
Why is a query missing from pg_stat_statements even though the application runs it?
Four possibilities, in rough order of likelihood: it is being evicted (check pg_stat_statements_info.dealloc); it runs inside a function and track = top hides it; it is cancelled by statement_timeout and records calls = 0; or you lack pg_read_all_stats and are seeing <insufficient privilege> in the query column.
Can I get p95 or p99 latency from pg_stat_statements?
No. The view stores min, max, mean and standard deviation per statement and nothing else. Percentiles need either sampling from log_min_duration_statement output or a tracing layer in the application. This is why comparison tools show a current-window mean against a baseline mean rather than a percentile.
Does pg_stat_statements survive a restart?
With pg_stat_statements.save = on (the default) the statistics are written to disk at shutdown and reloaded at startup. A crash, or pg_stat_statements_reset(), clears them. The stats_since column (PostgreSQL 17+) tells you when each row's counters started.
Part of the PostgreSQL Monitoring Tools Compared (2026) guide. Last verified against PostgreSQL 18, 2026-09-16.