Postgres Wait Events: What Every Backend Is Blocked On
Postgres Wait Events: Reading What Every Backend Is Actually Blocked On
Your query isn't slow, it's waiting
A checkout query sat at 400ms p99 for three weeks. The team had a theory: the disk. It was always the disk. They resized the instance. Same 400ms. They moved to faster io2 storage. Same 400ms. Three sprints burned on a guess dressed up as a diagnosis.
<div style="position:relative;padding-bottom:56.25%;height:0;overflow:hidden;border-radius:0.75rem;margin:2rem 0;"> <iframe src="https://www.youtube.com/embed/8_7iDBquAjA" title="Postgres Wait Events: What Your Database Is Really Waiting On" style="position:absolute;top:0;left:0;width:100%;height:100%;border:0;" allow="accelerometer; autoplay; clipboard-write; encrypted-media; gyroscope; picture-in-picture; web-share" allowfullscreen></iframe> </div>
▶ Watch on YouTube: Postgres Wait Events: What Your Database Is Really Waiting On
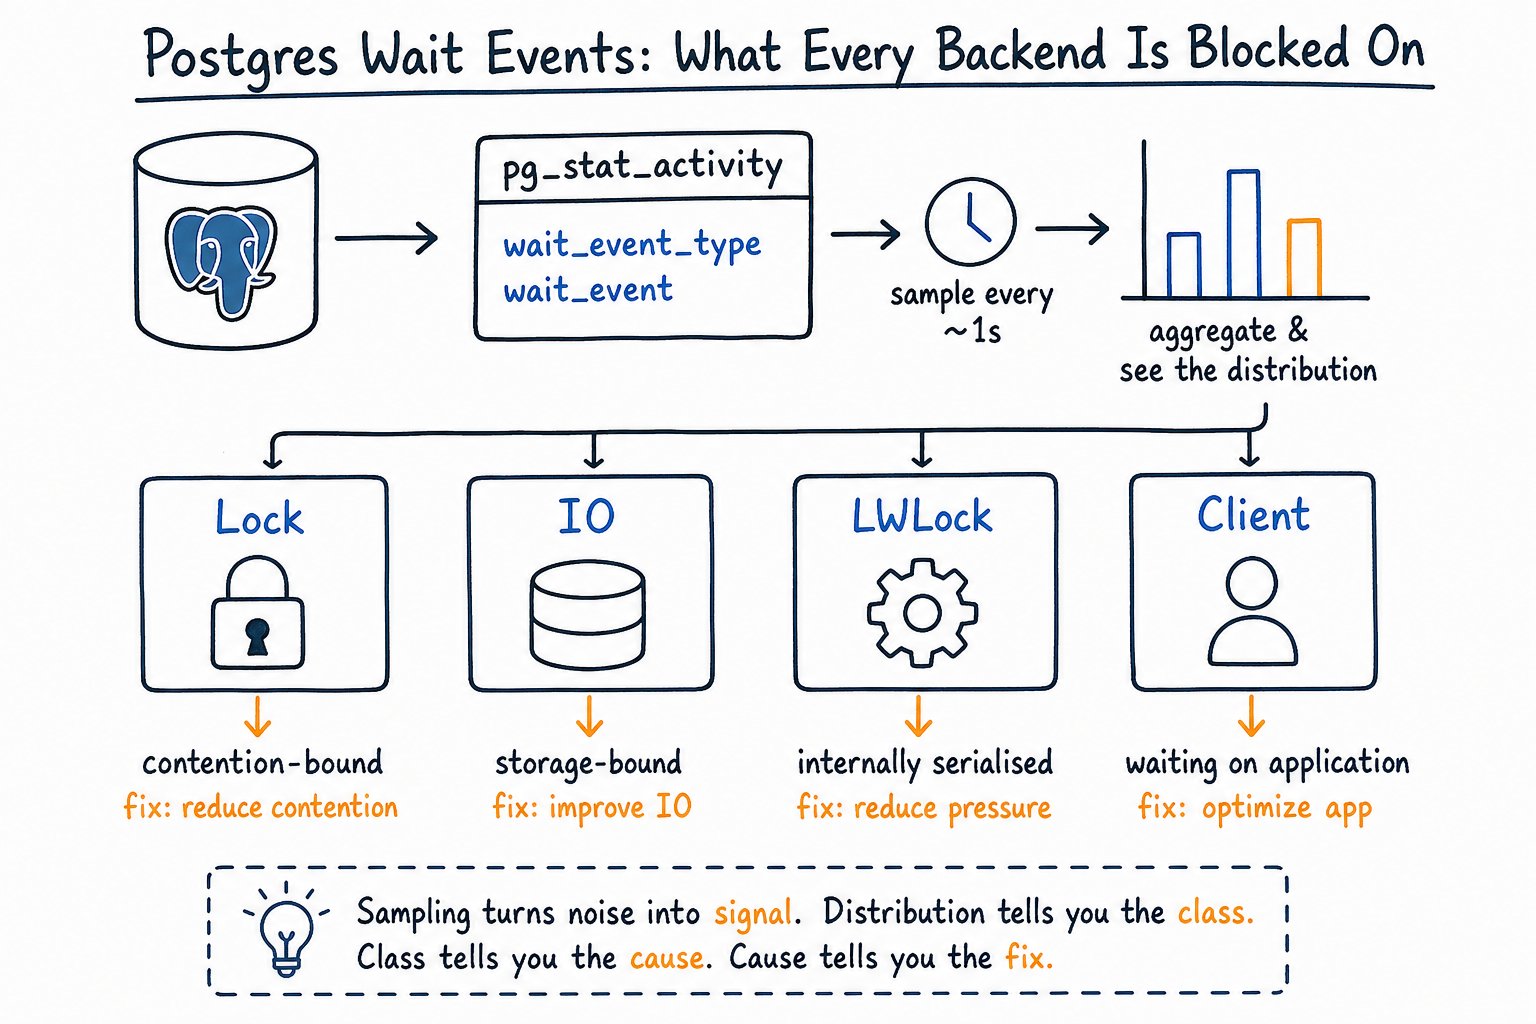
I asked for one thing before anyone touched infrastructure again: sixty seconds of pg_stat_activity samples during the bad window. The distribution came back with 61% of samples in Lock / transactionid. That is not storage. That is one transaction sitting on a row while everyone else queues behind it, and it turned out to be a retry loop in the payment service that opened a transaction, called an external API with a 30-second timeout, and then committed. The database was doing exactly what it was told. The fix was four lines of application code.
There's a five-minute version of this on our YouTube channel if you just want the shape of the technique. This article is the longer reference, with the queries you can paste into psql at 02:40 when you're the one holding the pager.
The first useful question during a slowdown is not "why is this query slow." It's "what is this backend blocked on." Postgres answers that question directly, and has since 9.6.
The two columns that matter
pg_stat_activity exposes wait_event_type and wait_event. The first is the category (Lock, IO, LWLock, and so on). The second is the specific event inside it (transactionid, DataFileRead, WALInsert). Both are NULL when the backend isn't waiting on a tracked event.
Before 9.6 you got a boolean called waiting, which told you the backend was stuck on a heavyweight lock and nothing else. Every IO stall, every internal latch, every idle client looked identical: waiting = false. The 9.6 split is the single most useful monitoring change Postgres has shipped for day-to-day triage.
Two things to internalise before you start reading the output.
NULL does not mean CPU. It means no tracked wait is in progress. Not every code path is instrumented, so a backend with state = 'active' and a NULL wait event is probably burning CPU, and it's the closest proxy we have, but treating it as a measured CPU metric will eventually embarrass you. This matters more than it sounds, because several commercial dashboards derive a "CPU" bucket from exactly this NULL and present it with the same confidence as the measured buckets. If you're on RDS, Performance Insights' "CPU" wait bucket is built the same way — inferred from the absence of a tracked wait, not independently measured. Know that before you trust it to the second decimal.
pg_stat_activity has no memory. It reports the instantaneous state of each backend at the moment you ran the query. There is no history, no cumulative counter, no duration. One SELECT against it is a photograph of a football match: technically accurate, diagnostically worthless. Everything useful comes from repeated sampling.
Here's the snapshot query I run first, every time:
SELECT pid, state, wait_event_type, wait_event,
       now() - query_start AS dur,
       left(query, 80)
FROM pg_stat_activity
WHERE backend_type = 'client backend'
  AND pid <> pg_backend_pid()
ORDER BY dur DESC;
The backend_type filter drops the checkpointer, the WAL writer, and the autovacuum launcher, which are almost always idling in their main loops and will otherwise be the first thing your eye lands on.
The seven categories, and what each one accuses
| wait_event_type | What it means | Who to blame | Normally actionable? | |---|---|---|---| | Lock | Waiting on a heavyweight lock, the same ones in pg_locks (relation, transactionid, tuple) | Your application's transaction shape, or DDL | Yes, almost always | | LWLock | Waiting on a short internal latch inside Postgres | Postgres internals under your workload | Yes, but the fix is usually workload shape | | IO | Reading or writing data files, WAL, or temp files | Storage, cache sizing, or query plans | Yes | | IPC | Coordination between processes: parallel workers, logical replication | Query parallelism or replication topology | Sometimes | | Client | Waiting on the client to send or receive data | Your app, your pooler, your network | Yes, but not in the database | | BufferPin | Waiting for exclusive access to a buffer another backend has pinned | Rare, usually vacuum vs. long-running scan | Rarely | | Timeout | Deliberate sleeps (vacuum delay, etc.) | Nobody, mostly | No | | Activity | A background process idling in its main loop | Nobody | No, exclude it | | Extension | A wait inside a third-party extension | Whoever wrote the extension | Depends |
The two that will ruin your aggregates if you let them: Activity and Client. Activity events like WalWriterMain, CheckpointerMain, and AutoVacuumMain are background workers sitting in their main loops waiting for work. They are always waiting. On an idle database they are 100% of your samples. Exclude them from every aggregate, without exception.
Client is subtler, because Client / ClientRead is a real signal, just not a signal about the database. It means the backend is waiting to receive the next command from the client. High ClientRead means your application is holding connections open while doing something else. Keep it in the aggregate if you're diagnosing a "the database is slow" complaint (it's often the answer), but understand it's a finding about your app, not your storage.
Sampling: the technique that makes wait events usable
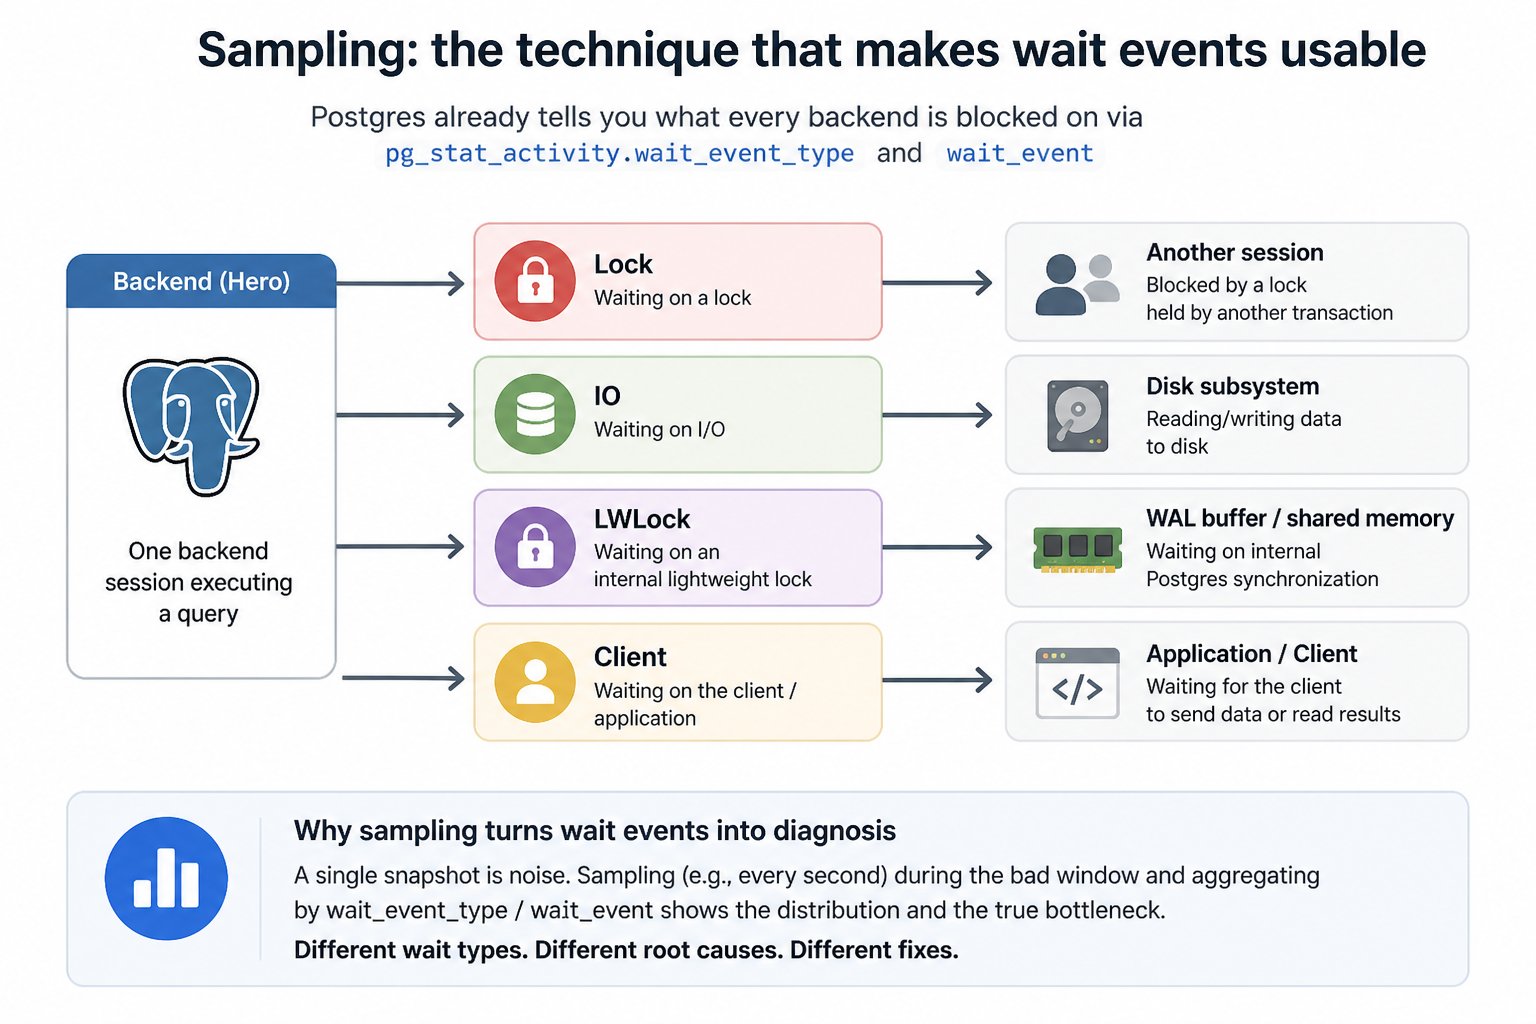
The quick look, when you're already in psql and something is on fire:
SELECT wait_event_type, wait_event, count(*)
FROM pg_stat_activity
WHERE backend_type = 'client backend'
  AND state = 'active'
GROUP BY 1, 2
ORDER BY 3 DESC \watch 1
\watch 1 reruns it every second and you eyeball the pattern for a minute. It's crude, it's not aggregated across time, and it's genuinely useful.
For anything you want to reason about afterwards, land the samples in a table.
CREATE TABLE wait_samples (
  sampled_at   timestamptz NOT NULL DEFAULT clock_timestamp(),
  pid          int,
  state        text,
  wait_event_type text,
  wait_event   text,
  query_start  timestamptz,
  query        text
);
CREATE INDEX ON wait_samples (sampled_at);
The sampler itself is one statement:
INSERT INTO wait_samples (pid, state, wait_event_type, wait_event, query_start, query)
SELECT pid, state, wait_event_type, wait_event, query_start, left(query, 200)
FROM pg_stat_activity
WHERE backend_type = 'client backend'
  AND pid <> pg_backend_pid()
  AND state <> 'idle';
Run it every second for the duration of the bad window. pg_cron with a * job that loops sixty times works. So does a shell loop with psql -c and sleep 1. I don't care which; I care that you have 60 to 300 samples covering the incident rather than one.
Then the aggregation, which is the query that actually answers the question:
SELECT
  coalesce(wait_event_type, 'CPU/none') AS wait_event_type,
  coalesce(wait_event, '-')             AS wait_event,
  count(*)                              AS samples,
  round(100.0 * count(*) / sum(count(*)) OVER (), 1) AS pct
FROM wait_samples
WHERE sampled_at BETWEEN '2026-08-05 02:38' AND '2026-08-05 02:45'
  AND wait_event_type IS DISTINCT FROM 'Activity'
GROUP BY 1, 2
ORDER BY samples DESC
LIMIT 20;
One second is the right interval for almost everyone. At 1Hz across a five-minute window you have 300 samples per active backend, which is plenty of resolution to separate 60% from 15%. Going to 100ms multiplies your sampling overhead by ten and, on a box with 400 connections, the sampler itself starts showing up in the results. That's not a metaphor. I've seen a 50ms sampler contribute measurably to LWLock contention on the very system it was meant to observe.
If you want this permanently rather than during incidents, use pg_wait_sampling. It collects samples in a background worker and exposes both a history view and a cumulative profile, which is the same idea done properly and cheaply. Pair it with pg_stat_statements so you can join a wait profile to a queryid.
Reading the distribution: four real shapes
Shape 1: contention.
| type | event | samples | pct | |---|---|---|---| | Lock | transactionid | 184 | 61.3 | | Lock | tuple | 31 | 10.3 | | CPU/none | - | 44 | 14.7 |
Row-level conflict. Many sessions updating the same rows, waiting for whoever holds them to commit. Go to pg_blocking_pids().
Shape 2: storage or plan.
| type | event | samples | pct | |---|---|---|---| | IO | DataFileRead | 141 | 47.0 | | CPU/none | - | 96 | 32.0 | | IO | BufFileWrite | 22 | 7.3 |
Pages not in shared_buffers. Could be a cold cache after a restart, could be a sequential scan on a table that grew past a missing index. Cross-check pg_stat_statements.shared_blks_read and pg_statio_user_tables.heap_blks_read. The BufFileWrite on the side is a separate accusation: something is spilling to temp files and work_mem is too small for it.
Shape 3: commit-bound.
| type | event | samples | pct | |---|---|---|---| | LWLock | WALInsert | 88 | 29.3 | | IO | WALSync | 71 | 23.7 | | IO | WALWrite | 40 | 13.3 |
Your write throughput ceiling is WAL. Look at commit rate first (thousands of tiny autocommit transactions is the usual cause), then at whether synchronous_commit needs to be on for every transaction on this system, then at what device WAL lives on.
Shape 4: not the database.
| type | event | samples | pct | |---|---|---|---| | Client | ClientRead | 233 | 77.7 | | CPU/none | - | 51 | 17.0 |
Postgres is idle, holding connections while the application thinks. Go look at your pooler config and your ORM's transaction boundaries. Upgrading the instance here does nothing, and this is exactly the shape behind most "we resized and nothing improved" stories.
Lock waits: find the blocker, not the victim
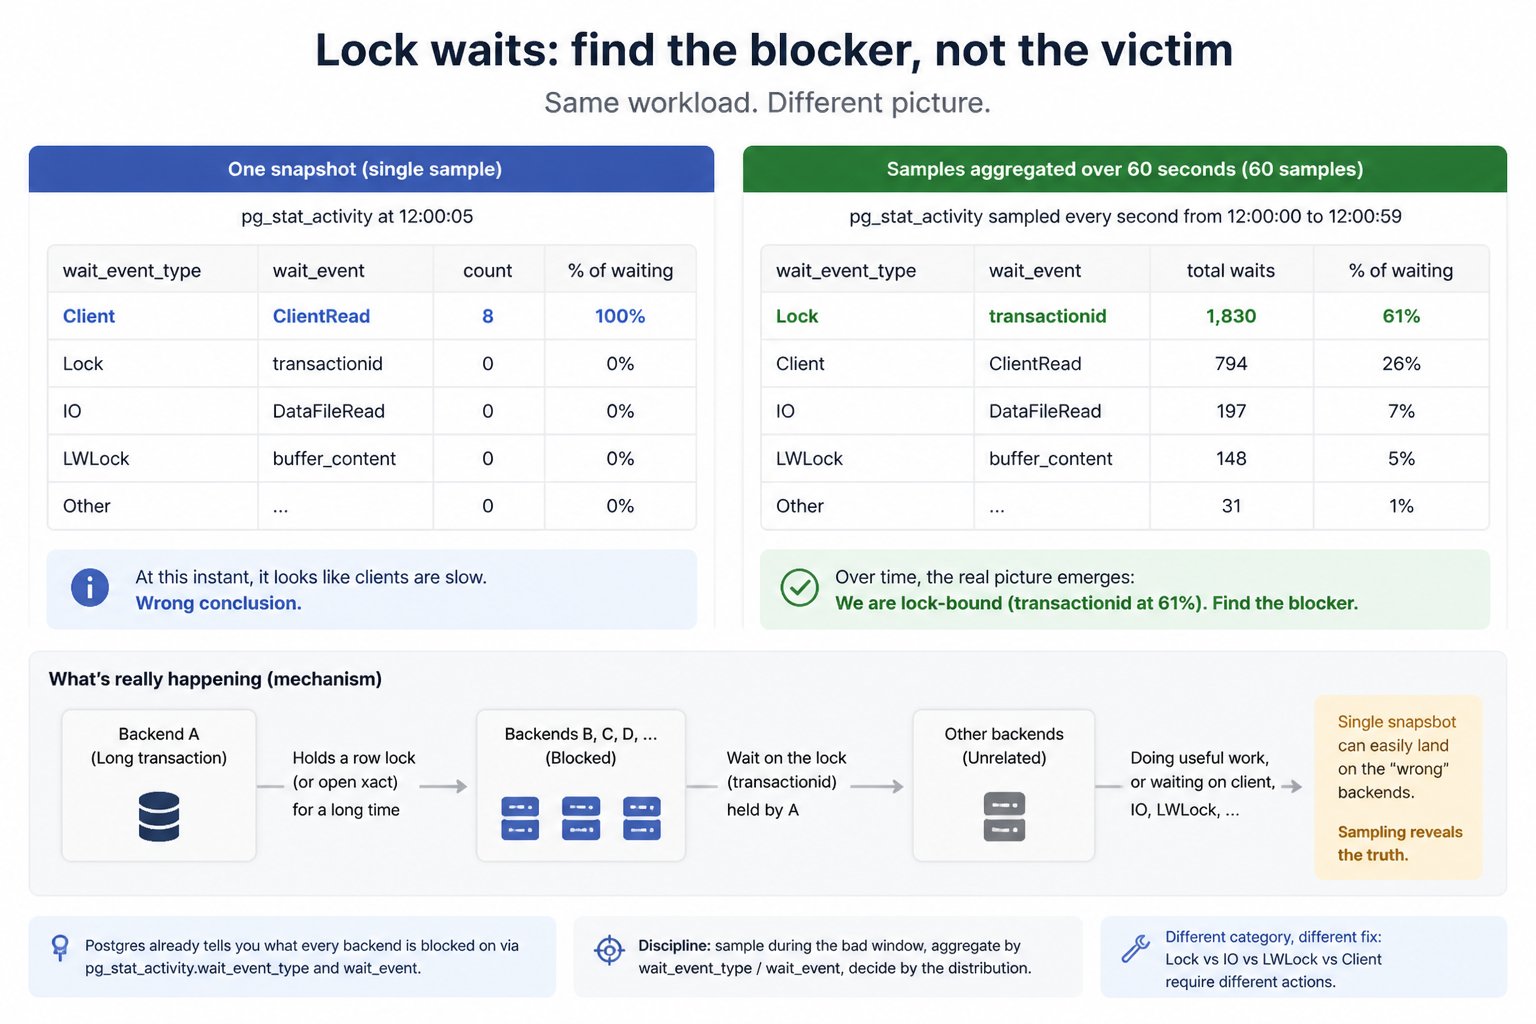
Everyone's monitoring shows the victims, because victims are slow and slow things page you. The blocker is often fast, often idle, and invisible unless you go looking.
SELECT
  blocked.pid                AS blocked_pid,
  blocked.wait_event_type,
  blocked.wait_event,
  left(blocked.query, 60)    AS blocked_query,
  blocker.pid                AS blocker_pid,
  blocker.state              AS blocker_state,
  now() - blocker.xact_start AS blocker_xact_age,
  left(blocker.query, 60)    AS blocker_query
FROM pg_stat_activity AS blocked
CROSS JOIN LATERAL unnest(pg_blocking_pids(blocked.pid)) AS bpid
JOIN pg_stat_activity AS blocker ON blocker.pid = bpid
WHERE cardinality(pg_blocking_pids(blocked.pid)) > 0
ORDER BY blocker_xact_age DESC;
pg_blocking_pids() is the supported way to resolve this. Don't hand-roll a self-join on pg_locks; people have been getting that subtly wrong for a decade.
The column that solves the case most often is blocker_state. When it reads idle in transaction with an xact_start age of eleven minutes, you're done investigating the database. That session still holds every lock it acquired, and it will hold them until it commits or someone kills it. It is the single most common cause of a lock pileup.
Two event names worth distinguishing:
Lock / transactionid is a row-level conflict. Backend A wants a row that transaction B has modified, so A waits on B's xid until B commits or rolls back. Normal under contention, pathological when B is slow.
Lock / relation is table-level. Something is holding a lock mode that conflicts with what you want. In practice this is DDL: an ALTER TABLE that needs ACCESS EXCLUSIVE, a VACUUM FULL, a CREATE INDEX without CONCURRENTLY. And the failure mode is nastier than it looks, because Postgres grants locks in request order: once that ACCESS EXCLUSIVE request is queued, every subsequent query on the table queues up behind it too, including plain SELECTs that would have been perfectly compatible with the running query. One long analytics query plus one ALTER TABLE equals a fully stalled table.
Prevention, in order of how much I nag people about it:
lock_timeoutbefore every piece of DDL.SET lock_timeout = '3s';means your migration fails fast instead of building a queue behind it. This is not optional for online DDL.log_lock_waits = on, which logs any session waiting longer thandeadlock_timeout(default 1s) for a lock, along with what it's waiting for. Free forensics.
LWLock waits: when Postgres contends with itself
LWLocks are internal latches held for microseconds. That's the whole point of them. Which means if a one-second sampler catches one repeatedly, the contention is real and sustained, not bad luck.
LWLock / WALInsert is contention inserting records into the WAL buffers, and it's the classic write-throughput ceiling. More concurrency will not help; fewer, larger transactions might.
LWLock / BufferMapping is contention on the buffer lookup table, which shows up when a lot of backends are churning through buffers at once. Usually a scan problem or an undersized shared_buffers forcing constant eviction.
LWLock / LockManager is the one people misdiagnose most. Each backend has a limited number of fast-path locking slots; once a query needs locks on more relations than fit, it falls back to the shared lock manager and contends there. The trigger is queries touching many relations at once: a heavily partitioned table where the planner can't prune, or a table carrying fourteen indexes. Reduce the number of relations per query and it goes away.
BufferPin waits mean a backend wants exclusive access to a buffer somebody else has pinned, typically vacuum against a long-running scan. SubtransSLRU and MultiXactOffsetSLRU point at subtransaction abuse (savepoints in a loop, or exception blocks inside PL/pgSQL loops) and heavy SELECT ... FOR SHARE patterns respectively.
Be honest with yourself here: most LWLock findings are not fixed by a postgresql.conf change. They're fixed by changing what the workload asks for.
IO waits: which read is hurting you
IO / DataFileRead is a page that wasn't in shared_buffers. Read that sentence again before you conclude anything about your disks, because here's the caveat that trips up nearly everyone: the read may well have been served from the operating system page cache in microseconds. DataFileRead is not proof of physical storage I/O. It is proof of a shared_buffers miss. This is the single most common misreading in the whole practice: teams treat DataFileRead samples as proof of physical disk pressure and go shopping for faster storage, when the real fix was an index that would have avoided reading the page at all.
To get from "miss" to "how much time did that cost," you need timing:
track_io_timing = on, which letspg_stat_statementsandEXPLAIN (ANALYZE, BUFFERS)report actual block read and write times.- On PG 16+,
pg_stat_iogives cumulative I/O counts broken down by backend type and context. Cumulative counters and instantaneous wait sampling answer different questions; use both.
IO / WALWrite and IO / WALSync concentrate at commit and mean you're bounded by WAL write and fsync latency. IO / DataFileWrite in volume usually means checkpoints or backend-driven eviction.
BufFileRead and BufFileWrite are temp file I/O: a sort or hash exceeded work_mem and spilled to disk. That's a work_mem conversation, or a plan conversation, and it is one of the highest-yield findings you can get out of a wait profile.
The traps that make wait-event analysis lie
Sampling has no duration weighting. A single backend blocked for 30 minutes and 30 backends blocked for one second each produce identical sample counts. Sample counts are your proxy for time; treat them as "backend-seconds spent waiting," not "number of incidents."
Wait events don't attribute CPU, and NULL isn't a CPU measurement. Say "not waiting" out loud instead of "on CPU" and you'll make fewer bad calls.
pg_stat_activity shows one row per backend, including parallel workers. A single parallel query with four workers contributes five rows, which can inflate a category. Filter on backend_type = 'client backend' when you want user sessions only.
And Activity rows will swamp any aggregate you forget to filter. Every time.
Config card: minimum observability
shared_preload_libraries = 'pg_stat_statements'   # and pg_wait_sampling if you have it
track_io_timing = on
log_lock_waits = on
deadlock_timeout = 1s          # also the log_lock_waits threshold
log_min_duration_statement = 1000ms
Five settings. If a production Postgres doesn't have these, you're diagnosing incidents with less information than the database was willing to give you for free.
Making it continuous instead of forensic
All of the above works beautifully if you're awake and logged in while the incident is happening. The problem is that most incidents are reported the next morning, in the past tense, by someone who wants to know what happened at 02:40. By then pg_stat_activity has moved on, and hand-rolled sampling is only useful if you started it before the thing you wanted to observe. That's the case for running a sampler on a schedule with retention, or for MyDBA's free health check, which samples wait events continuously and ranks top queries by wait event, so the evidence already exists when the question gets asked. Either approach solves the same problem: you cannot sample retroactively.
A 10-minute triage runbook
1. Snapshot. Run the pg_stat_activity query from the top of this article. Note the longest-running active backends and their wait events. 2. Sample. Create wait_samples if it doesn't exist. Run the sampler INSERT every second for 60 seconds. 3. Aggregate. Run the GROUP BY with the percent column. Exclude Activity. Look at the top three rows only. 4. Branch on the dominant category:
Lock→ run thepg_blocking_pids()query. Checkblocker_stateforidle in transactionandblocker_xact_age.IO/DataFileRead→pg_stat_statementsordered byshared_blks_read, plusEXPLAIN (ANALYZE, BUFFERS)on the top offender. Don't conclude "disk" without timing data.IO/BufFile*→ find the spilling query, look atwork_memand the plan.LWLock→ identify the specific event.WALInsertmeans commit rate;LockManagermeans relations per query;BufferMappingmeans scan volume orshared_buffers.Client/ClientRead→ leave the database alone and go read the pooler and application transaction boundaries.- Mostly NULL → you're CPU-bound (probably). Now it's a plan and query-cost problem.
5. Act on exactly one thing. Then re-sample for another 60 seconds and confirm the distribution moved.
Fix the top wait. Re-sample. Repeat. The distribution will tell you when you're done, and it will tell you long before your monitoring dashboard does.