The PostgreSQL health check checklist: 135 checks in 16 domains
A PostgreSQL health check reads the server's own catalogs and statistics views and scores eight areas: configuration, vacuum and bloat, indexes, schema, security and access, backup and WAL, capacity, and version currency. Each area has a small number of questions with objective answers. The hard part is not the queries — it is running them repeatedly and keeping the answers.
Key facts
Everything below is read from the server itself. No agent-only data, no vendor magic — these are the ten catalogs and views that a health check actually queries.
| Catalog or view | What it reveals | |---|---| | pg_settings | Every GUC with its current value, source (file, default, override) and whether a restart is pending — the difference between what the config file says and what the server is running | | pg_stat_user_tables | n_dead_tup, n_live_tup, last_autovacuum, last_autoanalyze, seq_scan — the raw material for every vacuum and bloat finding | | pg_stat_database | Cache hit counters, xact_commit/xact_rollback, deadlocks, temp_files, temp_bytes — all cumulative since the last stats reset, so only deltas are meaningful | | pg_stat_all_indexes | idx_scan per index — the only honest answer to "is this index ever used", and reset to zero by a stats reset or a restore | | pg_class | relpages, reltuples, relfrozenxid, relallvisible — object sizes, planner estimates and the freeze horizon per relation | | pg_replication_slots | Inactive slots holding WAL and pinning the vacuum horizon; the single most common cause of a disk that fills overnight | | pg_stat_archiver | archived_count, failed_count, last_failed_time — whether continuous archiving is actually working, as opposed to configured | | pg_hba_file_rules | The parsed authentication rules as the server sees them, including any line with a parse error — readable without shell access to the host | | pg_roles | Every role with rolsuper, rolcanlogin, rolvaliduntil and rolbypassrls; the password hash is blanked, so no elevated privilege is needed to audit it | | pg_stat_statements | Normalised query text with call counts and total time — an extension, not core, and absent by default |
Two properties of that list shape everything else. First, most of these views are cumulative counters, not gauges: pg_stat_database.temp_files is the count since the statistics were last reset, which may be a year ago or may be last Tuesday. A single reading tells you almost nothing. Second, several of them are per-database: pg_stat_user_tables shows the database you are connected to and nothing else, so a check that connects only to postgres sees an empty cluster.
What a health check covers
Configuration
Configuration is where most checklists start, and where most of them go wrong by comparing values against a table of "recommended" numbers. A more useful question is: does the symptom this setting causes match what the instance is showing? work_mem is the clearest example — the default is 4MB, it is allocated per sort or hash node rather than per query, and raising it globally multiplies by every concurrent node in every backend. The evidence for raising it is temp-file activity in pg_stat_database, not a rule of thumb.
The settings worth checking group into six families: memory (shared_buffers, work_mem, maintenance_work_mem, effective_cache_size, max_connections), durability and WAL (wal_level, max_wal_size, checkpoint_timeout, checkpoint_completion_target), planner costs (random_page_cost, effective_io_concurrency), autovacuum aggressiveness, observability (log_checkpoints, log_lock_waits, track_io_timing, pg_stat_statements, auto_explain), and safety timeouts (statement_timeout, idle_in_transaction_session_timeout, lock_timeout).
The observability group is the one a health check should be loudest about, because it is cheap, it is reversible, and without it every later investigation starts from nothing. log_checkpoints has defaulted to on since PostgreSQL 15; log_lock_waits still defaults to off, and an instance without it gives you no record of the lock pile-up that caused last week's stall. Checking pg_settings.source matters here too — a value that reads correct but has source = 'default' means nobody set it deliberately, and the next package upgrade may change it.
Read: Which PostgreSQL settings should a configuration audit check?
Vacuum and bloat
Vacuum is the area where a point-in-time reading is most misleading. Autovacuum triggers at autovacuum_vacuum_threshold (50) plus autovacuum_vacuum_scale_factor (0.2) × estimated rows, which means a healthy large table naturally sawtooths between 0% and 20% dead tuples. Catch it at the top of the sawtooth and it looks broken; catch it at the bottom and a genuinely stuck table looks fine. The check that carries information is whether the ratio returns to baseline, which requires more than one reading.
Six questions cover the domain. What is the dead-tuple ratio on the worst tables? Is autovacuum actually running — autovacuum on, workers not permanently saturated, no table with autovacuum_enabled = false set years ago and forgotten? How old is the oldest transaction ID against the 2.1-billion wraparound limit and autovacuum_freeze_max_age (200,000,000 by default)? What about MultiXact age, which has its own separate horizon? What is holding the vacuum horizon back — a long-running transaction, an abandoned replication slot, or a prepared transaction? And are the cost limits so conservative that autovacuum can never catch up on a busy table?
Bloat sits next to this and needs different evidence. Dead tuples are a live counter; bloat is space already lost, and estimating it from pg_class.relpages against expected row width is a statistical estimate, not a measurement. A check should say which it is reporting. The honest ordering is always: online VACUUM first, verify the space is reused, and only reach for VACUUM FULL or pg_repack if the bloat persists after that.
Read: Which six vacuum checks does a PostgreSQL health check need?, Autovacuum tuning and Table bloat and dead tuples
Indexes
Index checks are the ones most likely to produce a long list nobody acts on, so they need care about confidence. pg_stat_all_indexes.idx_scan is authoritative for "this index has been used since the counter was last reset" — and the counter resets on pg_stat_reset(), on a restore into a new cluster, and never survives a major-version dump/restore. An index reported unused after four days of uptime is a question, not a finding. After four months it is a finding.
Four checks earn their place. Unused indexes, weighted by size, because a 40GB index nobody reads costs write throughput on every insert. Duplicate indexes — two indexes with identical or prefix-identical column lists, where one is redundant. Invalid indexes, which are what a failed CREATE INDEX CONCURRENTLY leaves behind: the build takes only a SHARE UPDATE EXCLUSIVE lock, so it can fail without anyone noticing, and the leftover index is not used for queries but is still maintained on every write. And missing indexes on foreign-key columns, which turn a parent-row delete into a sequential scan of the child table.
Unique constraints deserve their own mention because they are the place where the index/constraint distinction stops being academic. A unique constraint is a unique B-tree index plus a catalog entry, but only the constraint form can be referenced by a foreign key, and only the index form can be built concurrently. Adding one the wrong way takes ACCESS EXCLUSIVE for the whole build.
Read: Index usage and optimization and How do you add a unique constraint in PostgreSQL?
Schema
Schema checks are the least mechanical part of a health check, because most schema decisions are legitimately application-specific. A small number are not. A table with no primary key cannot be replicated logically without a REPLICA IDENTITY FULL fallback that turns every update into a full-row comparison on the subscriber. A NOT VALID check constraint that was never validated is enforced for new rows only, so the guarantee everyone assumes exists does not. A foreign key with no index on the referencing column is an index problem wearing a schema costume.
Column types are the other reliable category. timestamp without time zone is the classic: both types occupy 8 bytes and both support microsecond resolution, but only timestamptz stores an unambiguous instant. The plain type stores whatever wall-clock reading was handed to it, which is fine until the two people reading the row are in different offices or the clocks move in October. Converting later is expensive — ALTER TABLE ... ALTER COLUMN ... TYPE rewrites the table under ACCESS EXCLUSIVE — which is exactly why a health check should raise it while the table is still small.
What a schema check should not do is grade your normalisation. The findings that belong here are the ones with a mechanical consequence you can point at.
Read: Should you store timestamps with or without a time zone? and Postgres schema mistakes
Security and access
Three surfaces: who can connect, how they authenticate, and what they can do once in. All three are readable over an ordinary connection, which means a security review does not need shell access to the host.
Authentication first. pg_hba_file_rules shows the parsed rules in order, and the rule that matters is that the first matching line wins with no fall-through — a trust line above a scram-sha-256 line makes the second one decorative. password_encryption has defaulted to scram-sha-256 since PostgreSQL 14, but changing the setting does not rehash existing passwords; roles keep their md5 hash until each password is set again. And ssl still defaults to off on a self-managed server, so TLS is opt-in.
Then roles. Count the roles with both rolsuper and rolcanlogin — superuser is not the problem, superuser with a login and an application using it is. Check rolvaliduntil on service accounts, rolbypassrls on anything if you rely on row-level security, and CREATE on schema public, which has been revoked from PUBLIC by default since PostgreSQL 15 but is inherited as-was by any cluster upgraded from 14 or earlier.
Read: What should a PostgreSQL security checklist cover? and How do you list users and roles in PostgreSQL?
Backup and WAL
The only backup check that means anything is a restore. Everything else is a proxy, and a health check should be explicit that it is reporting proxies: archiving is configured, the archiver is not failing, a base backup exists and is younger than your recovery objective, no replication slot is retaining WAL indefinitely.
pg_stat_archiver carries the useful signal. failed_count climbing with last_failed_time recent means archive_command is returning non-zero and WAL is accumulating in pg_wal; because PostgreSQL will not recycle a WAL segment until it has been archived, a broken archive command is a slow-motion disk-full incident with a predictable arrival time. The same is true of an inactive replication slot, which pins WAL by design.
The check most often skipped is scope. pg_dump backs up one database and captures no roles, no tablespace definitions and no other database in the cluster — those come from pg_dumpall --globals-only. A backup regime that has been dumping the application database nightly for three years may still have no copy of the role grants it needs to restore into. And pg_verifybackup exists precisely so that the manifest check happens before the incident rather than during it.
Read: How do I back up a PostgreSQL database? and Point-in-time recovery
Capacity and runway
Capacity is the one domain where a single reading is close to worthless and a trend is close to everything. "Disk is 61% full" is not a finding. "Disk is 61% full and has been growing 0.9 points a week for eleven weeks" is a date.
Three runways are worth projecting: data disk against total growth, pg_wal against generation rate when archiving is degraded, and transaction ID age against the freeze horizon. All three are linear enough over weeks to extrapolate honestly, and all three have the same property — the failure at the end is abrupt rather than gradual. A database at 100% disk stops accepting writes; a cluster that reaches the wraparound limit refuses new transactions entirely.
Connection capacity is the fourth, and it behaves differently. max_connections is not a resource you consume gradually; it is a cliff that a connection-pool misconfiguration reaches in seconds. The check here is the ratio of peak observed connections to the limit, plus how many of those connections are idle in transaction, because those hold the vacuum horizon back as well as a slot in the limit.
Read: Capacity and runway for PostgreSQL
Version currency
Two separate questions hide behind "are we up to date". The major version has a support date: the project supports each major for five years from its initial release, then ships a final minor and stops. The minor version has a cadence: at least one release per quarter, cumulative, with no dump and restore required — a binary swap and a restart.
The reason this belongs in a health check rather than a calendar is that an end-of-life PostgreSQL produces no symptom at all. Major 13 reached its final minor on 2025-11-13 and kept serving queries perfectly on the 14th. Nothing degrades. You discover the problem when a vulnerability is disclosed, fixed in the supported branches, and not fixed in yours — at which point the remedy is a major upgrade executed under time pressure.
Compare server_version_num rather than server_version: it is an integer of the form major × 10000 + minor, so 18.1 is 180001, and integer comparison orders correctly where string comparison cheerfully sorts "9.6" after "18.1".
Read: How do I know if my PostgreSQL version has reached end of life?
Running it yourself
You can build a respectable health check in an afternoon with psql and no other tooling. Query pg_settings for the two dozen GUCs above and dump them with their source column. Query pg_stat_user_tables ordered by n_dead_tup for the worst twenty tables. Query pg_stat_all_indexes for zero-scan indexes joined to pg_relation_size. Read pg_roles, pg_hba_file_rules, pg_replication_slots and pg_stat_archiver. Save the output to a file with a date in the name. That covers a real fraction of what any commercial tool checks, and for a single instance you own, it may be all you need.
Two limitations show up quickly. The first is that a large number of these readings are cumulative counters, and a one-off script has nothing to subtract from. pg_stat_database.temp_files at 4.1 million is meaningless without knowing what it was an hour ago; xact_rollback against xact_commit since an unknown reset date is a ratio over the wrong window. Every rate-shaped check — temp files per hour, deadlocks per hour, rollback ratio, WAL generated per hour — needs at least two readings, and the second reading has to come from a process that ran earlier and stored something.
The second is that the most expensive problems are shaped like trends, not states. Bloat that has been climbing for six weeks looks identical, at any single moment, to bloat that spiked yesterday and is already being reclaimed. A table at 22% dead tuples is normal at the top of the autovacuum sawtooth and alarming if it has not been below 22% in a fortnight. Disk at 61% is a number; disk at 61% with a slope is a date. A one-off script structurally cannot tell these apart, and the reason is not that it is a bad script.
So if you schedule it, decide what it stores. At minimum: the raw counter values with a timestamp, so later runs can compute deltas; the settings snapshot, so you can see when something changed and what it changed from; per-table and per-index rows rather than only the top twenty, because the table that matters next month is not in today's top twenty; and the verdict alongside the value, because thresholds move and you want to know what the check thought at the time. That is a schema, a retention policy, and a cron entry that has to survive its own failures — which is roughly the point at which building it stops being an afternoon.
A last practical note: run the checks against each database in the cluster, not just one. pg_stat_user_tables, pg_stat_all_indexes and pg_class are per-database views. A script that connects once to postgres and reports "no bloat found" is telling the truth about an empty database.
How MyDBA covers this
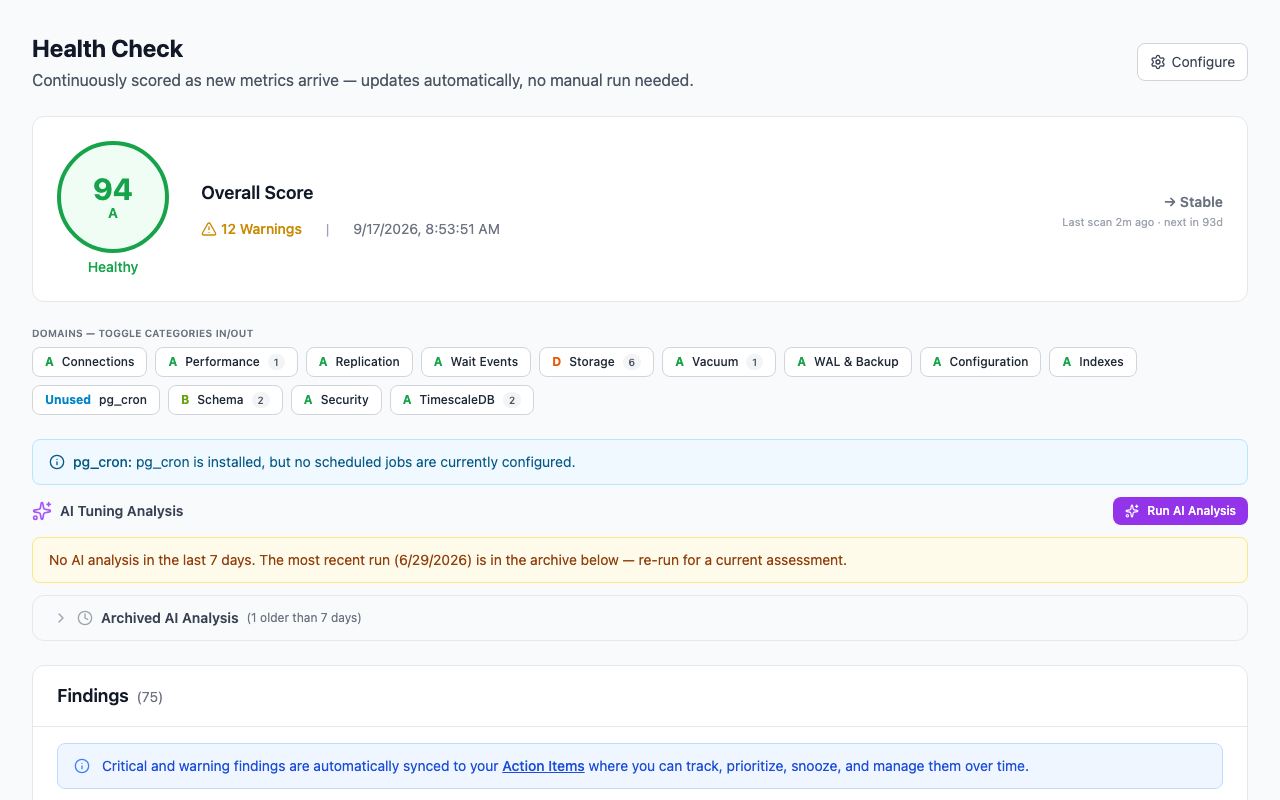
MyDBA runs 135 checks across 16 domains — configuration, connections, indexes, logical_replication, performance, pg_cron, pgvector, postgis, replication, schema, security, storage, timescaledb, vacuum, wait_events and wal_backup. There is no "Run health check" button anywhere in the product, because there is no run: a cron dispatcher fires every minute and re-scores whichever (connection, domain) pairs are due. Each domain sits in a volatility tier — fast at 120 seconds, medium at 900 seconds, slow at 86,400 seconds — so connection saturation is re-scored every two minutes while the index and security domains are re-scored daily. A domain whose collector is offline, or whose data watermark has not advanced since the last run, is recorded as skipped with the reason attached, rather than silently re-reporting an old grade as a fresh one.
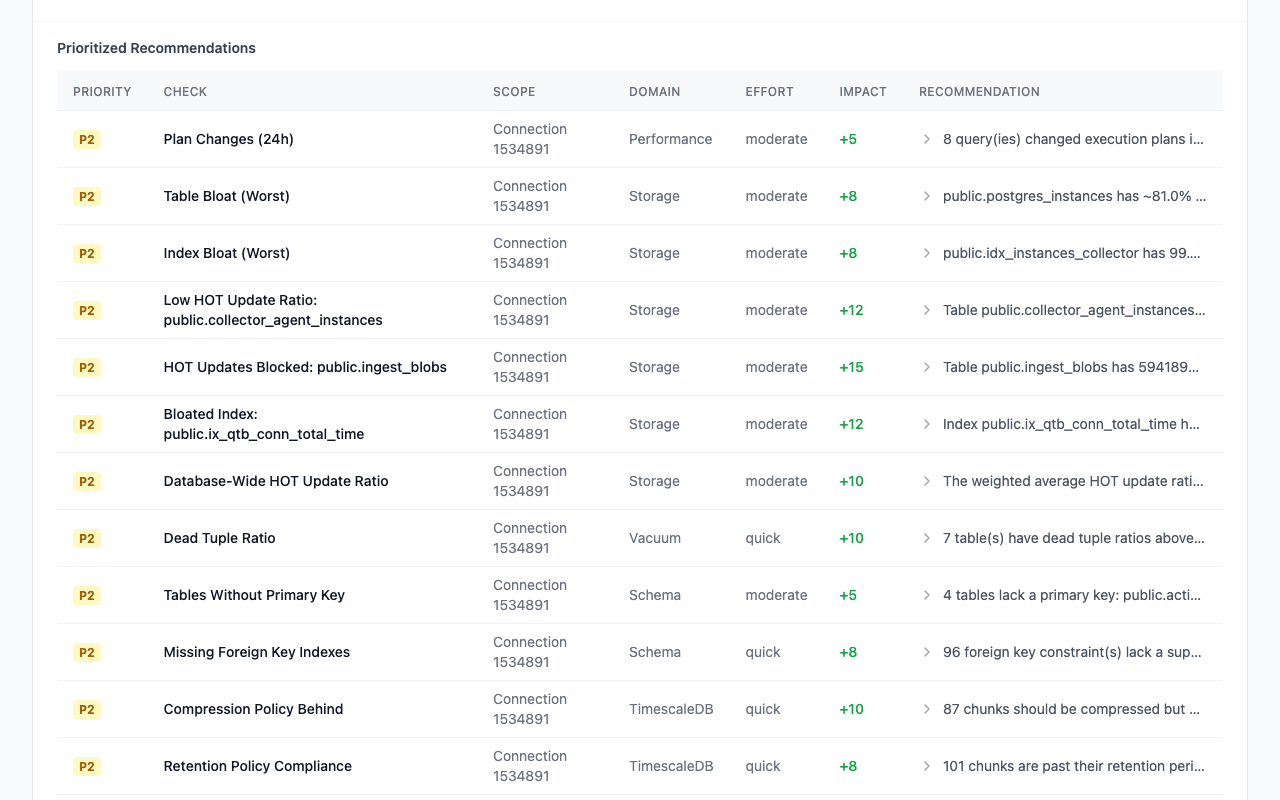
Every check produces a finding with a numeric score, and severity is derived from that score: 90 and above is a pass, 60 to 89 is a warning, below 60 is critical, and a NULL score means no data and renders as informational rather than as a false warning. That last convention matters more than it sounds — a connection that has not yet collected index statistics shows an info finding, not a depressed grade. A per-check ceiling table can lower a severity for advisory checks whose worst real-world outcome is not critical, and it can only lower, never raise. Each finding carries the measured value and the threshold it was scored against, so the verdict is auditable rather than asserted.
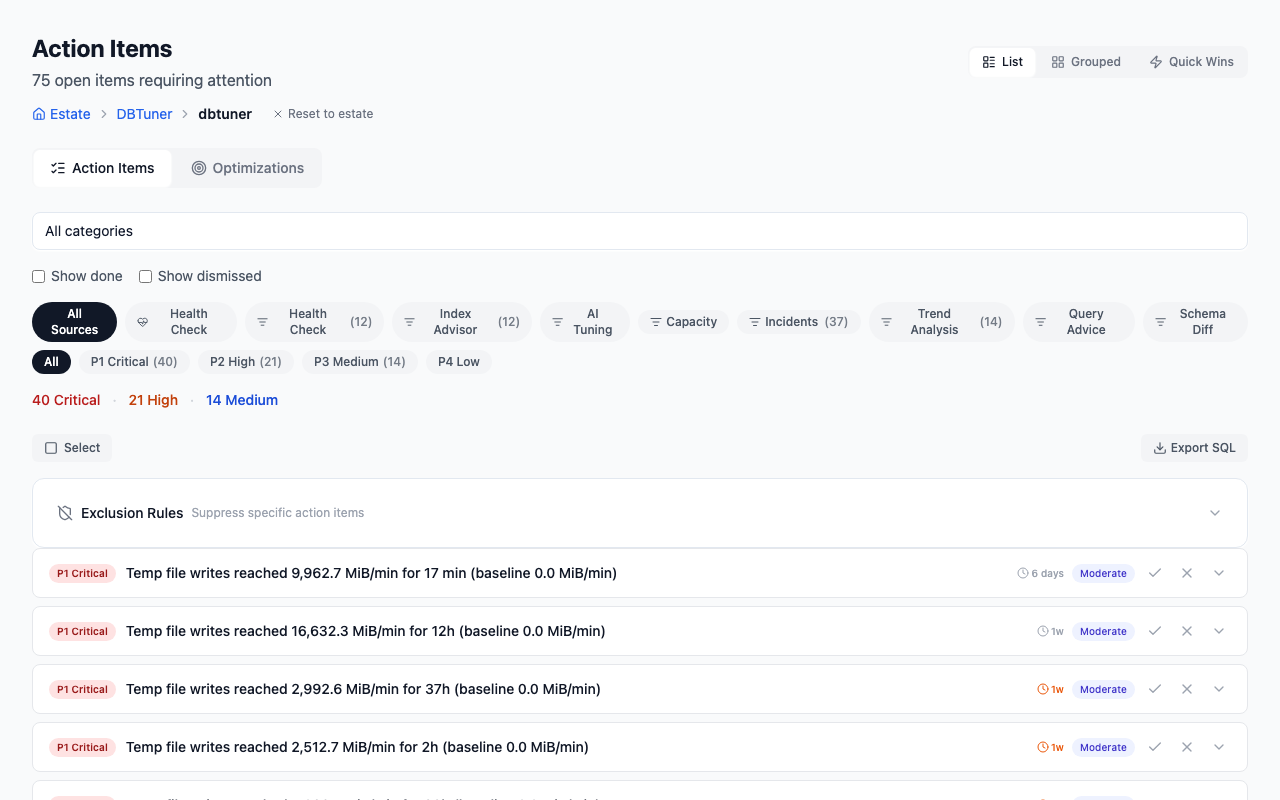
Domain grades roll up to a connection's overall grade as a weighted average that excludes NULL-scored domains, and cluster and instance cards show the worst member's overall grade rather than an average — a cluster is not healthy because two of its three members are. Findings are also assembled into action items: de-duplicated, prioritised, each carrying the recommendation text and, where the fix is expressible as SQL, a parameterised statement. MyDBA shows you what it measured and what it thinks; applying the fix is still yours.
Because the same checks run across every monitored instance, the aggregate is itself informative about which of these checks actually catch things. Counts and percentages only, from seo_aggregate_health_stats on 2026-09-17:
- Across 50 monitored instances, 86.0% have no
auto_explainconfigured (C10_auto_explain). - Across 28 instances scored for schema, 67.9% have at least one foreign key with no index on the referencing column (
G2_missing_fk_index). - Across 31 instances scored for indexes, 67.7% fail the duplicate-index check (
F3_duplicate_indexes), and 58.1% have unused indexes (F1_unused_indexes). - Across 38 instances evaluated for it, 52.6% have
log_lock_waitsoff (A7_log_lock_waits). - Across 50 monitored instances, 26.0% fail the dead-tuple-ratio check (
D2_dead_tuples). - Across 50 monitored instances, 8.0% have more superuser login roles than the check tolerates (
H1_superuser_count).
The ordering there is the interesting part. The checks that fail most often are not the dramatic ones. They are observability settings nobody turned on and index hygiene nobody had a reason to look at — exactly the findings that a one-off health check produces and then nobody revisits.
FAQ
How often should you run a PostgreSQL health check?
More often than most teams do, and at different rates for different things. Configuration, security and schema change rarely; once a day is ample. Vacuum, bloat and performance counters are rate-shaped and need at least two readings close enough together to compute a delta — daily readings will show you last month but will miss a Tuesday afternoon. Connection saturation and replication lag are minutes-scale. A single quarterly audit catches the slow-moving findings in this guide and structurally cannot catch the rest.
Can I run a health check on a replica?
Most of it, yes, and some of it must be. pg_settings, pg_roles, pg_hba_file_rules and pg_class are all readable on a standby. The statistics views are the catch: pg_stat_user_tables and pg_stat_all_indexes are maintained per node, so a replica's idx_scan counters reflect only queries served by that replica. An index that is unused on the primary but heavily used by a read replica will look unused if you only check one side. Replication lag, slot retention and recovery status obviously have to be checked on both.
What does a health check cost in load?
Catalog and statistics reads are cheap — they are in-memory structures, and a full pass over pg_settings, pg_stat_user_tables, pg_stat_all_indexes and pg_roles on a large instance is milliseconds. Three things are not cheap and should be treated separately: pgstatindex() and pgstattuple() read the whole relation, so exact bloat measurement is IO-proportional to object size; pg_buffercache scans the entire shared-buffer pool and takes locks while it does; and any check that runs EXPLAIN (ANALYZE) executes the query. A health check that reads statistics is free in practice. One that measures should tell you it is measuring.
Is there a free PostgreSQL health check?
You can build one, as described above, and for a single instance it is a reasonable use of an afternoon. MyDBA's free tier also runs the full continuously-scored health check — all 16 domains, the same 135 checks, with the dashboard and the action items — on one cluster, one database and one member, with 30 days of retention. The deep-dive features around it (query analysis, EXPLAIN, alerting, incidents, AI) are the paid part; the health check itself is not gated.
What is the difference between a health check and monitoring?
Monitoring answers "what is happening right now" and pages you when a threshold is crossed. A health check answers "what is wrong with how this is set up" and mostly finds things that have been wrong for months without paging anyone: a missing FK index, an auto_explain that was never enabled, a replication slot abandoned after a failover, a major version drifting toward end of life. Neither substitutes for the other. Monitoring finds the incident; a health check finds the conditions that made it likely. The checklist in this guide is deliberately the second kind.
Run the free PostgreSQL health check against your own instance to see which of these apply to you.
Last verified against PostgreSQL 18, 2026-09-17.