PostgreSQL Autovacuum Tuning: A Practical Guide
PostgreSQL Autovacuum Tuning: A Practical Guide
The Problem
Autovacuum is PostgreSQL's background process for reclaiming dead tuples, updating planner statistics, and preventing transaction ID wraparound. It runs automatically, and for many databases the defaults work well enough that you never think about it. The problems start when they do not — and the symptoms are often misdiagnosed.
When autovacuum falls behind, dead tuples accumulate, tables bloat, queries slow down as they scan through dead rows, and XID age creeps upward. DBAs sometimes respond by disabling autovacuum on problematic tables ("it's using too much I/O"), which is like unplugging a smoke detector because it is noisy. The dead tuples do not go away — they pile up faster.
The root cause is usually that the default autovacuum settings are too conservative for the workload. The key defaults:
autovacuum_vacuum_scale_factor = 0.2— trigger vacuum when 20% of rows are deadautovacuum_vacuum_threshold = 50— minimum dead rows before considering vacuumautovacuum_max_workers = 3— maximum parallel vacuum workers
For a table with 10 million rows, the 20% scale factor means autovacuum waits for 2 million dead tuples before triggering. By that point the table has significant bloat, queries are reading millions of dead rows, and the I/O cost of the eventual vacuum is much higher than it would have been with more frequent, smaller vacuums.
The other common problem is worker starvation. With only 3 workers and dozens of tables needing vacuum, workers process tables one at a time. High-churn tables may wait minutes or hours for their turn, accumulating bloat the entire time.
How to Detect It
Start by checking the current autovacuum settings and identifying tables where vacuum is falling behind:
-- Check autovacuum global settings
SELECT name, setting, unit, short_desc
FROM pg_settings
WHERE name LIKE 'autovacuum%'
ORDER BY name;

-- Find tables where dead tuples are accumulating
SELECT
    schemaname,
    relname AS table_name,
    n_dead_tup AS dead_tuples,
    n_live_tup AS live_tuples,
    last_autovacuum,
    last_autoanalyze,
    CASE WHEN n_live_tup > 0
        THEN round(100.0 * n_dead_tup / n_live_tup, 1)
        ELSE 0
    END AS dead_tuple_ratio
FROM pg_stat_user_tables
WHERE n_dead_tup > 500
ORDER BY n_dead_tup DESC
LIMIT 15;
Tables with a high dead_tuple_ratio and a last_autovacuum timestamp that is old (or NULL) are being neglected. Compare ratios across tables: if some tables consistently have much higher ratios than others, they need per-table tuning rather than global setting changes.
Check whether autovacuum workers are saturated:
-- Are all workers busy? If count = autovacuum_max_workers, you need more workers
SELECT count(*) AS active_autovacuum_workers
FROM pg_stat_activity
WHERE query LIKE 'autovacuum:%';

-- What are the workers doing right now?
SELECT pid, query, now() - query_start AS duration
FROM pg_stat_activity
WHERE query LIKE 'autovacuum:%'
ORDER BY query_start;
If you frequently see all 3 workers busy, tables are queuing for vacuum and accumulating bloat while they wait. Check per-table autovacuum overrides too — sometimes a previous DBA set autovacuum_enabled = false on a table and forgot about it:
SELECT relname, reloptions
FROM pg_class
WHERE reloptions IS NOT NULL AND relkind = 'r';
How myDBA.dev Shows It
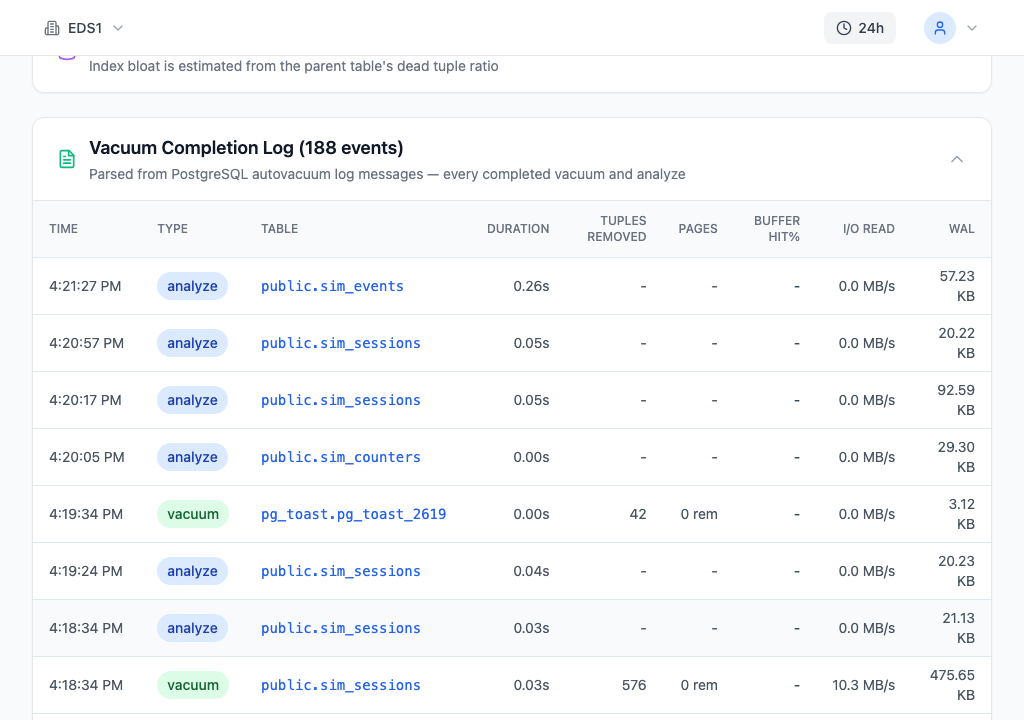
myDBA.dev's Vacuum Completion Log is where the real diagnostic power for autovacuum tuning lies. Every completed autovacuum and autoanalyze operation is logged with its table name, duration, type badge (vacuum or analyze), tuples removed, pages processed, buffer hit ratio, I/O read rate, and WAL bytes written. In this example, 188 events are captured — you can see sim_sessions being analyzed every 40 seconds and vacuumed with 576 tuples removed at 10.3 MB/s I/O.
This level of detail answers questions that pg_stat_user_tables cannot: "How long do vacuums take on this table? Are they getting slower over time? What is the I/O throughput? Is vacuum being throttled?" If vacuum duration is increasing for the same table, bloat is accumulating between runs and you need to trigger vacuum earlier or increase the cost limit.
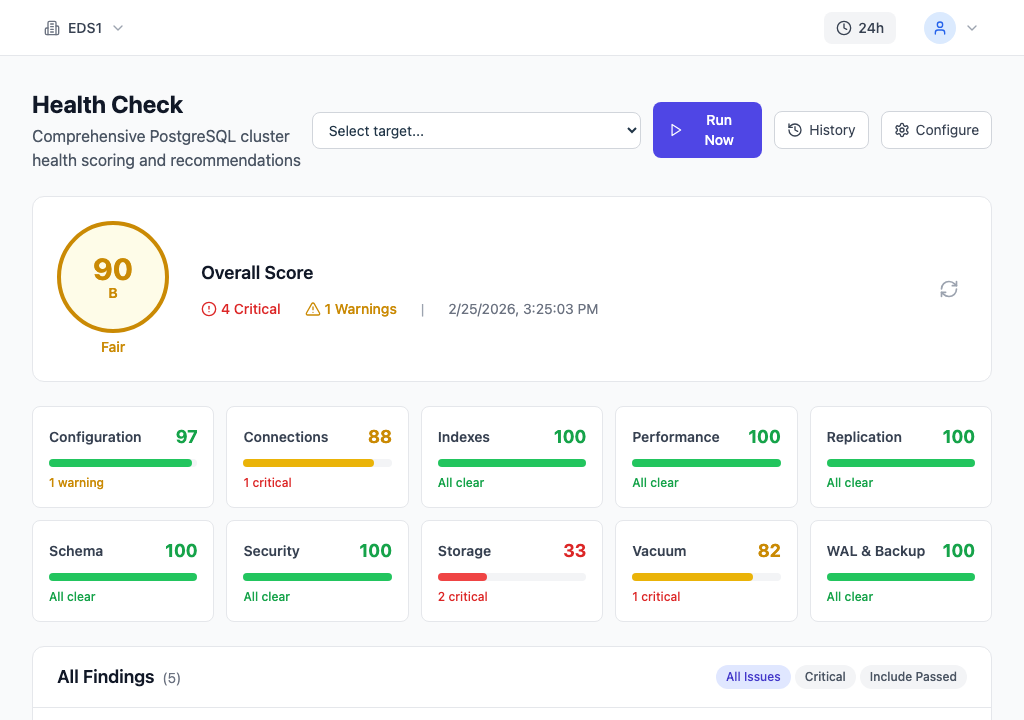
The Health Check provides a complementary view — a scored assessment across 10 domains. The overall score is 90 (grade B), but the domain breakdown reveals where autovacuum is struggling: Storage scores only 33 with 2 critical findings (reflecting active bloat), and Vacuum scores 82 with 1 critical finding (indicating room for improvement). Meanwhile, Indexes, Performance, Schema, Security, and WAL & Backup all score 100 — confirming that autovacuum tuning is the specific area needing attention, not a general system problem.
This domain-level scoring makes autovacuum tuning measurable. After adjusting per-table settings, run a health check again and see whether the Vacuum and Storage scores improve. If Storage climbs from 33 toward 100 and the critical findings clear, your tuning is working.
How to Fix It
Tune autovacuum per table rather than globally. High-churn tables need much more aggressive settings than the defaults:
-- Aggressive autovacuum for a high-update table
ALTER TABLE sim_events SET (
    autovacuum_vacuum_scale_factor = 0.02,    -- trigger at 2% dead (default: 20%)
    autovacuum_vacuum_threshold = 500,         -- minimum dead tuples before vacuum
    autovacuum_vacuum_cost_delay = 2,          -- less throttling (default: 2ms in PG14+)
    autovacuum_vacuum_cost_limit = 1000        -- higher I/O budget per cycle (default: 200)
);

-- Verify the per-table settings were applied
SELECT relname, reloptions
FROM pg_class
WHERE relname = 'sim_events';
The scale_factor is the most impactful setting. Dropping it from 0.2 to 0.02 means vacuum triggers 10x earlier, keeping dead tuples under control before they cause bloat. The cost_delay and cost_limit settings control vacuum's I/O throttling — a higher cost_limit lets vacuum do more work per cycle, finishing faster but using more I/O bandwidth.
If all 3 workers are frequently busy, increase the worker count in postgresql.conf:
autovacuum_max_workers = 5 -- requires restartFive workers is a reasonable starting point for databases with more than 20 actively updated tables. Note that each worker shares the global autovacuum_vacuum_cost_limit by default, so adding more workers without increasing the cost limit may not speed things up. Set the cost limit per table (as shown above) to give each worker an independent I/O budget.
For tables with very high update rates (thousands per second), consider combining aggressive autovacuum settings with fillfactor to enable HOT (Heap-Only Tuple) updates:
ALTER TABLE sim_events SET (fillfactor = 80);With fillfactor = 80, PostgreSQL leaves 20% free space in each page. If an update does not change any indexed columns, PostgreSQL can write the new tuple version in the same page as the old one (a HOT update), avoiding index updates entirely and making the eventual vacuum much cheaper.
How to Prevent It
Establish a per-table tuning strategy based on update frequency. Categorize your tables into tiers:
| Tier | Update Pattern | Scale Factor | Cost Limit | |------|---------------|-------------|------------| | High-churn | Hundreds of updates/second | 0.01 – 0.05 | 1000 | | Medium-churn | Periodic batch updates | 0.10 | Default (200) | | Low-churn | Mostly inserts, rare updates | 0.20 (default) | Default |
Review this categorization after schema changes or workload shifts. A table that was low-churn yesterday may become high-churn after a new feature launch — the autovacuum settings that worked before may suddenly be inadequate.
Monitor autovacuum worker utilization and dead tuple trends continuously. myDBA.dev tracks these metrics over time, making it straightforward to spot tables where vacuum is consistently falling behind. The Vacuum Completion Log provides the data to answer "is vacuum getting slower on this table?" — if vacuum duration is increasing over time for the same table, bloat is accumulating between runs and you need to trigger vacuum earlier.
Build autovacuum monitoring into your deployment checklist: after every major release, check dead tuple trends and vacuum timing to catch newly problematic tables before they impact query performance.