75 Automated Health Checks That Tell You Exactly What to Fix
75 Automated Health Checks That Tell You Exactly What to Fix
The Problem
Most monitoring tools tell you something is wrong without telling you what to do about it. "CPU is at 92%" — caused by a single query doing a sequential scan on a 200-million-row table, or by 500 connections all competing for the same lock? "Disk is filling up" — is it WAL accumulation, table bloat from stalled autovacuum, or a TOAST table growing because of uncompressed JSONB? "Replication lag is 45 seconds" — is the replica under I/O pressure, is a long-running transaction on the primary holding back WAL replay, or did someone accidentally run a DDL statement that blocked replication?
The gap between the alert and the root cause is where hours of debugging live. You connect to the database, run pg_stat_activity, check pg_stat_user_tables, look at replication slots, query pg_stat_bgwriter, examine index usage ratios, verify autovacuum settings, inspect connection pool behavior — each domain requires its own diagnostic queries and its own interpretation. A DBA with 10 years of experience carries this checklist in their head. Everyone else is searching Stack Overflow while the incident clock ticks.
What makes this worse is that many PostgreSQL problems are interconnected. Bloated tables cause slow queries. Slow queries hold locks. Held locks block autovacuum. Blocked autovacuum causes more bloat. You need visibility across all domains simultaneously to see these causal chains.
How to Detect It
You can build your own health check by running diagnostic queries across each domain. Here is a sample from three different areas:
-- Configuration: check shared_buffers sizing
SELECT name, setting, unit,
       pg_size_pretty(setting::bigint * 8192) AS effective_size
FROM pg_settings
WHERE name = 'shared_buffers';

-- Vacuum health: tables with high dead tuple ratios
SELECT schemaname, relname,
       n_dead_tup, n_live_tup,
       round(100.0 * n_dead_tup / NULLIF(n_live_tup, 0), 1) AS dead_pct,
       last_autovacuum
FROM pg_stat_user_tables
WHERE n_dead_tup > 1000
ORDER BY n_dead_tup DESC LIMIT 10;

-- Index usage: find unused indexes wasting space
SELECT schemaname, relname, indexrelname,
       idx_scan, pg_size_pretty(pg_relation_size(indexrelid)) AS index_size
FROM pg_stat_user_indexes
WHERE idx_scan = 0
  AND schemaname NOT IN ('pg_catalog', 'pg_toast')
ORDER BY pg_relation_size(indexrelid) DESC LIMIT 10;

-- Replication: check lag on replicas
SELECT client_addr, state,
       pg_wal_lsn_diff(sent_lsn, replay_lsn) AS replay_lag_bytes,
       pg_size_pretty(pg_wal_lsn_diff(sent_lsn, replay_lsn)) AS replay_lag
FROM pg_stat_replication;
This covers 4 of 12 domains. To approach comprehensive coverage, you need dozens more queries: connection saturation, XID age, checkpoint frequency, lock contention, wait events, security configuration, WAL generation rate, storage growth, extension-specific checks for TimescaleDB or pgvector. Each query requires interpretation — knowing what "bad" looks like for that specific metric. Building and maintaining this yourself is a full-time job.
How myDBA.dev Shows It
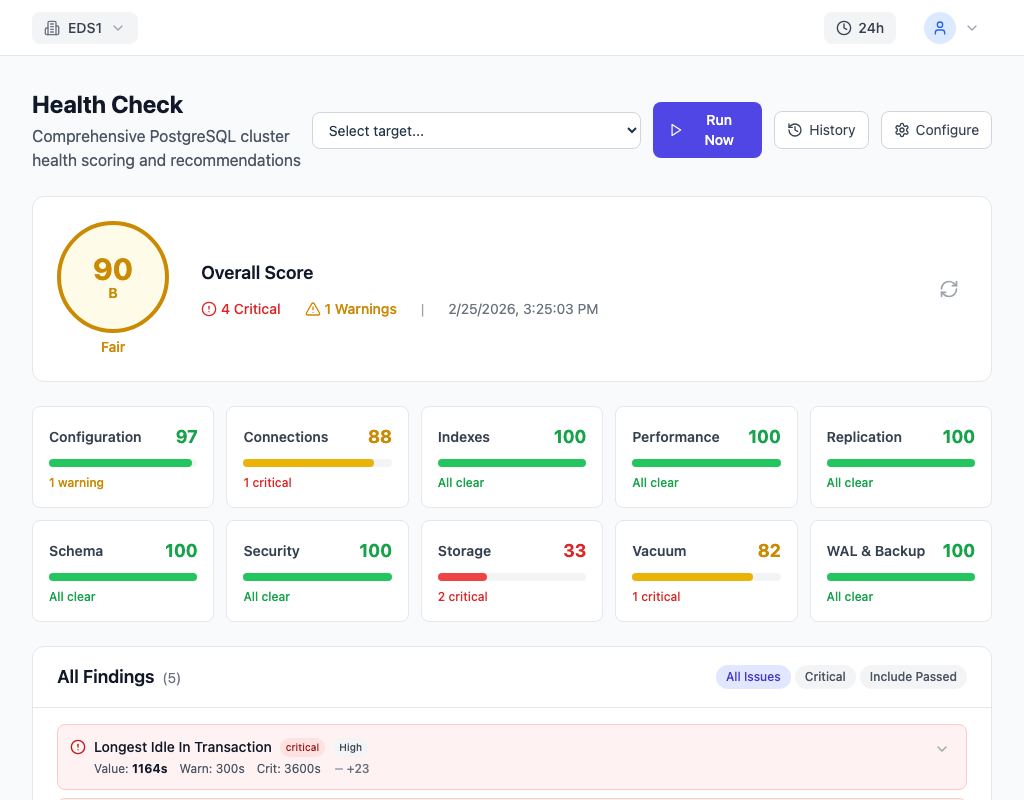
myDBA.dev runs 75+ automated health checks across 12 domains every time you trigger a scan: Configuration, Performance, Vacuum, Replication, Indexes, Security, Storage, Connections, TimescaleDB, XID Wraparound, pgvector, and Wait Events. Each domain receives a score from 0 to 100, and findings are prioritized from P1 (critical — fix now) to P4 (informational). The overview gives you a single screen where you can see that your Vacuum score dropped from 95 to 72 this week, even if everything else is green.
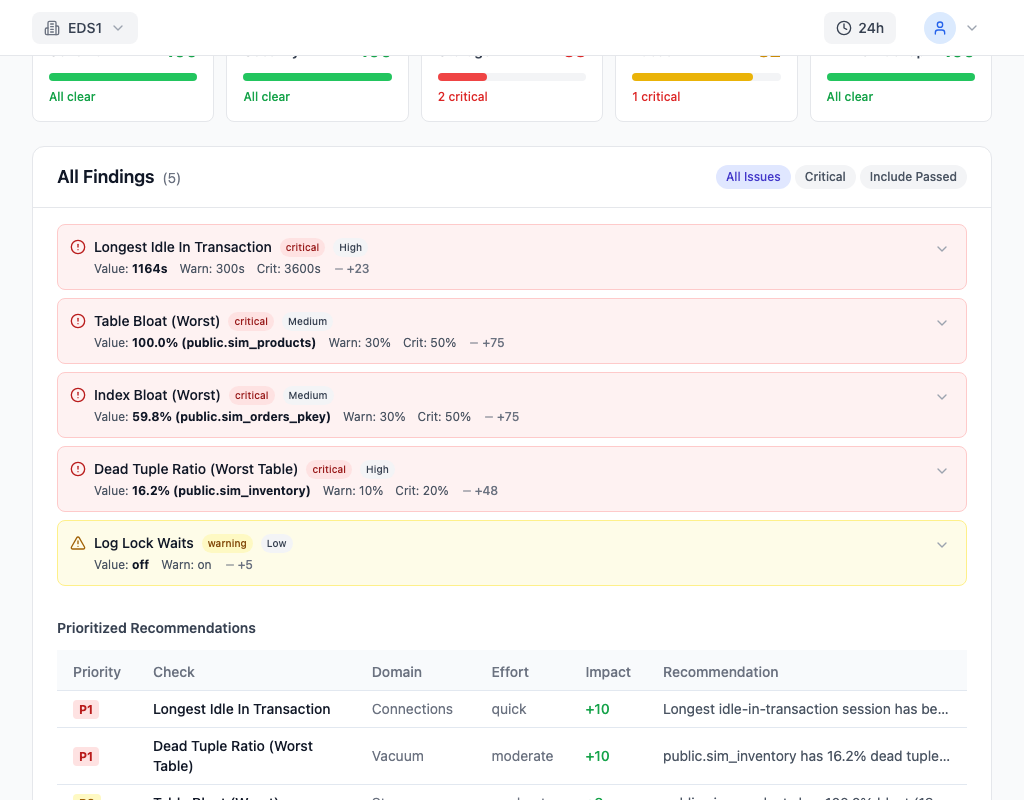
Every finding includes three things: what is wrong, why it matters, and a copy-pasteable SQL command to fix it. A finding like "shared_buffers is set to 128MB on a server with 32GB RAM" does not just flag the problem — it generates ALTER SYSTEM SET shared_buffers = '8GB'; with the calculation based on your actual server memory. A finding about unused indexes does not just list them — it provides DROP INDEX CONCURRENTLY statements you can run immediately. This closes the gap between detection and resolution.
How to Fix It
Walk through three example findings and their generated fixes to see the pattern:
Configuration domain — shared_buffers too low:
-- Finding: shared_buffers = 128MB on a 32GB server (0.4% of RAM, should be ~25%)
ALTER SYSTEM SET shared_buffers = '8GB';
SELECT pg_reload_conf();
-- Note: shared_buffers change requires a restart to take effect
The health check calculates the target value based on your actual RAM, not a generic recommendation. On a 32GB server, 8GB is the standard 25% guideline. On a 64GB server, the generated fix would say 16GB.
Vacuum domain — autovacuum disabled on a table:
-- Finding: autovacuum_enabled = false on orders table (dead tuples: 2.4M)
ALTER TABLE orders RESET (autovacuum_enabled);
-- This re-enables autovacuum with default or per-table settings
Someone disabled autovacuum during a bulk load and forgot to re-enable it. The fix is a single ALTER TABLE statement.
Index domain — duplicate indexes detected:
-- Finding: idx_users_email and idx_users_email_unique both index (email)
-- The unique constraint index already provides the same lookup capability
DROP INDEX CONCURRENTLY idx_users_email;
-- Estimated space savings: 847 MB
Two indexes on the same column serve no purpose. The health check identifies the redundant one and calculates the space you reclaim by dropping it.
How to Prevent It
Run health checks after every major deployment, not just during incidents. Application changes introduce new query patterns that can invalidate existing index strategies, change autovacuum pressure, or shift connection usage patterns. A deployment that adds a new background job running heavy aggregations might tank your Performance score without triggering any alerts until users start complaining.
Track domain scores over time and set thresholds for investigation. If your Vacuum score drops below 80, something changed — either a new high-churn table was created without per-table autovacuum settings, or an existing table's update pattern shifted. myDBA.dev tracks these scores historically, so you can correlate score changes with deployment dates and catch regressions early.
Build health check reviews into your team's operational cadence. A weekly glance at the domain scores and P1/P2 findings keeps small problems from compounding into incidents.