PostgreSQL Performance Tuning: The Complete Configuration Guide
PostgreSQL Performance Tuning: The Complete Practical Guide
The default PostgreSQL configuration is designed to run on a Raspberry Pi. If you are running production workloads on default settings, you are leaving 80% of your hardware's capability on the table.
That is not an exaggeration. A fresh PostgreSQL install allocates 128MB for shared buffers, assumes you have a single spinning hard drive, limits itself to sequential I/O patterns, and caps work memory at 4MB per operation. On a modern server with 64GB of RAM, NVMe storage, and multi-core processors, those defaults are not just conservative -- they are actively preventing PostgreSQL from using the resources you are paying for.
The good news: a handful of configuration changes -- typically 10 to 15 parameters -- can transform performance by 5x to 10x with zero application changes. This guide covers the parameters that matter, the values to use, and how to measure whether your changes actually helped. Every recommendation includes specific numbers tied to your hardware, not vague advice to "increase if needed."
Memory Configuration: The Big Three
Memory tuning delivers the largest performance gains. Three parameters control how PostgreSQL uses RAM, and getting them right matters more than everything else combined.
shared_buffers
This is PostgreSQL's dedicated cache -- the buffer pool where frequently accessed pages are stored in memory. The default is 128MB. On a production server, this wastes most of your RAM.
Starting point: 25% of total RAM.
On a 32GB server, set shared_buffers = 8GB. On a 64GB server, set it to 16GB. Going above 25% rarely helps and can hurt, because PostgreSQL also relies on the operating system's page cache. Setting shared_buffers to 50% of RAM effectively double-caches data -- PostgreSQL caches it, and then the OS caches the same pages again, wasting memory that could serve other purposes.
When to go lower: if you have many databases on the same server, or if your working set is small relative to total RAM, 15-20% may be sufficient.
Verify your hit ratio after changing this:
SELECT
    sum(blks_hit) AS buffer_hits,
    sum(blks_read) AS disk_reads,
    round(
        100.0 * sum(blks_hit) / nullif(sum(blks_hit) + sum(blks_read), 0),
        2
    ) AS cache_hit_ratio_percent
FROM pg_stat_database
WHERE datname = current_database();
A healthy OLTP system should show a cache hit ratio above 99%. Below 95% means PostgreSQL is reading from disk far too often, and increasing shared_buffers (or reducing your working set) is the first fix.
effective_cache_size
This parameter confuses people because it does not allocate anything. It is a hint to the query planner about how much total memory is available for caching, including both shared_buffers and the OS page cache. The planner uses it to decide whether an index scan (which relies on cached pages) is cheaper than a sequential scan.
Set to 50-75% of total RAM.
On a 32GB dedicated database server, set effective_cache_size = 24GB. This tells the planner: "assume that roughly 24GB of data can be served from memory." The planner will favor index scans more aggressively, which is almost always what you want on a server with ample RAM.
Setting this too low makes the planner pessimistic -- it assumes data is not cached and chooses sequential scans when index scans would be faster. Setting it too high has minimal downside; the worst case is that the planner occasionally picks an index scan that requires a disk read.
work_mem
This is the trickiest memory parameter. It controls how much memory is available for each sort operation, hash join, or hash aggregate -- and a single query can use multiple work_mem allocations simultaneously. A complex query with three sorts and two hash joins might consume five times work_mem.
The default is 4MB. For analytical queries that sort millions of rows, this forces PostgreSQL to spill to disk (you will see "Sort Method: external merge" in EXPLAIN output). For simple OLTP queries, even 4MB may be more than needed.
The calculation:
work_mem = (total_ram - shared_buffers) / (max_connections * 2)On a 32GB server with 8GB shared_buffers and 100 connections: (32GB - 8GB) / (100 * 2) = 120MB. That is the theoretical maximum. In practice, most connections are idle, so starting at 32MB-64MB and monitoring for disk sorts is reasonable.
Check whether queries are spilling to disk:
-- Find queries that are performing disk-based sorts
EXPLAIN (ANALYZE, BUFFERS) SELECT ... ORDER BY ...;
-- Look for "Sort Method: external merge Disk:" in the output
Critical warning: Do not set work_mem globally to a large value. If you need 512MB for a single analytical report, set it at the session level:
SET work_mem = '512MB';
-- Run your analytical query
RESET work_mem;
Setting work_mem = 512MB globally on a server with 200 connections risks total memory allocation exceeding physical RAM during peak load.
WAL and Checkpoint Tuning
Write-Ahead Logging (WAL) ensures durability -- every change is written to WAL before it is applied to data files. Checkpoints periodically flush all dirty pages to disk, allowing old WAL segments to be recycled. The default checkpoint settings cause I/O spikes that visibly degrade performance.
The problem with defaults
PostgreSQL's default max_wal_size is 1GB, and checkpoint_completion_target is 0.9 (recently changed from 0.5 in older versions). When a checkpoint triggers, PostgreSQL must write all dirty buffers to disk. With a small max_wal_size, checkpoints happen frequently, and each one generates a burst of I/O that competes with your queries.
Recommended settings:
max_wal_size = 4GB          # Default: 1GB. Reduce checkpoint frequency.
min_wal_size = 1GB          # Keep WAL pre-allocated to avoid repeated allocation
wal_buffers = 64MB          # Default: -1 (auto, ~3% of shared_buffers). 64MB is safe.
checkpoint_completion_target = 0.9  # Spread checkpoint I/O over 90% of the interval
Increasing max_wal_size to 4GB (or even 8GB on write-heavy systems) means checkpoints happen less often, and each one has more time to complete. The tradeoff: recovery after a crash takes slightly longer, because more WAL must be replayed.
Detecting checkpoint problems
SELECT
    checkpoints_timed,
    checkpoints_req,
    round(100.0 * checkpoints_req /
        nullif(checkpoints_timed + checkpoints_req, 0), 1
    ) AS pct_checkpoints_forced,
    buffers_checkpoint,
    buffers_backend,
    round(100.0 * buffers_backend /
        nullif(buffers_checkpoint + buffers_clean + buffers_backend, 0), 1
    ) AS pct_buffers_backend
FROM pg_stat_bgwriter;
Red flags:
pct_checkpoints_forcedabove 10% means checkpoints are triggering before the scheduled interval -- increasemax_wal_size.pct_buffers_backendabove 5% means backend processes are writing dirty pages themselves (the background writer and checkpointer are not keeping up). Increasebgwriter_lru_maxpagesandbgwriter_lru_multiplier.
Connection Management
This is where most teams make their biggest mistake. The instinct when connections are exhausted is to raise max_connections from 100 to 500 or 1000. This is backwards.
Each connection costs real memory
Every PostgreSQL connection is a separate operating system process. Each one consumes approximately 5-10MB of memory for its process stack, catalog caches, and per-connection state. Two hundred idle connections waste 1-2GB of RAM that could be serving shared_buffers or work_mem.
Worse, high connection counts cause lock contention, process scheduling overhead, and snapshot management costs. PostgreSQL benchmarks consistently show that throughput decreases above 200-300 connections even on powerful hardware. The sweet spot for most workloads is 50-100 active connections, with a connection pooler handling the rest.
The solution: connection pooling
Use PgBouncer (or a similar pooler) in front of PostgreSQL:
# PgBouncer configuration
pool_mode = transaction     # Return connection to pool after each transaction
max_client_conn = 1000      # Accept up to 1000 application connections
default_pool_size = 50      # But only maintain 50 actual PostgreSQL connections
Set PostgreSQL's max_connections to a value slightly above the pooler's total pool size -- typically 100-150. Your application gets the illusion of thousands of available connections, but PostgreSQL only manages a fraction of that.
The math is compelling: 1000 application connections through PgBouncer with a pool size of 50 means each query waits (briefly) for a connection slot, but PostgreSQL operates with 50 active connections instead of 1000. CPU scheduling improves, memory usage drops, and actual throughput increases.
Autovacuum Tuning
PostgreSQL's MVCC architecture means UPDATE and DELETE operations do not remove old row versions immediately. Autovacuum runs in the background to reclaim dead tuples. The defaults are too conservative for tables with more than a few million rows.
Key parameters
autovacuum_vacuum_scale_factor = 0.02   # Default: 0.2 (20% dead rows trigger vacuum)
autovacuum_vacuum_cost_delay = 2ms      # Default: 2ms (was 20ms before PG 12)
autovacuum_vacuum_cost_limit = 1000     # Default: -1 (uses vacuum_cost_limit = 200)
autovacuum_max_workers = 5              # Default: 3
The scale factor is the critical one. With the default of 0.2, a 10-million-row table accumulates 2 million dead tuples before vacuum triggers. By that point, the table is bloated, cache efficiency has degraded, and the vacuum itself takes longer than it would have if it ran earlier.
Setting autovacuum_vacuum_scale_factor = 0.02 means vacuum triggers after 200,000 dead rows on that same table -- a 10x improvement in responsiveness.
Per-table overrides for hot tables
For your highest-churn tables, set even more aggressive thresholds directly on the table:
ALTER TABLE orders SET (
    autovacuum_vacuum_scale_factor = 0.01,
    autovacuum_vacuum_threshold = 1000,
    autovacuum_analyze_scale_factor = 0.005
);
This triggers vacuum after 1% dead rows (or 1000 dead rows, whichever is larger) and refreshes planner statistics after 0.5% of rows change. For a table processing thousands of transactions per minute, this keeps bloat permanently under control.
Increase the cost limit
The autovacuum_vacuum_cost_limit controls how much I/O vacuum can consume before sleeping. The default effective limit of 200 (shared across all workers) is far too conservative on modern SSD/NVMe storage. Raising it to 1000-2000 allows vacuum to complete faster without meaningfully impacting query performance on hardware that can sustain high IOPS.
Planner Configuration
PostgreSQL's query planner uses cost estimates to choose execution plans. The default cost values assume spinning hard drives. If you are running on SSDs or NVMe, the planner is systematically overestimating the cost of random I/O and underestimating how effective index scans are.
The critical parameters
random_page_cost = 1.1          # Default: 4.0 (appropriate for HDDs)
seq_page_cost = 1.0             # Default: 1.0 (leave as-is)
effective_io_concurrency = 200  # Default: 1 (HDDs). NVMe can handle 200+
The default random_page_cost = 4.0 tells the planner that a random page read is 4x more expensive than a sequential read. On an HDD with seek times, this is accurate. On an NVMe drive where random and sequential reads are nearly identical in latency, this causes the planner to avoid index scans in favor of sequential scans -- even when the index scan would be dramatically faster.
Setting random_page_cost = 1.1 on SSD/NVMe storage is the single highest-impact planner change you can make. It tells the planner that random reads are only slightly more expensive than sequential reads, which is true on modern storage.
effective_io_concurrency controls how many concurrent disk reads PostgreSQL issues for bitmap heap scans. The default of 1 is absurdly low for any storage system made after 2010. NVMe drives handle hundreds of concurrent operations; set this to 200.
Parallel Query Configuration
PostgreSQL can split large queries across multiple CPU cores. The defaults are conservative -- a maximum of 2 workers per query, with thresholds that prevent parallelism on smaller tables.
max_parallel_workers_per_gather = 4   # Default: 2. Workers per parallel query.
max_parallel_workers = 8              # Default: 8. Total workers across all queries.
max_worker_processes = 16             # Default: 8. Total background workers.
parallel_setup_cost = 500             # Default: 1000. Lower to parallelize more queries.
parallel_tuple_cost = 0.01            # Default: 0.1. Lower for larger result sets.
min_parallel_table_scan_size = 4MB    # Default: 8MB. Parallelize smaller tables.
For analytical workloads that regularly scan large tables, increasing max_parallel_workers_per_gather to 4 means a single query can use 4 workers plus the leader process for 5-way parallelism on a sequential scan or hash join.
When to be cautious: If you run a high-concurrency OLTP system where dozens of queries execute simultaneously, aggressive parallel settings can cause worker starvation. Ten concurrent queries each requesting 4 workers means 40 parallel workers competing for CPU time. For OLTP systems, keep max_parallel_workers_per_gather at 2 and let parallelism benefit the occasional large query without starving the short ones.
Monitoring Tuning Impact
Tuning without monitoring is guessing. After changing any parameter, you need to measure the impact over a meaningful time period -- not just run a quick benchmark.
The metrics that matter after a configuration change:
- Cache hit ratio -- Did increasing
shared_buffersactually improve cache hits? If the ratio did not change, your working set was already fitting in memory. - Checkpoint frequency and duration -- Did increasing
max_wal_sizereduce forced checkpoints? Checkpg_stat_bgwriter. - Disk sort frequency -- Did increasing
work_memeliminate external merge sorts? MonitorEXPLAIN ANALYZEoutput for your heaviest queries. - Vacuum lag -- Are dead tuples being reclaimed faster? Track
n_dead_tuptrends over time. - Query latency percentiles -- p50, p95, and p99 latencies are more informative than averages. A change that improves p50 but hurts p99 may not be worth it.
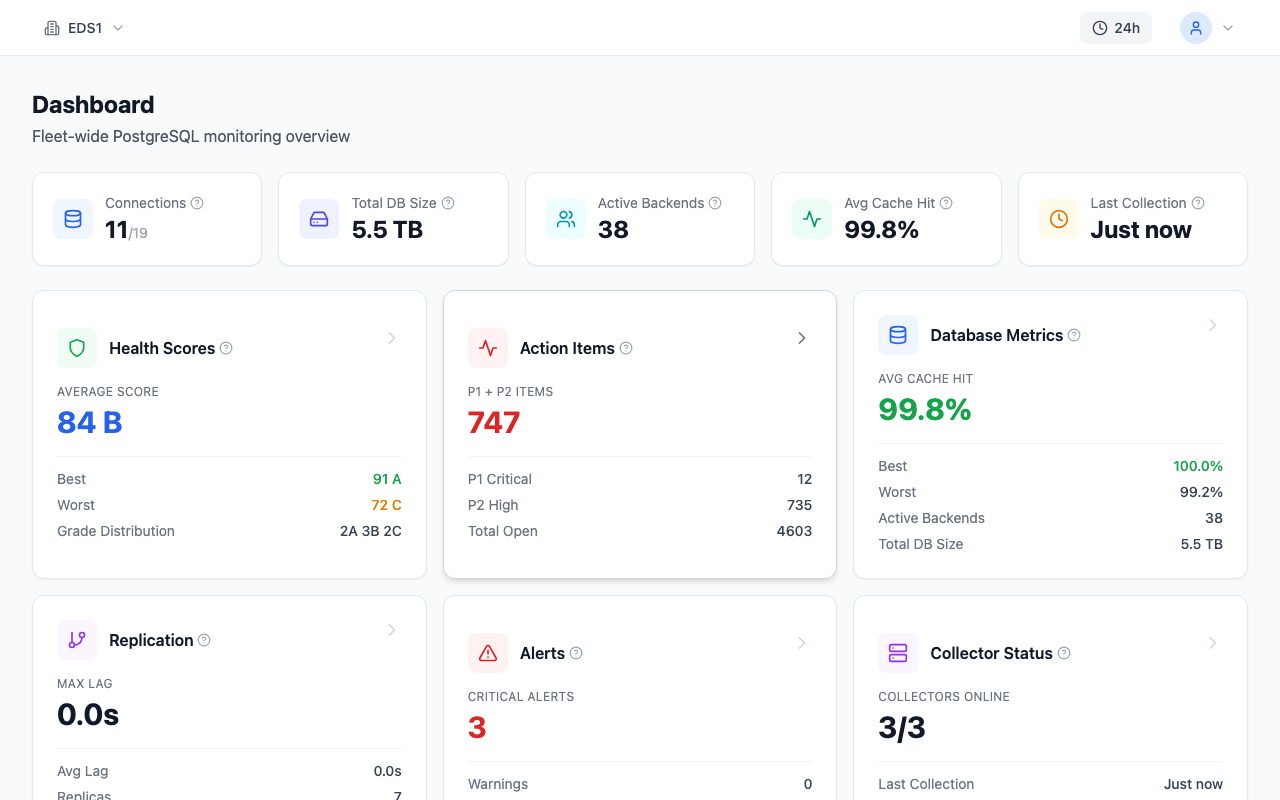
You need to see trends across a normal workload cycle (at least 24-48 hours), not just a single-point-in-time snapshot after a change.
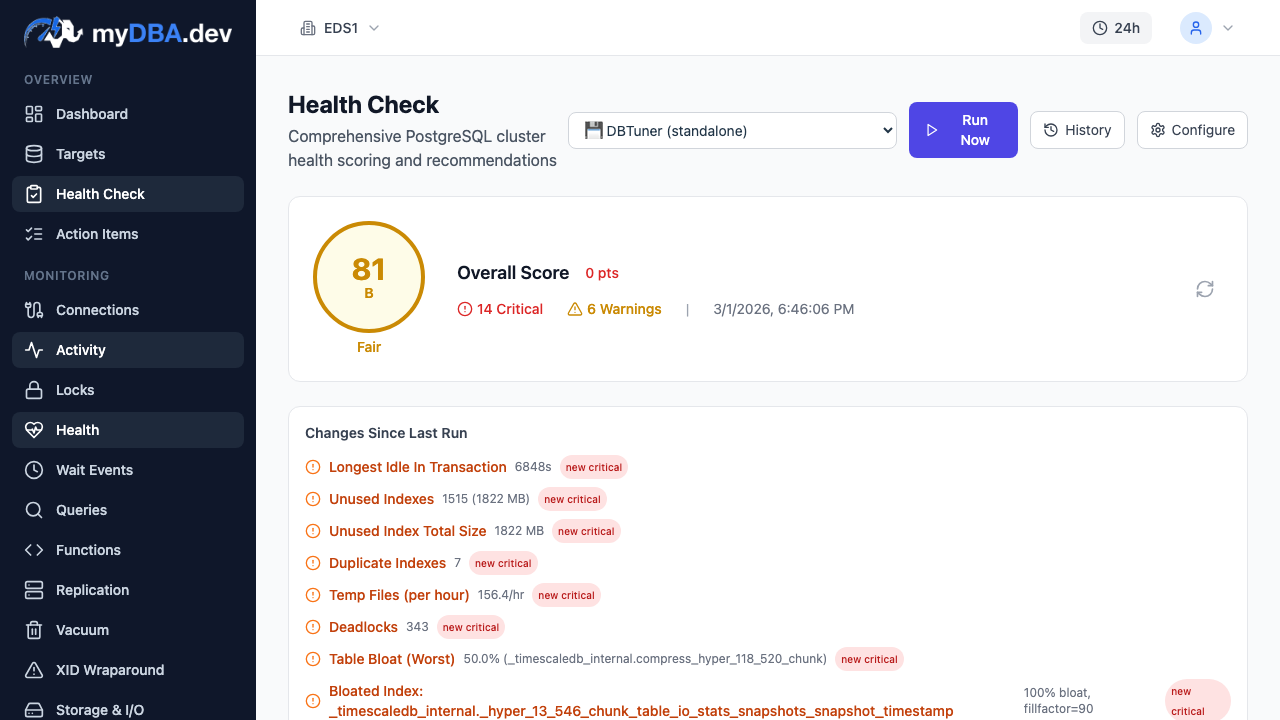
Tools like myDBA.dev track query performance trends, cache hit ratios, vacuum activity, and WAL rates over time -- making it clear whether a configuration change helped or hurt. Automated health checks can flag specific configuration issues (like shared_buffers set too low or checkpoint frequency too high) before they become performance problems.
Configuration by Workload Type
Here are concrete starting-point configurations for common server sizes. These are not final values -- they are starting points for your own tuning process.
| Parameter | Small Web App (4GB) | Medium OLTP (32GB) | Large Analytical (128GB) | Mixed Workload (64GB) | |-----------|--------------------|--------------------|--------------------------|----------------------| | shared_buffers | 1GB | 8GB | 32GB | 16GB | | effective_cache_size | 3GB | 24GB | 96GB | 48GB | | work_mem | 8MB | 64MB | 256MB | 128MB | | maintenance_work_mem | 256MB | 2GB | 4GB | 2GB | | max_connections | 100 | 200 | 100 | 200 | | max_wal_size | 2GB | 4GB | 8GB | 4GB | | random_page_cost | 1.1 | 1.1 | 1.1 | 1.1 | | effective_io_concurrency | 200 | 200 | 200 | 200 | | max_parallel_workers_per_gather | 2 | 2 | 4 | 4 | | autovacuum_vacuum_scale_factor | 0.05 | 0.02 | 0.01 | 0.02 | | checkpoint_completion_target | 0.9 | 0.9 | 0.9 | 0.9 |
Notes: The "Large Analytical" column uses higher work_mem because analytical queries involve large sorts and hash joins, but lower max_connections because analytical workloads have fewer concurrent users. For mixed workloads, consider setting work_mem per-session for analytical queries rather than raising the global value.
Step-by-Step Tuning Process
Resist the temptation to change 10 parameters at once. If performance improves, you do not know which change helped. If it degrades, you do not know which change caused the problem.
1. Baseline your metrics. Before changing anything, record current values for cache hit ratio, query latencies (p50/p95/p99), checkpoint frequency, autovacuum lag, and connection count. Run this baseline for at least 24 hours during a normal workload period.
2. Identify the bottleneck. Is your cache hit ratio below 99%? Start with shared_buffers. Are queries spilling sorts to disk? Focus on work_mem. Are you seeing forced checkpoints? Tune WAL settings. Are dead tuples accumulating? Fix autovacuum. Always start with the most impactful bottleneck.
3. Change ONE parameter. Make a single change and apply it. Some parameters require a restart (shared_buffers, max_connections, max_wal_size), while others can be changed with ALTER SYSTEM and a pg_reload_conf() call (work_mem, random_page_cost, autovacuum settings).
-- Change a parameter that only needs reload
ALTER SYSTEM SET random_page_cost = 1.1;
SELECT pg_reload_conf();

-- Verify the change
SHOW random_page_cost;
4. Measure for 24-48 hours. Let the system run through a complete workload cycle -- peak hours, batch jobs, quiet periods. Compare the same metrics from step 1.
5. Evaluate and repeat. If the change helped, keep it and move to the next bottleneck. If it made no difference or made things worse, revert it. Then address the next bottleneck in priority order.
Common Mistakes
These are the patterns I see most frequently in production PostgreSQL deployments.
Setting shared_buffers too high. On Linux, setting shared_buffers above 25-30% of RAM often decreases performance because it starves the OS page cache. The "double caching" effect means the same data sits in both PostgreSQL's buffer pool and the kernel's page cache, wasting memory. The exception is on Windows, where PostgreSQL cannot leverage the OS cache as effectively -- there, 40-50% may be appropriate.
Setting work_mem too high globally. A work_mem of 1GB seems reasonable until 50 concurrent queries each allocate it for multiple sort operations. Suddenly you need 150GB of RAM. Set work_mem conservatively at the global level (32-64MB for most systems) and raise it per-session for analytical queries.
Increasing max_connections instead of using a pooler. The symptom is "FATAL: too many connections." The instinct is to set max_connections = 500. The correct fix is to deploy PgBouncer or PgCat with a pool of 50-100 backend connections. Higher connection counts waste memory, increase lock contention, and reduce throughput.
Ignoring autovacuum. The default scale factor of 0.2 means large tables accumulate millions of dead tuples before vacuum triggers. By the time vacuum runs, the table is bloated, index scans are slower (they must skip dead tuples), and the vacuum itself takes longer than a series of smaller, earlier vacuums would have. Set the global scale factor to 0.02-0.05 and add per-table overrides for your busiest tables.
Tuning without a baseline. If you do not have before-and-after metrics, you cannot know whether a change helped. "It feels faster" is not evidence. Record cache hit ratios, query latencies, and checkpoint stats before making changes.
Never restarting to apply changes. Some parameters (shared_buffers, max_connections, max_worker_processes, wal_buffers) only take effect after a PostgreSQL restart. Running ALTER SYSTEM SET followed by pg_reload_conf() updates postgresql.auto.conf but does not apply the new value until restart. Always check for pending restarts:
SELECT name, setting, unit, pending_restart
FROM pg_settings
WHERE pending_restart = true;
What to Tune First
If you remember nothing else from this article, apply these five changes to every new PostgreSQL instance:
1. shared_buffers = 25% of RAM -- Stop leaving 95% of your memory unused. 2. effective_cache_size = 75% of RAM -- Tell the planner about all available memory. 3. random_page_cost = 1.1 -- Stop penalizing index scans on SSD storage. 4. max_wal_size = 4GB -- Reduce checkpoint frequency and I/O spikes. 5. autovacuum_vacuum_scale_factor = 0.02 -- Vacuum before bloat accumulates.
These five changes take 5 minutes and will transform the behavior of a default PostgreSQL installation. Everything else in this guide is refinement -- important refinement, but the foundation starts here.