Debugging Stale Continuous Aggregates in TimescaleDB
Debugging Stale Continuous Aggregates in TimescaleDB
Your dashboard numbers stopped matching reality three weeks ago. A report shows average sensor readings at 42, but a raw query against the source hypertable returns 78. After half a day of chasing phantom data issues, you discover the continuous aggregate refresh job stopped running. The materialized data is weeks old, and every downstream query has been silently returning stale results.
This is one of the most insidious TimescaleDB operational failures. Unlike a crashed service or a full disk, a stale continuous aggregate produces no errors. Queries succeed. Results look plausible. You only notice when someone cross-checks the numbers.
What "Stale" Actually Means
A continuous aggregate (CAGG) materializes pre-computed results from a source hypertable. A background refresh job periodically re-reads recent source data and updates the materialized view. The most recent bucket that has been materialized is the high-water mark.
When the refresh job stops running -- or falls behind -- the high-water mark freezes. New data continues to flow into the source hypertable, but the CAGG does not see it. The gap between the latest materialized bucket and the current time is the staleness duration.
A staleness of a few hours may be acceptable depending on your end_offset and schedule_interval. A staleness of days or weeks means something is broken.
Measuring Staleness
The first diagnostic step is quantifying how far behind the CAGG has fallen:
SELECT
    view_name AS cagg_name,
    max(bucket_column)::timestamp(0) AS latest_materialized,
    now()::timestamp(0) AS current_time,
    now() - max(bucket_column) AS staleness_duration,
    CASE
        WHEN now() - max(bucket_column) > INTERVAL '2 hours'
            THEN 'CRITICALLY STALE'
        WHEN now() - max(bucket_column) > INTERVAL '1 hour'
            THEN 'STALE'
        ELSE 'ACCEPTABLE'
    END AS staleness_level
FROM your_continuous_aggregate
CROSS JOIN timescaledb_information.continuous_aggregates
WHERE view_name = 'your_continuous_aggregate'
GROUP BY view_name;
Compare this against the source table to see the data gap:
SELECT 'Source (raw)' AS data_source,
       count(*) AS row_count,
       max(event_timestamp_utc)::timestamp(0) AS latest_timestamp
FROM source_hypertable
UNION ALL
SELECT 'CAGG (materialized)',
       sum(event_count),
       max(bucket_hour_utc)::timestamp(0)
FROM your_continuous_aggregate;
If the source shows recent data but the CAGG is hours or days behind, the refresh pipeline is broken.
The Five Common Causes
1. Refresh job paused or disabled
The most frequent cause. Someone ran alter_job(job_id, scheduled => false) during debugging or a migration and forgot to re-enable it. The CAGG silently stops updating.
2. Background worker exhaustion
TimescaleDB runs all scheduled jobs -- compression, retention, CAGG refresh -- through a pool of background workers controlled by timescaledb.max_background_workers. If you have 30 policies competing for 8 worker slots, refresh jobs queue up. Jobs that wait too long are skipped entirely.
3. Lock contention on the source hypertable
The refresh job needs to read from the source hypertable. Heavy concurrent writes can block the refresh with lock waits. If the contention persists across multiple schedule intervals, the CAGG falls progressively further behind.
4. end_offset too large
The end_offset parameter excludes recent data from materialization to account for late-arriving rows. An end_offset of 6 hours means the CAGG is always at least 6 hours behind by design. If someone sets this too conservatively, the CAGG appears stale even when the job is running correctly.
5. Refresh job errors
Out-of-memory conditions, disk pressure, or data issues can cause the refresh job to fail. TimescaleDB retries, but if the root cause persists, the job accumulates failures and the CAGG falls behind. Check timescaledb_information.job_errors for specifics.
Diagnostic Flowchart
When you suspect a stale CAGG, work through these steps in order:
1. Is the job scheduled? Check SELECT scheduled FROM timescaledb_information.jobs WHERE proc_name = 'policy_refresh_continuous_aggregate'. If false, this is your answer.
2. Is the job running? Check timescaledb_information.job_stats for last_run_status and last_successful_finish. If the last success was days ago, the job is stuck or failing.
3. Is the job failing? Check total_failures in job stats. Any value above zero warrants investigation. Query timescaledb_information.job_errors for the specific error message.
4. Is the job overdue? Compare now() - last_successful_finish against schedule_interval * 2. If the job last succeeded 30 minutes ago but runs every 5 minutes, workers are likely exhausted or contention is blocking execution.
SELECT
    j.job_id,
    j.scheduled AS is_scheduled,
    js.last_run_status,
    js.last_successful_finish::timestamp(0) AS last_success,
    js.total_failures,
    CASE
        WHEN NOT j.scheduled
            THEN 'JOB PAUSED'
        WHEN js.total_failures > 0
            THEN 'JOB FAILING — check job_errors'
        WHEN (now() - js.last_successful_finish) > j.schedule_interval * 3
            THEN 'OVERDUE — workers may be exhausted'
        ELSE 'Normal'
    END AS diagnosis
FROM timescaledb_information.jobs j
JOIN timescaledb_information.job_stats js USING (job_id)
WHERE j.proc_name = 'policy_refresh_continuous_aggregate';
Fixing Staleness
Resume a paused job
SELECT alter_job(job_id, scheduled => true)
FROM timescaledb_information.jobs
WHERE proc_name = 'policy_refresh_continuous_aggregate'
  AND hypertable_name = 'your_continuous_aggregate'
  AND NOT scheduled;
Manual refresh to catch up immediately
Do not wait for the next scheduled run. Force an immediate refresh over the stale window:
CALL refresh_continuous_aggregate(
    'your_continuous_aggregate',
    now() - INTERVAL '7 days',
    now() - INTERVAL '30 minutes'
);
Adjust the start bound to cover the entire period of staleness. The 30 minutes end bound should match your end_offset to avoid refreshing data that may still have late arrivals.
Increase background workers
If the root cause is worker exhaustion, increase the pool:
ALTER SYSTEM SET timescaledb.max_background_workers = 32;
-- Requires PostgreSQL restart
SELECT pg_reload_conf();  -- For other GUC changes; workers need restart
Count your total scheduled policies (compression + retention + CAGG refresh) and add headroom. Setting workers to 1.5x your policy count is a reasonable starting point.
How myDBA.dev Detects Stale Aggregates
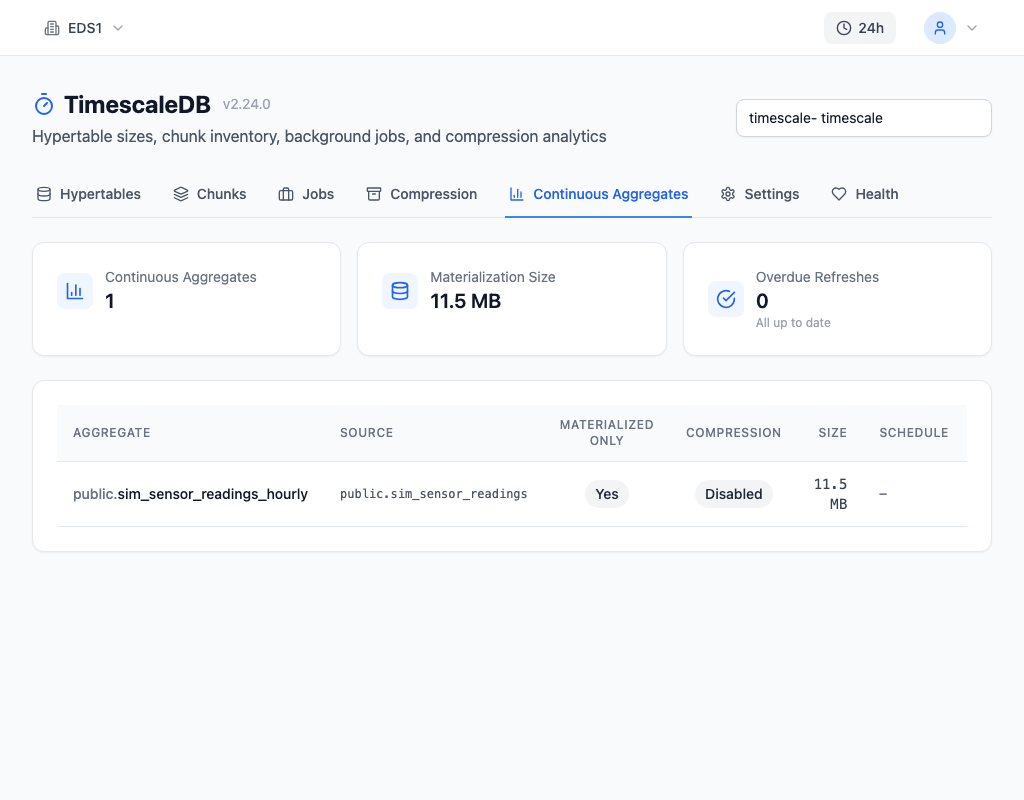
The TimescaleDB monitoring page includes health check T6, which compares each CAGG's last successful refresh against its schedule interval and flags overdue refreshes automatically. The Continuous Aggregates tab displays a staleness gauge per aggregate -- green when fresh, red when the materialization watermark has fallen critically behind -- so you can spot the problem at a glance without writing diagnostic queries.
Preventing Staleness
Monitor the refresh job, not just the data. A CAGG that returns results without errors can still be weeks out of date. Set up alerting on last_successful_finish relative to schedule_interval.
Size your background workers properly. Count every scheduled policy across all hypertables, add a buffer for TimescaleDB internal jobs, and set max_background_workers accordingly. This is the single most common cause of silent job failures.
Audit after migrations. Any DDL change to a hypertable or its CAGG can disable or invalidate the refresh policy. Make it a post-migration checklist item to verify that all CAGG refresh jobs show scheduled = true.
Set staleness alerts. A simple cron job or monitoring check that queries now() - last_successful_finish > schedule_interval * 3 for all CAGG refresh jobs will catch problems within hours instead of weeks.
Stale continuous aggregates are dangerous precisely because they fail silently. The queries work, the numbers look reasonable, and nothing in your logs says "error." The only defense is proactive monitoring of the refresh pipeline itself.