Monitoring Compression Health: Detecting Uncompressed Chunks and Policy Gaps
Monitoring Compression Health: Detecting Uncompressed Chunks and Policy Gaps
You configured TimescaleDB compression, added a policy, and moved on. Six months later, you check disk usage and discover it's 3x what it should be. The compression policy quietly stopped working weeks ago, and uncompressed chunks have been piling up.
This is one of the most common TimescaleDB operational failures — and one of the easiest to prevent with proper monitoring.
How Compression Policies Work (And Fail)
TimescaleDB compression policies run as background jobs. The add_compression_policy() function creates a scheduled job that periodically scans for chunks older than the compress_after threshold and compresses them.
-- Compress chunks older than 1 hour, check every 30 minutes
SELECT add_compression_policy('sensor_readings',
    compress_after => INTERVAL '1 hour');
This job depends on several things going right:
1. Background workers are available — TimescaleDB jobs compete for timescaledb.max_background_workers slots 2. The job isn't paused — Manual intervention or failed migrations can disable jobs 3. The job completes successfully — Lock contention, disk pressure, or OOM can cause failures 4. The schedule interval is shorter than data accumulation — If chunks are created faster than compression runs, a backlog forms
When any of these conditions fail, chunks accumulate uncompressed. The problem is silent — there's no built-in alerting for "compression is behind."
Detecting Uncompressed Chunk Backlog
Manual detection
-- Find chunks that should be compressed but aren't
SELECT
    c.hypertable_name,
    c.chunk_name,
    c.range_end::timestamp(0) AS chunk_end,
    now() - c.range_end AS age,
    pg_size_pretty(pg_total_relation_size(
        c.chunk_schema || '.' || c.chunk_name
    )) AS chunk_size
FROM timescaledb_information.chunks c
JOIN timescaledb_information.jobs j
    ON j.hypertable_schema = c.hypertable_schema
    AND j.hypertable_name = c.hypertable_name
    AND j.proc_name = 'policy_compression'
WHERE NOT c.is_compressed
  AND c.range_end < now() - (j.config->>'compress_after')::interval
ORDER BY c.range_start;
Any rows returned indicate chunks that are past their compress_after window but haven't been compressed. One or two is normal (the policy may be mid-cycle). More than a handful indicates a problem.
Check the compression job status
SELECT
    j.job_id,
    j.hypertable_name,
    j.scheduled AS is_active,
    js.total_runs,
    js.total_failures,
    js.last_run_status,
    js.last_run_duration,
    js.last_successful_finish::timestamp(0) AS last_success,
    CASE
        WHEN NOT j.scheduled THEN 'PAUSED!'
        WHEN js.total_failures > 0 THEN 'FAILING'
        WHEN (now() - js.last_successful_finish) > j.schedule_interval * 3
            THEN 'OVERDUE'
        ELSE 'Healthy'
    END AS diagnosis
FROM timescaledb_information.jobs j
JOIN timescaledb_information.job_stats js USING (job_id)
WHERE j.proc_name = 'policy_compression'
ORDER BY js.total_failures DESC;
Look for jobs where scheduled = false (paused), total_failures > 0 (errors), or last_successful_finish is significantly older than the schedule interval (overdue).
The Five Failure Modes
1. Job paused or disabled
The most common cause. A migration, manual debugging, or alter_job(job_id, scheduled => false) call disables the job, and no one remembers to re-enable it.
Fix: SELECT alter_job(job_id, scheduled => true) FROM timescaledb_information.jobs WHERE proc_name = 'policy_compression' AND NOT scheduled;
2. Background worker exhaustion
TimescaleDB limits concurrent background jobs to timescaledb.max_background_workers (default: 8–16). With many hypertables, compression/retention/CAGG refresh jobs compete for limited slots. When all workers are busy, compression jobs queue and eventually time out.
Fix: ALTER SYSTEM SET timescaledb.max_background_workers = 32; (requires restart)
3. Lock contention
Heavy concurrent INSERTs on the same chunk that's being compressed can cause lock waits. If the compression job waits too long, it fails.
Fix: Increase compress_after to ensure the target chunk is no longer receiving writes.
4. Disk space pressure
Compression temporarily requires space for both the uncompressed and compressed versions of a chunk. If disk is nearly full, compression fails.
Fix: Free space by dropping old chunks first: SELECT drop_chunks('table', older_than => INTERVAL '90 days');
5. Job error cascade
A single chunk that fails to compress (due to data corruption, unsupported types, or edge cases) can cause the job to stop retrying other chunks.
Fix: Check timescaledb_information.job_errors for specific error messages. Manually compress the problematic chunk to see the full error.
Catching Up: Manual Compression
When compression falls behind, don't wait for the scheduled policy to catch up — it processes chunks one at a time. Manually compress the backlog:
-- Compress all eligible uncompressed chunks at once
SELECT compress_chunk(chunk_schema || '.' || chunk_name)
FROM timescaledb_information.chunks
WHERE hypertable_name = 'sensor_readings'
  AND NOT is_compressed
  AND range_end < now() - INTERVAL '1 hour'
ORDER BY range_start;
This runs synchronously in your session, bypassing the background worker queue.
How myDBA.dev Surfaces Compression Gaps
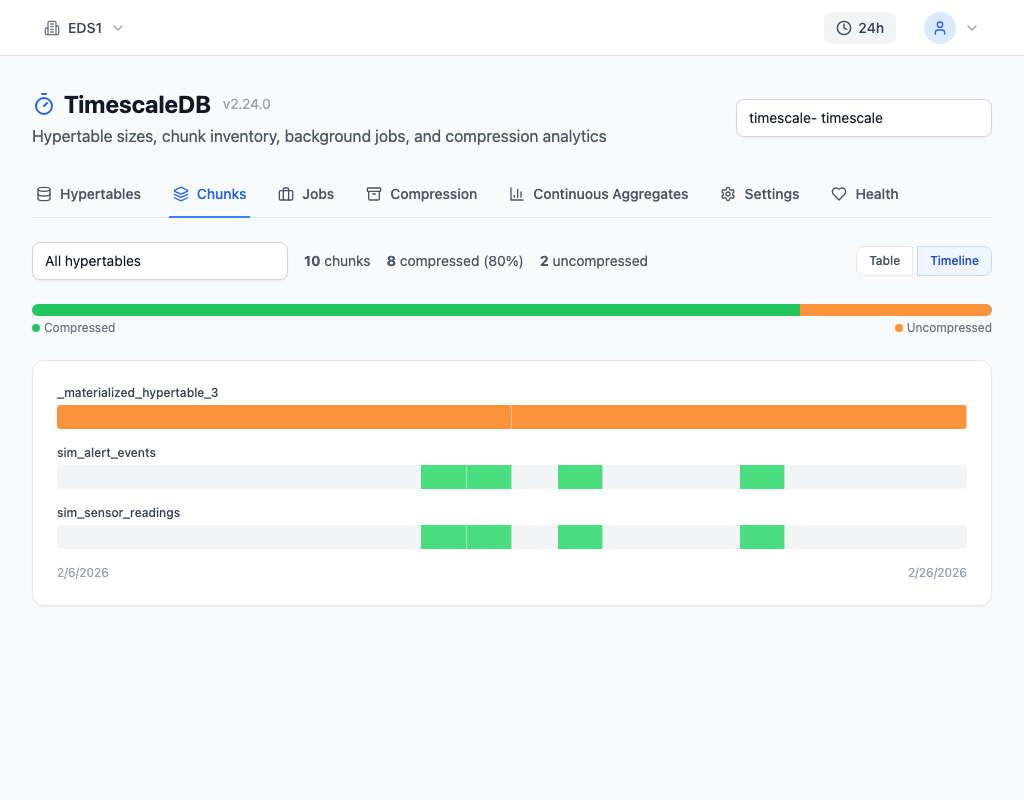
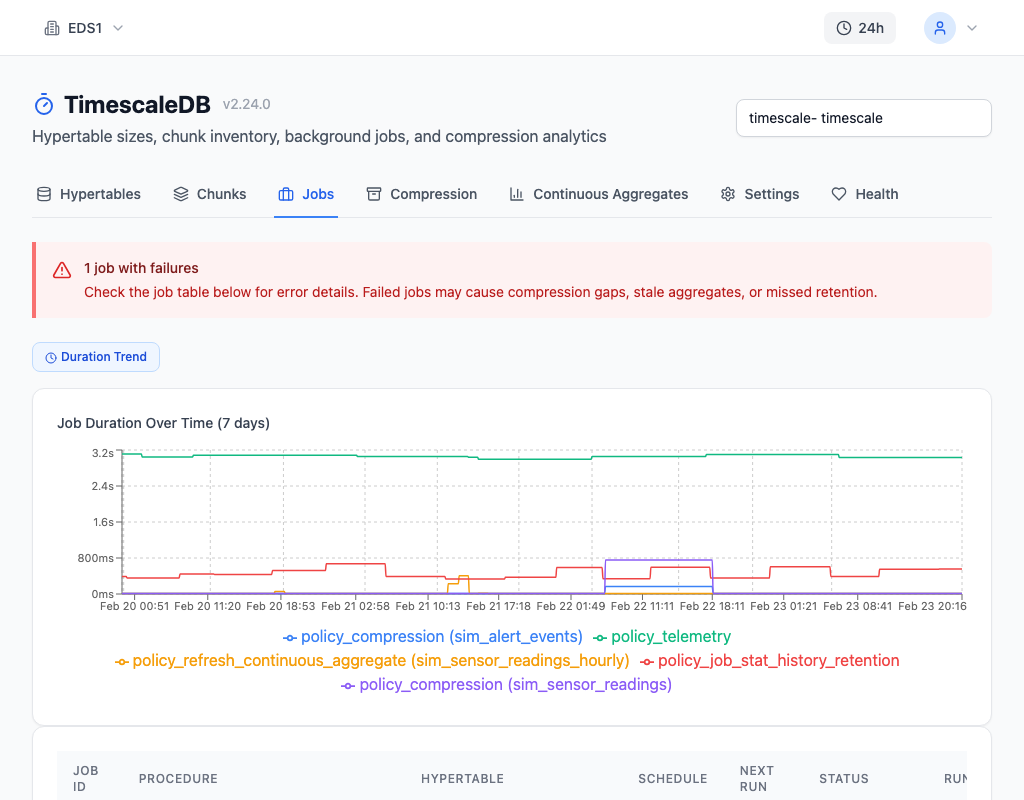
The TimescaleDB monitoring page provides three layers of compression gap detection. The Chunks tab shows a color-coded timeline — green for compressed, orange for uncompressed — making policy gaps immediately visible. The Jobs tab displays compression job status, failure counts, and duration trends, with warning banners when jobs have failures or are approaching their schedule interval.
The Health tab runs two specific checks: T1 detects chunks past their compress_after window that haven't been compressed, and T9 measures the uncompressed chunk ratio across compression-enabled hypertables. Both generate actionable findings with severity scores.
Preventing Compression Gaps
Monitor the job, not just the data. The compression policy is a background job — it can fail silently. Set up alerting on total_failures > 0 for compression jobs.
Size your workers. Count all your scheduled policies (compression + retention + CAGG refresh), add 2 for TimescaleDB internals, and set max_background_workers to at least that number.
Test after migrations. Any migration that alters hypertable structure should verify that compression policies are still active afterward.
Use manual compression during incidents. If the scheduled policy falls behind for any reason, run manual compression immediately rather than waiting for the backlog to self-resolve.
Continuous monitoring with myDBA.dev catches compression gaps within minutes through health check T1, well before they become a storage emergency.