TimescaleDB Continuous Aggregates: Real-Time vs Materialized-Only
TimescaleDB Continuous Aggregates: Real-Time vs Materialized-Only
Your dashboard shows data up to 2 hours ago but the raw table has current data -- the CAGG's refresh window isn't what you think. Continuous aggregates are one of TimescaleDB's most powerful features, but the interaction between refresh policies and real-time mode catches nearly everyone off guard. Understanding how these two pieces fit together is the difference between a dashboard that silently lies and one that gives you trustworthy numbers.
What a Continuous Aggregate Actually Is
A continuous aggregate (CAGG) is a materialized view backed by its own hypertable. When you create one, TimescaleDB builds a hidden hypertable in _timescaledb_internal that stores the pre-computed aggregate results. Queries against the CAGG read from this materialization hypertable instead of scanning millions of raw rows every time.
CREATE MATERIALIZED VIEW hourly_device_metrics
WITH (timescaledb.continuous) AS
SELECT
    time_bucket('1 hour', event_timestamp_utc) AS bucket_hour_utc,
    device_id,
    AVG(metric_value) AS avg_metric_value,
    MAX(metric_value) AS max_metric_value,
    COUNT(*) AS event_count
FROM sensor_events
GROUP BY bucket_hour_utc, device_id;
This creates the CAGG, but it doesn't populate it. The materialization hypertable is empty until you either run a manual refresh or add a refresh policy.
Refresh Policies: The Three Parameters That Control Freshness
A refresh policy tells TimescaleDB to periodically re-compute aggregate values for a sliding time window. It takes three parameters:
SELECT add_continuous_aggregate_policy('hourly_device_metrics',
    start_offset  => INTERVAL '3 hours',
    end_offset    => INTERVAL '1 hour',
schedule_interval => INTERVAL '30 minutes');- start_offset: How far back from
now()the refresh window begins. Setting3 hoursmeans "re-materialize data starting 3 hours ago." - end_offset: How far back from
now()the refresh window ends. Setting1 hourmeans "stop materializing at 1 hour ago." Data newer than this boundary is never materialized by the policy. - schedule_interval: How often the policy runs. Every 30 minutes in this example.
The critical detail is end_offset. It creates a deliberate gap -- a window of recent data that the policy intentionally skips. Why? Because the most recent buckets are still accumulating data. Materializing a partially-filled bucket and then re-materializing it minutes later wastes work. The end_offset avoids this churn by only materializing buckets that are "complete."
The consequence: with the policy above, materialized data is always at least 1 hour old, and could be up to 1.5 hours old (end_offset plus one schedule_interval cycle).
Real-Time Mode: The Default Gap-Filler
By default, TimescaleDB creates CAGGs in real-time mode. When you query a real-time CAGG, it does two things:
1. Reads pre-computed results from the materialization hypertable for the already-materialized time range. 2. Runs a live aggregation query against the source hypertable for any data newer than the materialization watermark.
It then unions the two result sets transparently. You can see this in the query plan:
EXPLAIN SELECT bucket_hour_utc, device_id, avg_metric_value
FROM hourly_device_metrics
WHERE bucket_hour_utc >= now() - INTERVAL '24 hours';
The EXPLAIN output shows an Append node with two children: one scan against the materialization hypertable (for the historical portion) and one scan against the source hypertable (for the recent, unmaterialized portion). The union is invisible to your application -- the CAGG returns a complete result set as if all data had been materialized.
The tradeoff is performance. The historical portion is fast -- it reads pre-computed rows. The recent portion is slow -- it runs the full aggregation query against raw data. For a dashboard querying the last 24 hours, the first 23 hours come from materialization (fast), and the last hour comes from a live query (slower). The larger your end_offset or the longer since the last refresh, the more data comes from the live path.
Materialized-Only Mode: Speed Over Freshness
You can disable the real-time union by setting materialized_only = true:
-- At creation time
CREATE MATERIALIZED VIEW hourly_device_metrics_fast
WITH (timescaledb.continuous, timescaledb.materialized_only = true) AS
SELECT ...

-- Or toggle on an existing CAGG
ALTER MATERIALIZED VIEW hourly_device_metrics
SET (timescaledb.materialized_only = true);
In materialized-only mode, the CAGG returns only pre-computed data. Queries never touch the source hypertable. The most recent hour (or however large your end_offset is) simply does not appear in results.
This makes queries faster and more predictable. There is no live aggregation path, no scan of the raw table, no variable performance depending on how much unmaterialized data has accumulated. The query plan shows a single scan against the materialization hypertable.
You can toggle between modes at any time without losing data:
-- Switch to materialized-only (faster, stale)
ALTER MATERIALIZED VIEW hourly_device_metrics
SET (timescaledb.materialized_only = true);

-- Switch back to real-time (slower, current)
ALTER MATERIALIZED VIEW hourly_device_metrics
SET (timescaledb.materialized_only = false);
No data is dropped or re-computed. The toggle only changes whether the query executor appends the live union.
Comparison: Real-Time vs Materialized-Only
| Aspect | Real-Time (default) | Materialized-Only | |--------|--------------------|--------------------| | Data freshness | Always current (up to now()) | Stale by end_offset + schedule_interval | | Query performance (recent window) | Slower -- live aggregation on source table | Fast -- reads only materialization | | Query performance (historical) | Same | Same | | Touches source hypertable | Yes, for unmaterialized range | Never | | Query plan | Append with two scan nodes | Single scan node | | Best for | Dashboards, alerts, operational monitoring | Reports, billing, analytics, batch pipelines |
Monitoring Continuous Aggregates with myDBA.dev
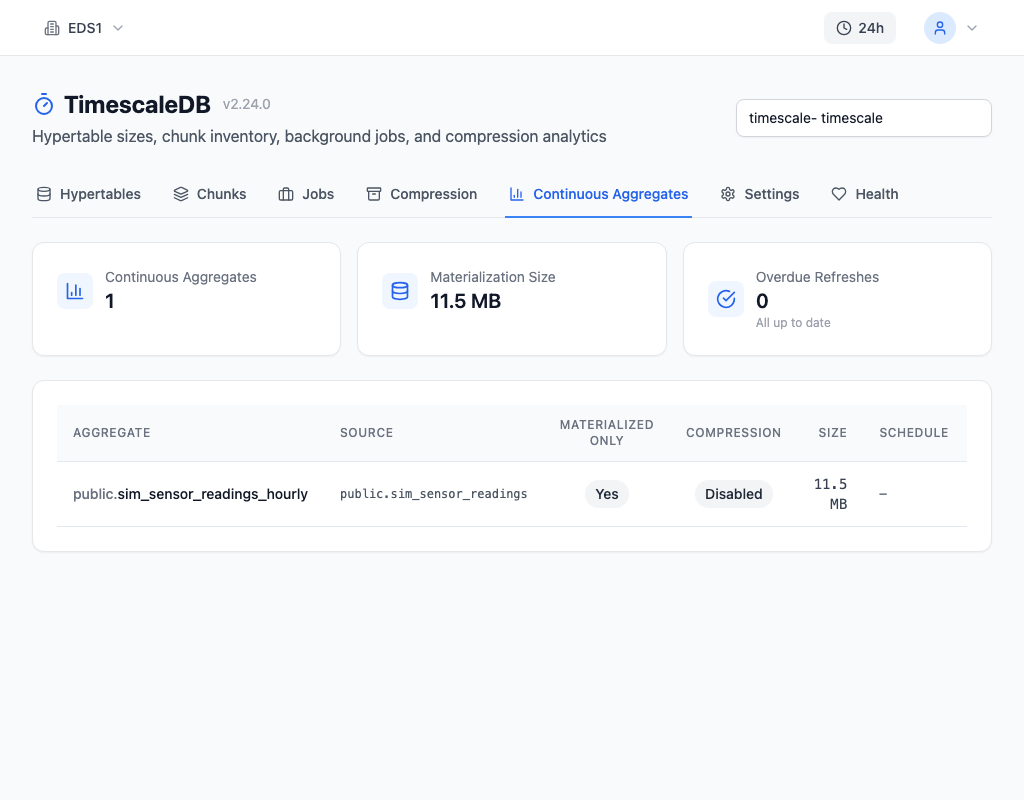
Staleness is the silent failure mode of continuous aggregates -- the CAGG returns results, but they are hours or days behind because a refresh policy stalled or was never configured. myDBA.dev's Continuous Aggregates tab surfaces a staleness gauge for each CAGG, showing the gap between the materialization watermark and the current time, so you can spot refresh failures before they reach your dashboards.
When to Choose Which
Use real-time mode when your consumers expect up-to-the-minute data and can tolerate slightly higher latency on the most recent time window. This is the right default for operational dashboards, alerting queries, and any use case where "no data" is worse than "slightly slower data."
Use materialized-only mode when freshness requirements are relaxed and query performance consistency matters more. Billing calculations, daily/weekly reports, analytics pipelines that run on a schedule, and any context where results should represent a stable snapshot rather than a moving target. If your report runs at 6 AM and covers yesterday's data, there is no value in the real-time union -- it only adds overhead.
Start with real-time, switch to materialized-only when needed. The toggle is instant and non-destructive. If you find that the live aggregation path is creating performance problems on a busy source table -- or if consumers don't actually need sub-hour freshness -- flip the switch. You can always flip it back.
The key insight: the CAGG's end_offset is not a bug or a misconfiguration. It is a deliberate design choice that prevents wasted re-computation. Real-time mode exists to cover that gap transparently. Materialized-only mode exists for when you'd rather have speed and accept the gap. Knowing which mode you're running -- and why -- is what keeps your aggregated data trustworthy.