Monitoring TimescaleDB in Production: A Complete Checklist
Monitoring TimescaleDB in Production: A Complete Checklist
Most TimescaleDB failures are predictable: compression stops, chunks proliferate, CAGGs go stale, workers exhaust. Every one of these has observable symptoms hours or days before it becomes a problem. The difference between a TimescaleDB deployment that runs unattended for months and one that wakes you up at 3 AM is whether you are watching the right signals.
This article is a monitoring checklist. Each section covers a failure mode, the queries that detect it early, and pointers to the deeper technical articles in this series. If you only do one thing, run these queries weekly. If you automate them, you will catch most production incidents before they start.
1. Chunk Health
Chunks are the physical backbone of every hypertable. Too many chunks slow every query through planning overhead. Too few chunks make retention and compression coarse-grained. The signals to watch:
Total chunk count per hypertable. When chunk count crosses 1,000, planning overhead starts adding hundreds of milliseconds to every query — even trivial ones that only touch a single chunk. See How TimescaleDB Chunks Actually Work for the benchmarks.
Chunk interval vs. ingest rate. A mismatch means chunks are either too small (proliferating) or too large (slow compression, coarse retention). See Choosing the Right chunk_time_interval for the sizing formula.
-- Chunk count and average size per hypertable
SELECT
    hypertable_name,
    count(*) AS total_chunk_count,
    pg_size_pretty(avg(total_bytes)) AS avg_chunk_size
FROM timescaledb_information.chunks
GROUP BY hypertable_name
ORDER BY total_chunk_count DESC;
If any hypertable exceeds 500 chunks with a stable ingest rate, your interval is too small. Adjust with set_chunk_time_interval() — it affects only future chunks, so the old ones age out through retention.
2. Compression Health
Compression is where the bulk of your storage savings live. When it stops working, disk usage climbs fast. Three things to monitor:
Compression ratio. A healthy ratio is 8x-20x for typical time-series data. Below 3x means your segmentby cardinality is too high, your data is too random, or you added a high-entropy column. See Why Your TimescaleDB Compression Ratio Is Bad.
Uncompressed chunk backlog. Chunks older than your compress_after interval that remain uncompressed indicate a stalled compression policy. See Monitoring Compression Health for the full diagnostic.
-- Find uncompressed chunks older than the compression policy threshold
SELECT
    hypertable_name,
    chunk_name,
    range_start,
    range_end,
    pg_size_pretty(total_bytes) AS chunk_size
FROM timescaledb_information.chunks
WHERE NOT is_compressed
  AND range_end < now() - INTERVAL '2 hours'
ORDER BY range_end ASC;
Policy existence. Enabling compression settings (ALTER TABLE ... SET) without adding add_compression_policy() is the most common compression mistake — the settings declare how to compress, the policy triggers when. Check every hypertable has both. See TimescaleDB Compression: A Complete Guide for the full setup.
3. Continuous Aggregate Health
Continuous aggregates trade compute at query time for materialized results. When they go stale, dashboards show old data without warning. The signals:
Staleness. A CAGG whose last refresh was hours ago while fresh data is flowing in is silently lying. The materialization_hypertable tells you the watermark. See Debugging Stale Continuous Aggregates.
Refresh job status. A CAGG refresh that fails repeatedly — often due to lock contention from concurrent writes — falls behind silently. Check timescaledb_information.job_stats for the last run status.
-- CAGG refresh job status and staleness
SELECT
    ca.view_name,
    js.last_run_status,
    js.last_successful_finish,
    now() - js.last_successful_finish AS time_since_last_refresh,
    js.total_failures
FROM timescaledb_information.continuous_aggregates ca
JOIN timescaledb_information.jobs j
    ON j.hypertable_name = ca.materialization_hypertable_name
JOIN timescaledb_information.job_stats js USING (job_id)
ORDER BY time_since_last_refresh DESC;
Materialization size. A CAGG that grows without bound means its refresh window is too wide or it lacks its own retention policy. See Optimizing Continuous Aggregate Performance and Real-Time vs Materialized-Only for the trade-offs.
4. Background Worker Health
Every compression, retention, and CAGG refresh policy runs as a background job. TimescaleDB's worker pool is finite, controlled by timescaledb.max_background_workers_per_db. When the number of scheduled jobs exceeds available workers, jobs queue and fall behind. See Understanding TimescaleDB Background Workers for the full breakdown.
-- Job count vs. worker capacity
SELECT
    current_setting('timescaledb.max_background_workers_per_db') AS max_workers,
    (SELECT count(*) FROM timescaledb_information.jobs WHERE scheduled) AS active_jobs,
    (SELECT count(*) FROM timescaledb_information.job_stats
     WHERE last_run_status = 'Failed') AS failed_jobs;
If active jobs exceed max workers, jobs compete for slots. Failed jobs compound the problem — each retry consumes a worker slot that another job needs. Address failures first, then increase max_background_workers_per_db if needed.
5. Storage and Retention
Retention policies drop entire chunks instantly — no row-by-row DELETE, no dead tuples, no vacuum overhead. But if the retention job silently fails, old data accumulates. See Data Retention Policies.
-- Verify retention jobs are running and chunks aren't piling up
SELECT
    j.hypertable_name,
    j.schedule_interval,
    js.last_run_status,
    js.last_successful_finish,
    (SELECT count(*) FROM timescaledb_information.chunks c
     WHERE c.hypertable_name = j.hypertable_name) AS current_chunk_count
FROM timescaledb_information.jobs j
JOIN timescaledb_information.job_stats js USING (job_id)
WHERE j.proc_name = 'policy_retention'
ORDER BY js.last_successful_finish ASC;
Watch disk usage trends alongside retention. If total hypertable size grows week over week despite retention running, either the ingest rate increased or the retention window is too generous for the ingest volume.
6. Memory and Performance
TimescaleDB runs inside PostgreSQL, so the standard PostgreSQL performance signals apply — but chunk-based architecture amplifies some of them.
shared_buffers fit. The active working set in TimescaleDB is typically the most recent uncompressed chunks plus frequently-accessed compressed segments. If the combined size of your uncompressed chunks exceeds shared_buffers, the buffer cache thrashes. See TimescaleDB Memory Tuning.
XID age. Each chunk is a separate PostgreSQL table with its own relfrozenxid. With hundreds of chunks, autovacuum must freeze each one individually. A single chunk stuck behind a long-running transaction can push the entire cluster toward XID wraparound. See Preventing XID Wraparound on TimescaleDB Hypertables.
Insert throughput. TimescaleDB routes each INSERT to the correct chunk, which adds measurable overhead compared to plain PostgreSQL tables — especially with many open chunks or when hitting compressed chunks. See INSERT Performance Tuning.
-- Uncompressed working set vs. shared_buffers
SELECT
    pg_size_pretty(sum(total_bytes)) AS uncompressed_working_set,
    current_setting('shared_buffers') AS shared_buffers_setting
FROM timescaledb_information.chunks
WHERE NOT is_compressed;
How myDBA.dev Automates This Entire Checklist
Running these queries manually works for a weekly check. For continuous monitoring, myDBA.dev automates every signal described above.
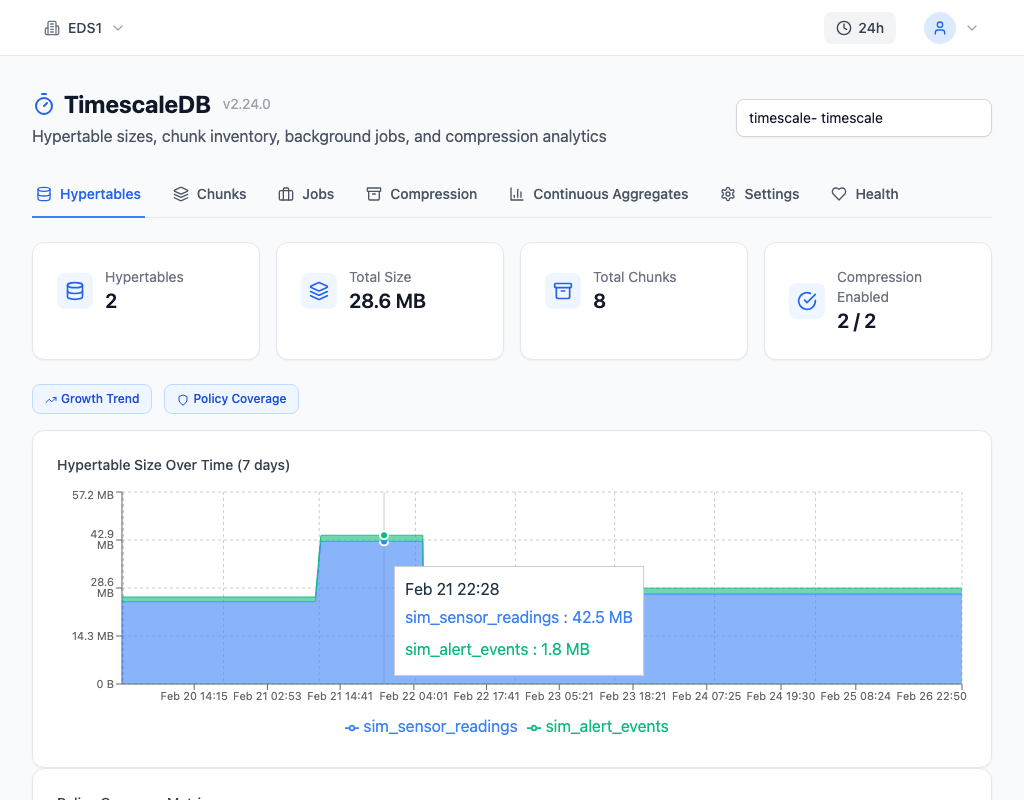
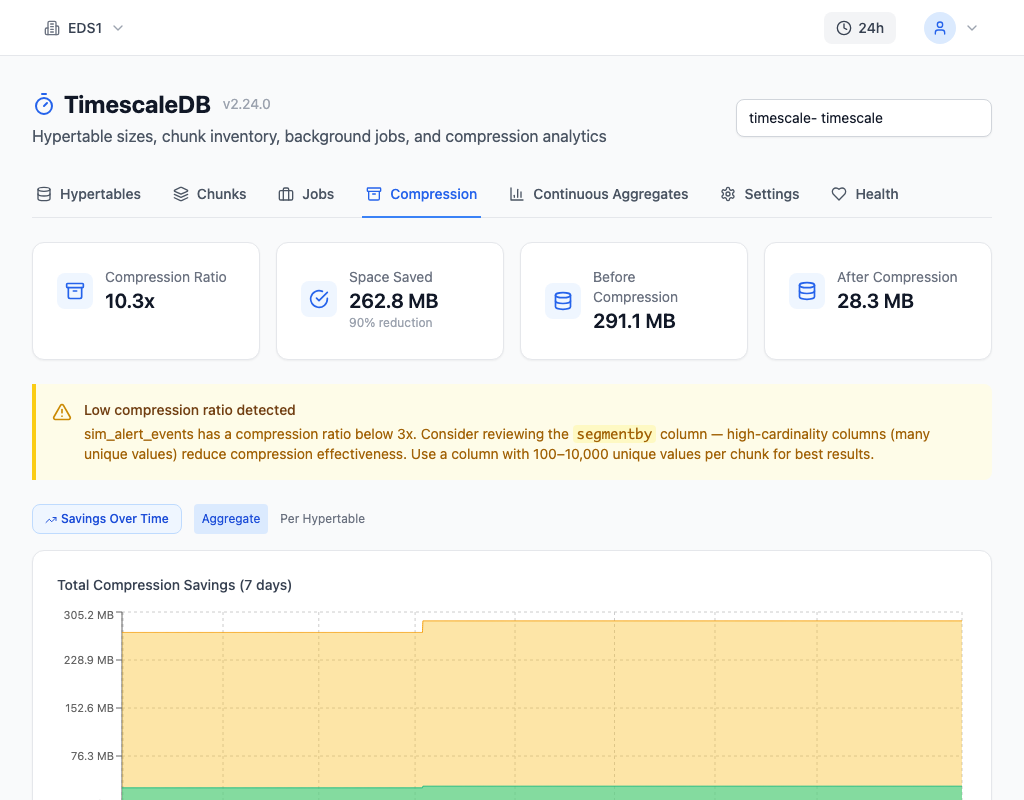
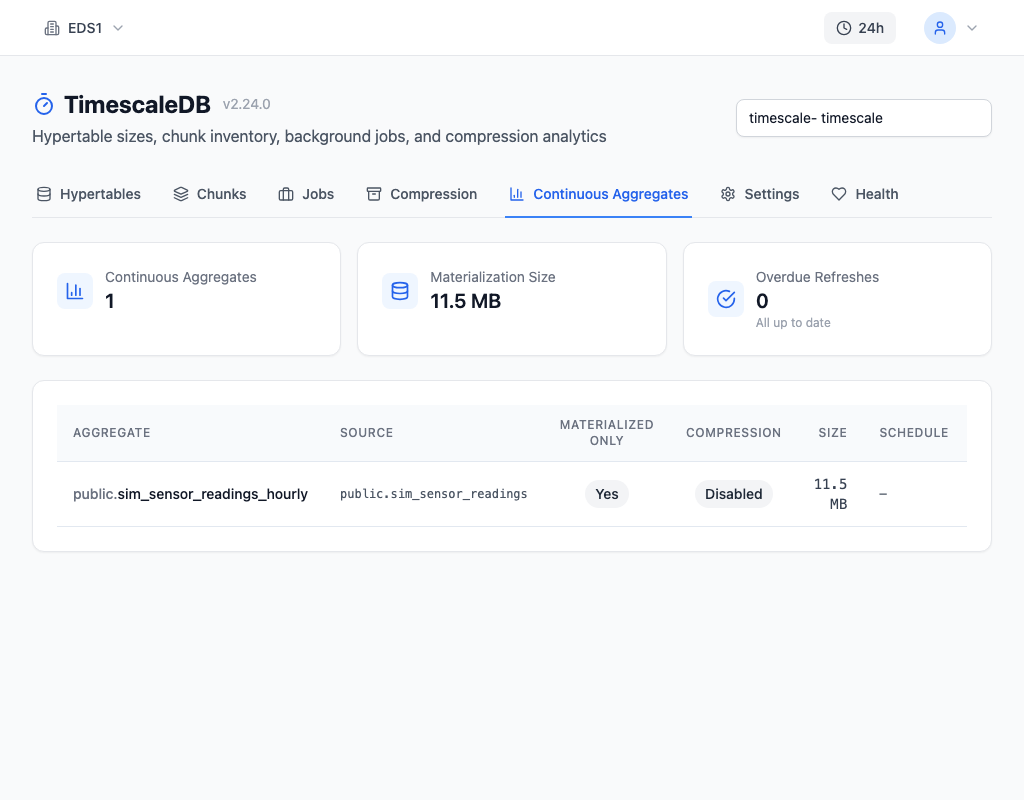
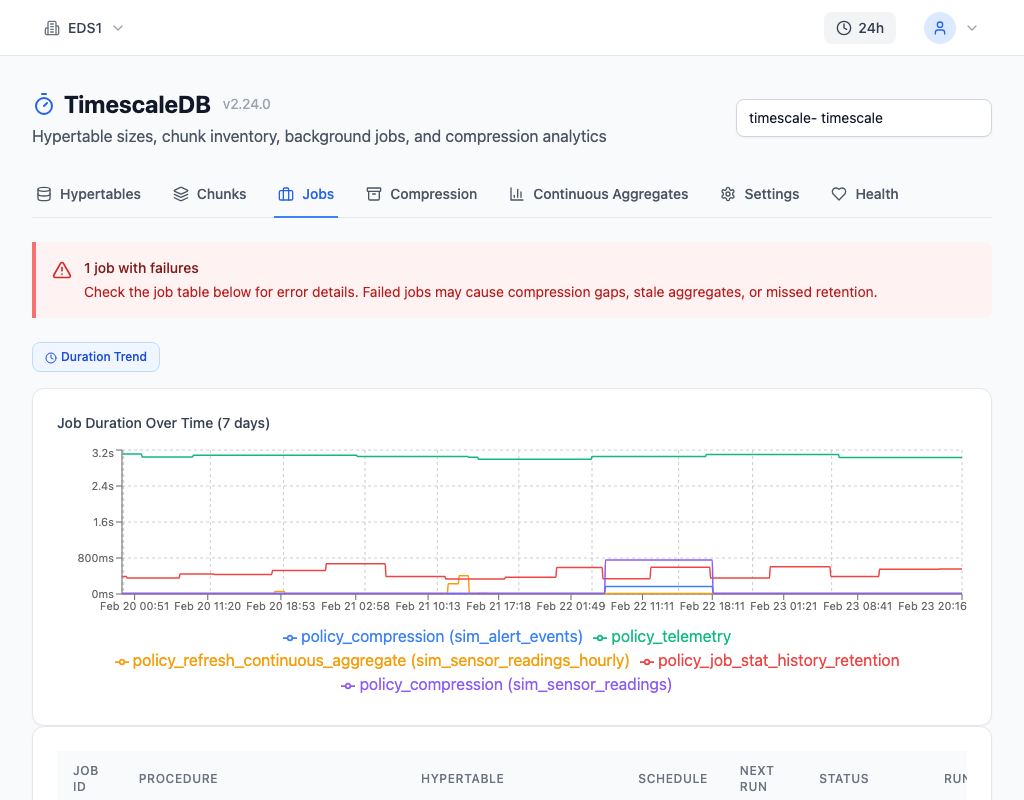
The TimescaleDB section provides 7 dedicated tabs — Hypertables, Chunks, Compression, Continuous Aggregates, Jobs, Settings, and Health — each showing real-time data from the collector that samples your database every 15-60 seconds. The Chunks tab renders a color-coded timeline (green for compressed, orange for uncompressed) that surfaces compression gaps at a glance. The Jobs tab tracks every background worker execution with duration trends and failure counts.
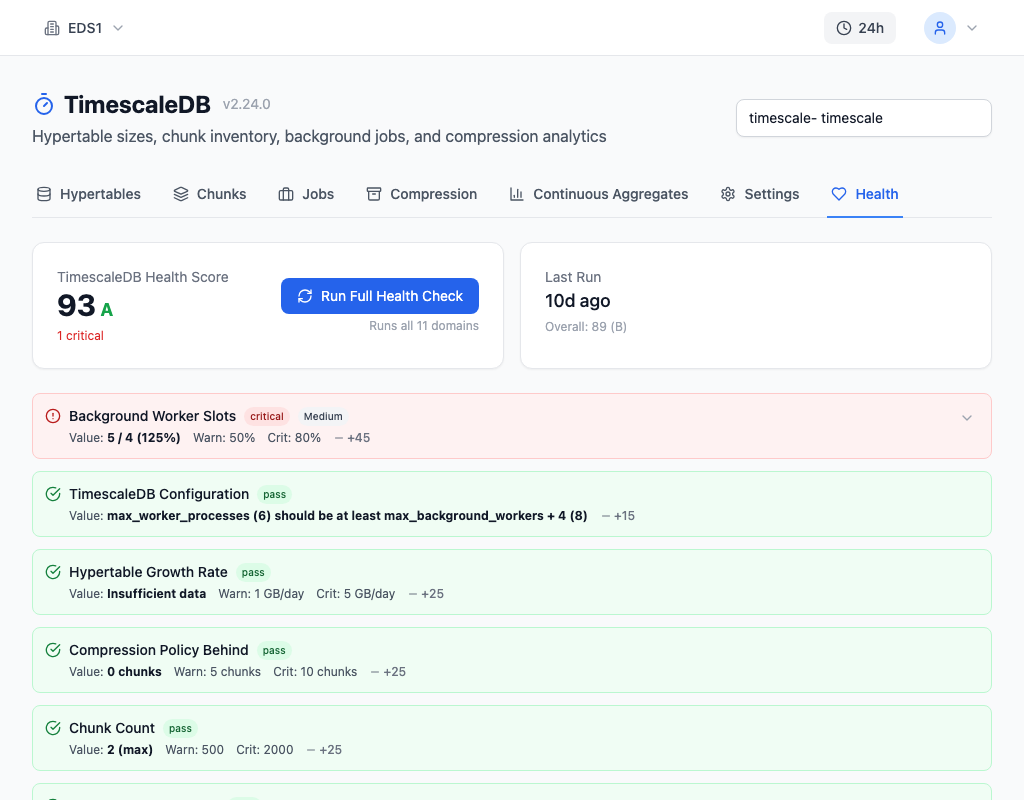
The Health page runs 12 automated checks (T0 through T11) covering every category in this checklist: chunk count thresholds, compression ratio floors, uncompressed chunk percentage, CAGG staleness, worker capacity headroom, retention policy gaps, and more. Each check produces a score with specific remediation guidance — not just "compression is bad" but "hypertable sensor_readings has 23% uncompressed chunks, compression policy last ran 6 hours ago, check background worker availability."
When a check score drops below threshold, myDBA.dev fires an alert through your configured channels (email, Slack, webhook) so you know about the problem while it is still a warning, not an outage.
The Monitoring Pipeline
The pattern is the same for every failure mode in this checklist: collect, detect, alert, fix.
1. Collect the metrics — chunk counts, compression ratios, job statuses, XID ages, disk usage — at regular intervals. 2. Detect anomalies by comparing against known thresholds: chunk count > 500, compression ratio < 3x, CAGG refresh > 2x schedule interval, failed jobs > 0. 3. Alert before the symptom becomes a user-facing problem. Every issue in this checklist has a window of hours to days between first signal and actual impact. 4. Fix with the targeted remediation from the relevant deep-dive article.
TimescaleDB is reliable infrastructure when monitored properly. The failure modes are well-understood, the symptoms are observable, and the fixes are documented. The only thing that turns a manageable signal into a production incident is not watching for it.