Query Planning Overhead with Many Chunks (And How to Fix It)
Query Planning Overhead with Many Chunks (And How to Fix It)
Your simple SELECT takes 500ms but EXPLAIN shows 2ms execution time — the other 498ms is planning time, and it scales linearly with your chunk count. This is the most deceptive performance problem in TimescaleDB because everything looks correct: your indexes are used, your rows are filtered, your execution plan is efficient. The bottleneck is invisible unless you read the first line of EXPLAIN ANALYZE output.
How PostgreSQL Plans Queries Against Hypertables
A hypertable is a virtual table backed by hundreds or thousands of real PostgreSQL tables — chunks — each with a CHECK constraint bounding its time range. When you run a query, the PostgreSQL planner must evaluate every chunk's constraint to determine which ones could contain matching rows. This is called constraint exclusion, and it happens entirely during the planning phase, before a single row is read.
For a hypertable with 100 chunks, the planner evaluates 100 constraints. For 4,000 chunks, it evaluates 4,000. The work is proportional. Each evaluation is cheap individually — a few microseconds — but at scale, microseconds become hundreds of milliseconds.
-- Check how many chunks your hypertable has
SELECT
    hypertable_name,
    count(*) AS total_chunk_count
FROM timescaledb_information.chunks
GROUP BY hypertable_name
ORDER BY total_chunk_count DESC;
If the number coming back is in the thousands, you have a planning time problem whether you've noticed it yet or not.
The Experimental Evidence
In a controlled test, the same dataset was stored in two hypertables: one with 15-minute chunks (producing thousands of chunks over 30 days) and one with 1-day chunks (producing roughly 30). The query was identical — a simple aggregation with a time predicate hitting a single day of data.
EXPLAIN ANALYZE
SELECT
    device_id,
    AVG(metric_value) AS avg_value,
    COUNT(*) AS event_count
FROM experiment_planning_overhead
WHERE event_timestamp_utc >= now() - INTERVAL '1 hour'
GROUP BY device_id
ORDER BY avg_value DESC
LIMIT 10;
The results:
| Configuration | Chunks | Planning Time | Execution Time | |---------------|--------|---------------|----------------| | 15-min interval | ~2,880 | 50-200 ms | 2 ms | | 1-day interval | ~30 | 1-5 ms | 2 ms |
Execution time was identical — the same rows were scanned. But the planner spent 10-100x longer just deciding which chunks to skip. Extrapolated to the larger test with 4,322 chunks: 443ms of planning time for a query that executed in 2ms.
Now remove the time predicate entirely:
-- Without time predicate: every chunk is scanned
EXPLAIN ANALYZE
SELECT
    device_id,
    AVG(metric_value) AS avg_value,
    COUNT(*) AS event_count
FROM experiment_planning_overhead
GROUP BY device_id
ORDER BY avg_value DESC
LIMIT 10;
Without a time predicate, constraint exclusion cannot eliminate any chunks. The planner evaluates all of them, generates an Append node for all of them, and the executor scans every single one. Planning time stays high, and now execution time explodes too because you're doing a full table scan across thousands of child tables. On narrow tables with small rows, this is the worst case: thousands of index scans, one per chunk, with the overhead of opening and closing each chunk's heap file.
Why This Destroys Dashboard Performance
A typical monitoring dashboard loads 10-20 panels simultaneously, each issuing an independent query. If each query incurs 400ms of planning overhead, your dashboard takes 4-8 seconds just in planning — before any data is read. Users experience this as sluggishness that doesn't improve with better hardware, more memory, or additional indexes. The problem is purely in the planner's constraint evaluation loop, and it's CPU-bound.
This is compounded by connection pooling. If your pool uses session mode and reprepares statements on checkout, each new session pays the full planning cost again. Even with prepared statements, the initial PREPARE still evaluates all constraints.
The Fixes
Always include time predicates
This is the single most impactful change. Every query against a hypertable should include a WHERE clause on the partitioning column. Even if you're filtering by device_id, sensor_name, or any other column, always bound the time range:
-- Bad: scans every chunk
SELECT * FROM sensor_readings WHERE device_id = 42;

-- Good: constraint exclusion limits to ~7 chunks
SELECT * FROM sensor_readings
WHERE device_id = 42
  AND recorded_at >= now() - INTERVAL '7 days';
Time predicates don't just reduce execution cost — they allow the planner to skip constraint evaluation for chunks that are obviously outside the range. TimescaleDB's ChunkAppend optimization handles this more efficiently than PostgreSQL's generic partition pruning, but it still benefits from fewer chunks to consider.
Use retention policies to cap chunk count
The most reliable way to bound chunk count is to drop old chunks automatically:
SELECT add_retention_policy('sensor_readings', drop_after => INTERVAL '30 days');With a 1-day chunk interval and 30-day retention, you'll never exceed ~30 chunks per hypertable. With a 1-hour interval and the same retention, you cap at ~720 — still manageable. The point is that retention policies create a ceiling. Without one, chunk count grows indefinitely.
Increase chunk_time_interval
If your chunks are too small, increase the interval going forward:
SELECT set_chunk_time_interval('sensor_readings', INTERVAL '1 day');This only affects future chunks. Existing small chunks remain until they age out of your retention window. If you need to consolidate historical data immediately, you'll need to create a new hypertable with the correct interval and copy the data over.
Use prepared statements for plan caching
Prepared statements cache the query plan after the first execution. Subsequent calls skip the planning phase entirely:
PREPARE device_query(int, interval) AS
SELECT AVG(metric_value)
FROM sensor_readings
WHERE device_id = $1
  AND recorded_at >= now() - $2;

EXECUTE device_query(42, '7 days');  -- First call plans; subsequent calls reuse the plan
This eliminates planning overhead for repeated queries — common in application code and dashboards — but doesn't help ad-hoc or one-off queries.
How myDBA.dev Catches This
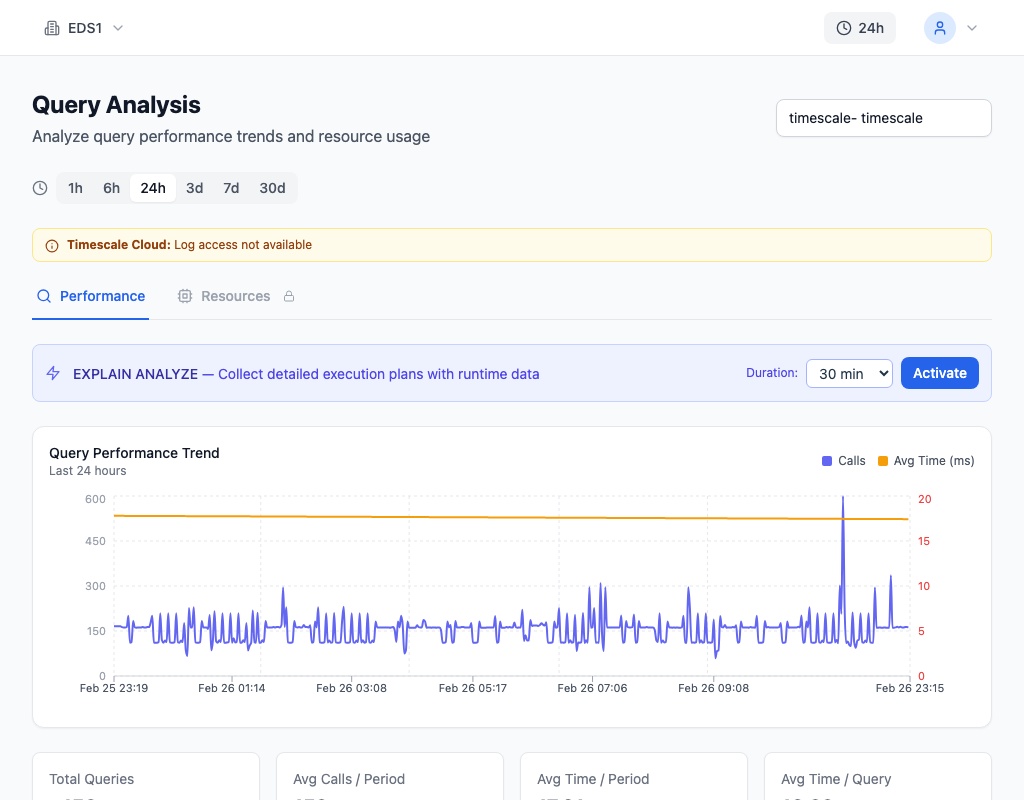
myDBA.dev's EXPLAIN Visualizer breaks down planning time versus execution time for every captured query, making it immediately obvious when planning dominates total duration. Health Check T2 monitors chunk counts across all hypertables and warns before they cross the threshold where planning overhead starts to compound.
The Rule
Every WHERE clause on a hypertable should include a time predicate. Not because it's a nice optimization — because without it, the planner does work proportional to your entire history, every single time. Bound the time range, cap the chunk count, and planning overhead stays in the single-digit milliseconds where it belongs.