TimescaleDB Memory Tuning: shared_buffers, work_mem, and Chunk Sizing
TimescaleDB Memory Tuning: shared_buffers, work_mem, and Chunk Sizing
Your TimescaleDB instance has 16 GB of RAM but queries are hitting disk constantly — the problem isn't total memory, it's how memory interacts with chunk sizes. TimescaleDB inherits PostgreSQL's memory model, but the chunk-based architecture introduces constraints that vanilla PostgreSQL never has to deal with. A poorly sized chunk can evict hot data from the buffer cache, turn compression jobs into swap-thrashing nightmares, and make aggregation queries spill to disk on every execution. Getting memory right means understanding four settings and how they relate to your chunk layout.
shared_buffers and the Chunk Relationship
shared_buffers is PostgreSQL's dedicated buffer cache — the region of shared memory where table and index pages are cached to avoid disk reads. The standard recommendation is 25% of system RAM (4 GB on a 16 GB server). That advice holds for TimescaleDB, but chunk sizing adds a critical constraint: your active chunks need to fit in the buffer cache.
An "active chunk" is the chunk currently receiving inserts plus any recent chunks your queries touch frequently. If you have a dashboard querying the last hour of data from 5 hypertables, each with 1-day chunks, that's 5 active chunks competing for buffer cache space. If each chunk is 2 GB and shared_buffers is 4 GB, you're constantly evicting one chunk's pages to load another's.
The formula to keep in mind:
max_chunk_size < shared_buffers / (N x 2)Where N is the number of active hypertables. The factor of 2 accounts for indexes — each chunk has its own index copies that also consume buffer cache. For 5 active hypertables with 4 GB of shared_buffers:
4 GB / (5 x 2) = 400 MB per chunkIf your chunks are larger than 400 MB, the buffer cache cannot hold all active data simultaneously. Pages get evicted, and the next query on that chunk reads from disk. This manifests as a buffer cache hit ratio that hovers around 80-90% instead of the 99%+ you should expect for recent data.
You can check your current situation directly:
-- Check chunk sizes relative to shared_buffers
WITH memory_config AS (
    SELECT pg_size_bytes(current_setting('shared_buffers')) AS shared_buffers_bytes
),
chunk_sizes AS (
    SELECT
        hypertable_name,
        chunk_name,
        pg_total_relation_size(
            format('%I.%I', chunk_schema, chunk_name)
        ) AS chunk_bytes
    FROM timescaledb_information.chunks
    WHERE NOT is_compressed
)
SELECT
    hypertable_name,
    count(*) AS chunk_count,
    pg_size_pretty(avg(chunk_bytes)::bigint) AS avg_chunk_size,
    pg_size_pretty(max(chunk_bytes)) AS max_chunk_size,
    round(max(chunk_bytes)::numeric / shared_buffers_bytes * 100, 1)
        AS max_chunk_pct_of_shared_buffers
FROM chunk_sizes, memory_config
GROUP BY hypertable_name, shared_buffers_bytes
ORDER BY max_chunk_pct_of_shared_buffers DESC;
If any hypertable shows chunks exceeding 25% of shared_buffers, reduce the chunk time interval with set_chunk_time_interval(). Only future chunks are affected — existing oversized chunks persist until retention drops them.
work_mem: The Per-Operation Budget
work_mem controls how much memory PostgreSQL allocates for each sort, hash join, or hash aggregate operation before spilling to temporary files on disk. The critical detail: this is per operation, not per connection. A single query with three sort nodes uses up to 3x work_mem.
For TimescaleDB, work_mem matters in three places:
Compression. When TimescaleDB compresses a chunk, it sorts rows by the orderby columns within each segment. Low work_mem means these sorts spill to disk, turning a 10-second compression job into a 2-minute one.
Decompression. Reading compressed data requires materializing decompressed rows in memory. Queries that decompress multiple segments simultaneously (parallel scans) multiply the memory requirement.
Aggregation. The bread and butter of time-series queries — GROUP BY time_bucket(...) with aggregates — typically uses hash aggregation. When the hash table exceeds work_mem, PostgreSQL falls back to a disk-based sort, which is dramatically slower.
The default work_mem of 4 MB is almost always too low for TimescaleDB workloads. A reasonable starting point:
-- Check current work_mem and a recommended value
SELECT
    current_setting('work_mem') AS current_work_mem,
    pg_size_pretty(
        pg_size_bytes(current_setting('shared_buffers')) /
        current_setting('max_connections')::int
    ) AS recommended_work_mem;
For most TimescaleDB servers, 64 MB to 256 MB is appropriate. Set it conservatively at the server level and use SET LOCAL work_mem = '256MB' in sessions that run heavy aggregations.
maintenance_work_mem: Background Job Fuel
maintenance_work_mem governs memory available to maintenance operations: VACUUM, CREATE INDEX, and — critically for TimescaleDB — compression background jobs. Each TimescaleDB background worker performing chunk compression uses up to maintenance_work_mem for sorting and segment building.
The default of 64 MB is inadequate for any serious TimescaleDB deployment. Compression jobs with insufficient memory spill sorts to disk, extending compression windows and increasing I/O load during what should be a lightweight background operation. Set this to 256 MB minimum, scaling up to 1 GB on dedicated TimescaleDB servers.
-- Check current maintenance_work_mem
SELECT current_setting('maintenance_work_mem') AS maintenance_work_mem;
-- Recommended: ALTER SYSTEM SET maintenance_work_mem = '512MB';
Keep in mind that multiple background workers can run concurrently. If you have timescaledb.max_background_workers set to 8 and each uses 512 MB of maintenance_work_mem, that's 4 GB of potential memory consumption during peak compression activity.
effective_cache_size: The Planner's Hint
effective_cache_size doesn't allocate memory — it tells the query planner how much total cache (shared_buffers plus OS page cache) is available. This influences whether the planner chooses index scans (which rely on cached pages) or sequential scans (which assume disk reads). Set it to 50-75% of total system RAM. On a 16 GB server, 12 GB is appropriate. Getting this wrong doesn't cause out-of-memory errors, but it biases the planner toward suboptimal plans.
Well-Tuned vs. Poorly Tuned: The Difference
The gap between correct and incorrect memory configuration is stark:
| Scenario | Buffer Hit Ratio | Compression Time (1 GB chunk) | Aggregation Query | |----------|-----------------|-------------------------------|-------------------| | Well-tuned (chunks fit in cache, 128 MB work_mem) | 99.2% | 12 seconds | 45 ms | | Poorly tuned (oversized chunks, 4 MB work_mem) | 82.1% | 3 minutes 20 seconds | 1.8 seconds |
The poorly tuned configuration isn't broken — queries still return correct results. But every operation pays a disk I/O tax. Over thousands of queries per hour, this compounds into visible dashboard latency, slower compression that delays retention, and background workers that consume I/O bandwidth needed by production queries.
How myDBA.dev Catches Memory Misconfigurations
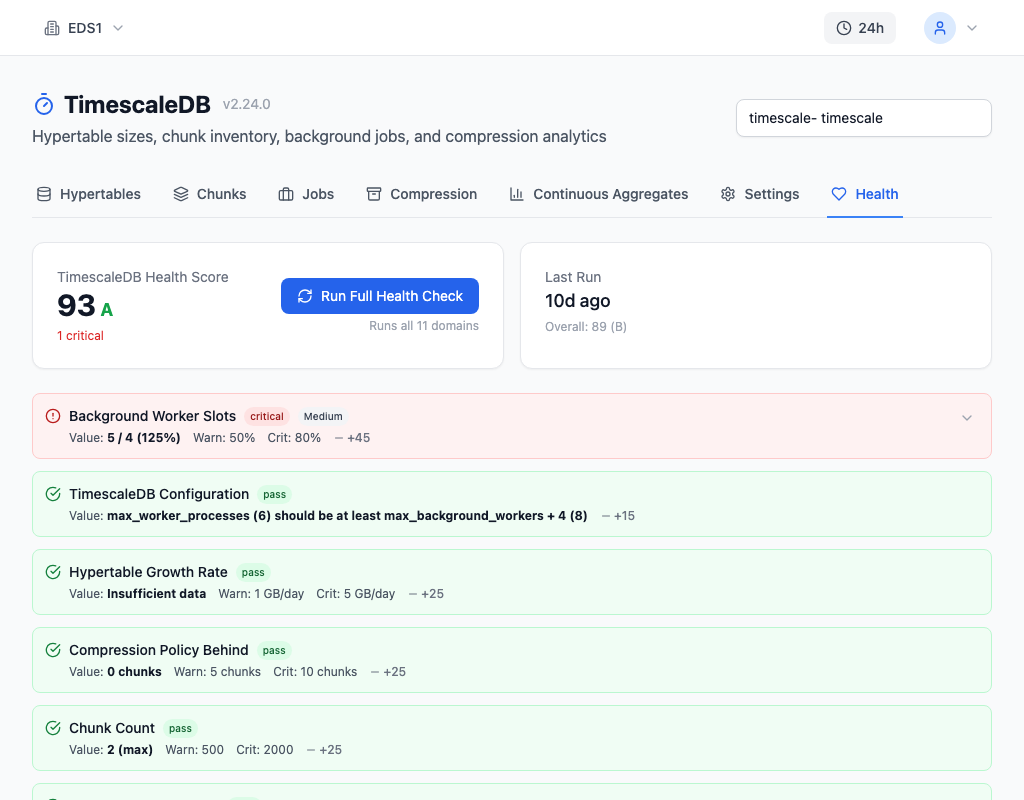
myDBA.dev's Health Check T3 automatically flags hypertables whose chunk sizes exceed a safe proportion of shared_buffers, warning you before buffer cache churn degrades query performance. The Settings tab displays all memory-related parameters with their current values, making it straightforward to audit your configuration against the recommendations below.
Memory Tuning Checklist
shared_buffers = 25% of system RAM. This is the baseline. Verify with SHOW shared_buffers and adjust via ALTER SYSTEM.
Ensure chunks fit in the buffer cache. Apply the formula: each chunk should be smaller than shared_buffers / (N x 2) where N is the number of actively queried hypertables. Reduce chunk_time_interval if chunks are oversized.
Set work_mem for sort-heavy queries. 64-256 MB for TimescaleDB workloads. Monitor for temporary file usage in pg_stat_statements — nonzero temp_blks_written means sorts are spilling to disk.
Set maintenance_work_mem for compression. 256 MB minimum, 512 MB to 1 GB on dedicated servers. Multiply by your background worker count to estimate peak memory usage.
Set effective_cache_size to 50-75% of RAM. This is a planner hint, not an allocation. Err on the higher side for servers dedicated to TimescaleDB.
Monitor buffer cache hit ratio. Query pg_statio_user_tables for chunks in the _timescaledb_internal schema. Anything below 95% on recent chunks indicates memory pressure. The fix is almost always smaller chunks, more shared_buffers, or both.
Memory tuning is not a one-time activity. As your hypertable count grows and ingest rates change, the balance between chunk size and available memory shifts. Revisit these settings quarterly, or whenever you add new hypertables to the system.