Why is COUNT(*) slow in PostgreSQL and how do you make it fast?
Because PostgreSQL's MVCC means row visibility is per-transaction: two concurrent sessions can correctly see different totals, so there is no single row count to cache. Every COUNT(*) must check visibility for the rows it counts. An index-only scan can do that from the visibility map, but only for pages already marked all-visible by vacuum.
Key facts
| Fact | Value | |---|---| | Why no cached count exists | Each transaction sees its own snapshot; a row version can be visible to one session and not another (docs) | | What makes a count skippable | The visibility map's all-visible bit, set by vacuum, one bit per heap page (docs) | | The plan line to read | Heap Fetches: N under an Index Only Scan — rows the map could not vouch for (docs) | | COUNT() vs COUNT(col) | count() counts input rows; count(expression) counts rows where the expression is non-null (docs) | | Free estimate | pg_class.reltuples, refreshed by VACUUM, ANALYZE and CREATE INDEX (docs) | | How stale that estimate can get | Autovacuum waits for autovacuum_vacuum_scale_factor, default 0.2, plus 50 rows (docs) | | Statistical sampling | TABLESAMPLE SYSTEM (n) / BERNOULLI (n) in the FROM clause (docs) | | Measured here | Updating 8.3% of a 5,000,000-row table left 0 of 128,969 heap pages all-visible, taking the same index-only count from 398 ms to 1,236 ms | | Fleet data | Across 50 monitored instances, 28% fail the dead-tuple check and 8% show stale autovacuum — both of which degrade an index-only count |
Why this happens
MySQL with MyISAM could answer SELECT count(*) FROM t instantly because the table header held a row count, and there was only ever one answer to hold. PostgreSQL cannot, and that is not an oversight. Under MVCC each transaction works against a snapshot (docs). A session that started before a bulk delete committed still correctly sees those rows; one that started after does not. Both counts are right, so a single cached integer would have to be wrong for one of them.
The count is therefore derived, not stored, and deriving it means deciding visibility row by row. The xmin/xmax fields carrying that decision live in the heap tuple header (docs), not in any index — which is why an index alone cannot normally answer a count.
The partial escape is the visibility map: two bits per heap page, one of which says "every tuple on this page is visible to every transaction" (docs). Vacuum sets that bit. When the planner can satisfy a query entirely from an index and the map says the page is all-visible, it skips the heap access — an index-only scan (docs). The count still checks visibility, just a page at a time from a much smaller structure.
The catch is in the mechanism. Because the map is maintained by vacuum, a recently-written table has pages it cannot vouch for, and the scan falls back to fetching those heap rows individually — reported as Heap Fetches. The measurements below show such a scan losing to the sequential scan it replaced. Across 50 monitored instances in our own fleet, 28% fail the dead-tuple ratio check and 24% fail the table-bloat check, both symptoms of vacuum falling behind.
How to detect it
Run the count with buffers. In PostgreSQL 18 ANALYZE enables BUFFERS implicitly, but being explicit costs nothing (docs):
SET max_parallel_workers_per_gather = 0;   -- one plan shape at a time, for readability
SET jit = off;
EXPLAIN (ANALYZE, BUFFERS) SELECT count(*) FROM orders;
Every plan below was captured on a throwaway PostgreSQL 18.3 container (default shared_buffers 128MB, work_mem 4MB) against a 5,000,000-row orders table: 930 MB of heap in 119,048 pages, plus a 107 MB primary-key index in 13,712 pages. Parallelism and JIT are off so the plans stay two nodes tall. Each statement was run repeatedly; the output shown is warm.
With no index on the table at all:
 Aggregate  (cost=181548.20..181548.21 rows=1 width=8) (actual time=441.164..441.167 rows=1.00 loops=1)
   Buffers: shared hit=2355 read=116693
   ->  Seq Scan on orders  (cost=0.00..169048.16 rows=5000016 width=0) (actual time=0.063..273.117 rows=5000000.00 loops=1)
         Buffers: shared hit=2355 read=116693
 Planning Time: 0.059 ms
 Execution Time: 441.191 ms
119,048 buffers is the whole table, read to produce one integer. Note width=0: the scan returns no column data, only visibility decisions. The cold first run took 2,005 ms.
Now add the primary key back, VACUUM, and run it again:
 Aggregate  (cost=142351.61..142351.62 rows=1 width=8) (actual time=398.438..398.439 rows=1.00 loops=1)
   Buffers: shared hit=13668
   ->  Index Only Scan using orders_pkey on orders  (cost=0.43..129851.73 rows=4999953 width=0) (actual time=0.012..241.685 rows=5000000.00 loops=1)
         Heap Fetches: 0
         Index Searches: 1
         Buffers: shared hit=13668
 Planning Time: 0.046 ms
 Execution Time: 398.462 ms
Heap Fetches: 0 says the visibility map answered for every page, and 13,668 buffers instead of 119,048 is what that bought.
One thing worth being honest about: that is 8.7x fewer buffers for a 10% speedup, 398 ms against 441 ms. Warm, counting 5,000,000 rows is dominated by CPU rather than page access, and the index-only scan cannot help with that. The win appears when the pages are not cached — the cold runs were 446 ms against 2,005 ms, 4.5x. Judge an index-only count by the buffer numbers, not by a warm stopwatch.
Now update 416,666 rows — 8.3% of the table, scattered one row in twelve — and run the identical statement before vacuum catches up:
 Aggregate  (cost=159567.46..159567.47 rows=1 width=8) (actual time=1236.023..1236.024 rows=1.00 loops=1)
   Buffers: shared hit=1449997 read=142636 written=16271
   ->  Index Only Scan using orders_pkey on orders  (cost=0.43..146025.88 rows=5416630 width=0) (actual time=0.046..1092.270 rows=5000000.00 loops=1)
         Heap Fetches: 5000000
         Index Searches: 1
         Buffers: shared hit=1449997 read=142636 written=16271
 Planning Time: 0.065 ms
 Execution Time: 1236.055 ms
Same plan shape, same index, Heap Fetches: 5000000 — not 8.3% of the rows but all of them. Because the updates were scattered rather than clustered, almost every heap page held at least one modified tuple, and one unvouched-for tuple disqualifies the page. The pg_visibility extension confirms it: 0 of 128,969 pages carried the all-visible bit.
The cost is worse than "index-only" suggests: roughly 1.59 million buffer accesses, thirteen times the sequential scan's 119,048, at 1,236 ms — 2.8x slower than the sequential scan and 3.1x slower than its own clean self. A single VACUUM (ANALYZE) restored all 128,969 pages and put Heap Fetches back to 0.
The COUNT(1) myth, settled with a plan. count(*) and count(1) produce the same node at the same cost, cost=179128.56..179128.57 with width=0, and timings that overlap across repeated runs (392–415 ms and 415–420 ms). There is no difference to find. count(order_id) reports width=8 and count(customer_reference) width=15, because those plans must read the column:
 Aggregate  (cost=179128.56..179128.57 rows=1 width=8) (actual time=515.062..515.063 rows=1.00 loops=1)
   Buffers: shared hit=1102 read=115528
   ->  Seq Scan on orders  (cost=0.00..166628.85 rows=4999885 width=15) (actual time=0.007..273.025 rows=5000000.00 loops=1)
         Buffers: shared hit=1102 read=115528
 Planning Time: 0.189 ms
 Execution Time: 515.094 ms
The timing gap is small and not the point. The answer is: count(*) returns 5,000,000 here and count(customer_reference) returns 4,500,000, because count(expression) counts rows where the expression is non-null (docs). There is no performance reason to prefer count(1), and a correctness reason to be careful with count(col).
How MyDBA shows this
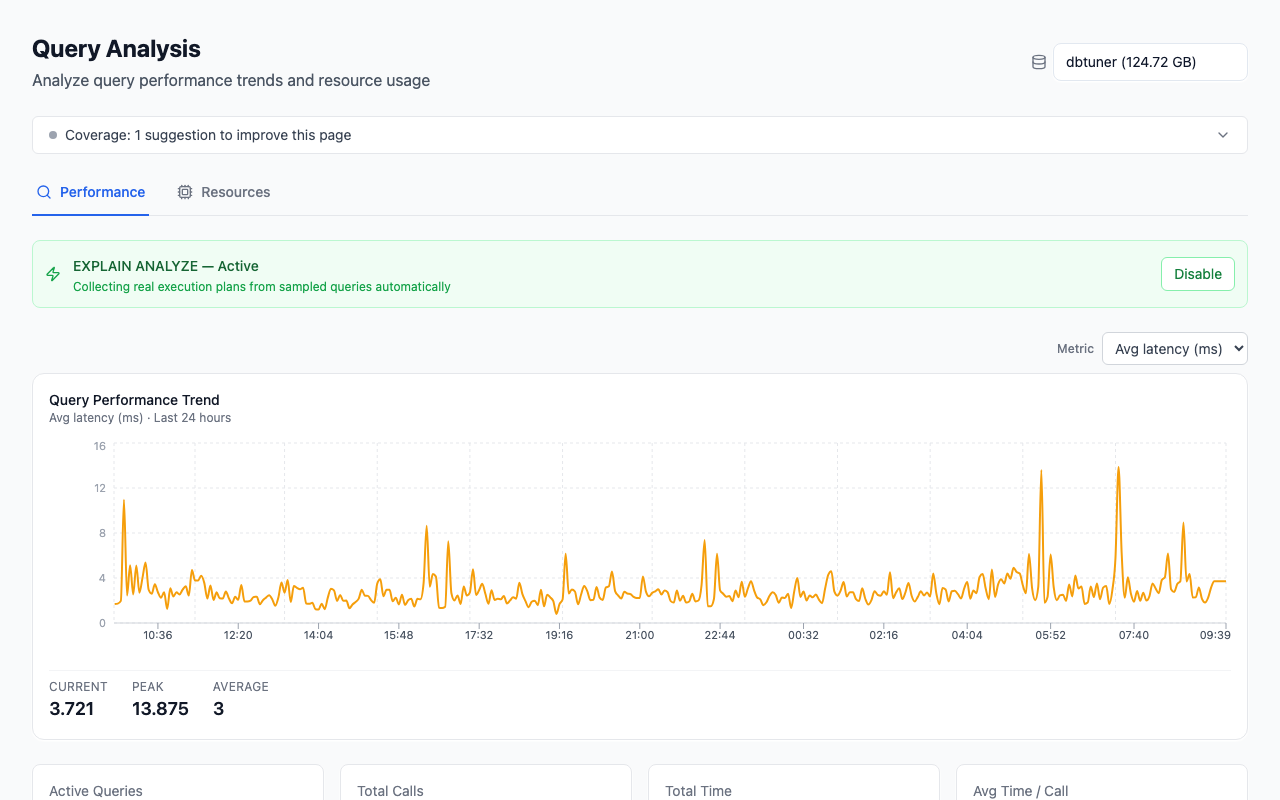
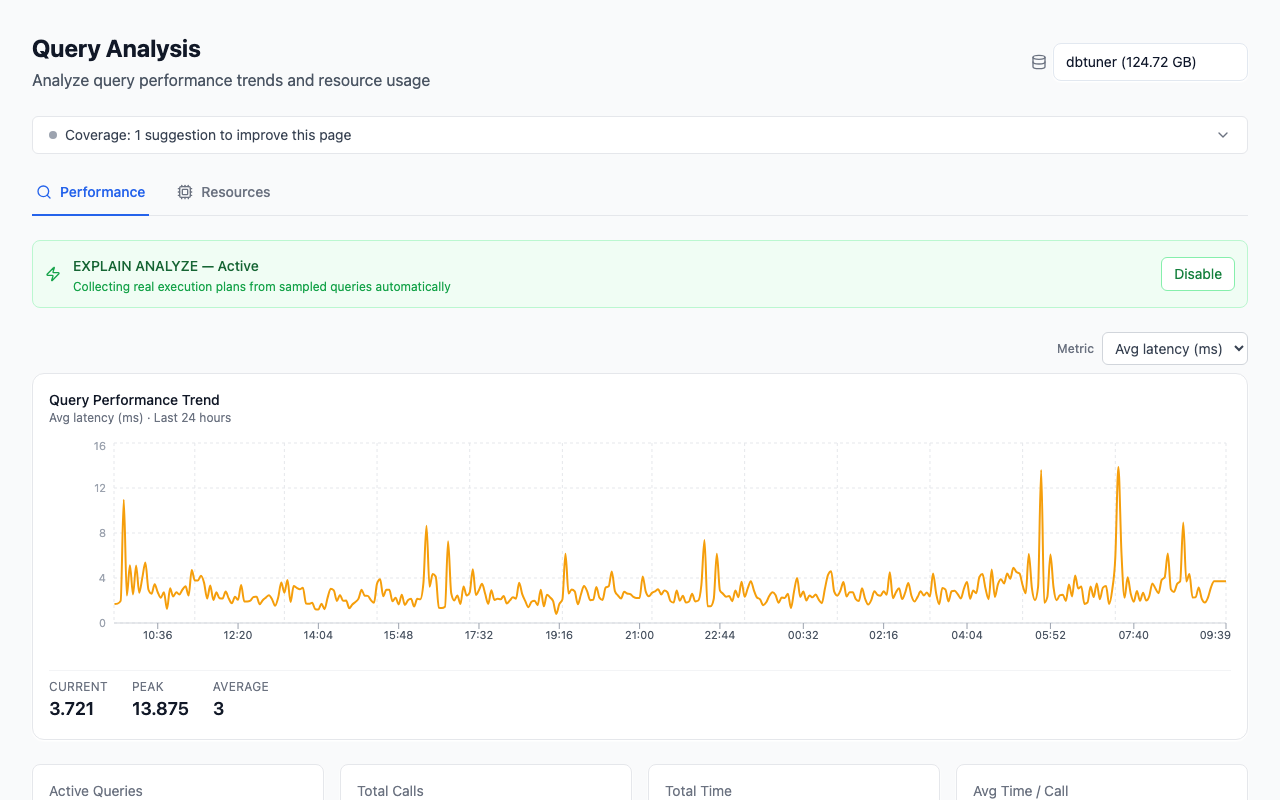
MyDBA ranks query templates by absolute period total time rather than mean duration, which is the ordering that surfaces a count: a 400 ms COUNT(*) looks survivable alone and dominates the list once the application issues it on every page load, with calls shown beside total time so the two are read together. The collected plan keeps the Heap Fetches counter from the run that was actually slow, and the vacuum and dead-tuple views sit next to it because a rising Heap Fetches is usually a vacuum story rather than a query story — across 50 monitored instances, 28% fail the dead-tuple check and 8% show stale autovacuum. For the same reading on your own instance, the free PostgreSQL health check scores vacuum, bloat and query totals together.
How to fix it
1. Ask whether the number has to be exact. Most totals live in a pagination footer or a dashboard tile nobody reconciles, where "about 5 million" is as useful and free.
2. Use pg_class.reltuples for an unfiltered estimate.
SELECT reltuples::bigint AS estimated_rows
FROM pg_class WHERE oid = 'orders'::regclass;
Immediately after ANALYZE this returned 4,999,920 against a true 5,000,000 — 0.0016% low, for no I/O. It is refreshed by VACUUM, ANALYZE and CREATE INDEX (docs), which sets the staleness bound: autovacuum waits until changed rows exceed autovacuum_vacuum_scale_factor (default 0.2) of the table plus 50 (docs), so it can drift by a fifth before anything refreshes it. A -1 means the table was never analysed.
3. For a filtered count, read the planner's own estimate. EXPLAIN without ANALYZE costs a planning cycle and no execution. For WHERE status = 'refunded' the planner estimated 1,008,651 rows against a true 1,000,000 — 0.87% high. It comes from the same statistics used to choose plans; see how the planner uses table statistics for when to trust it, and raise default_statistics_target when it is consistently off (docs).
4. For a filtered count that must be exact, index the filter. This is where a count genuinely can be made fast. That WHERE status = 'refunded' count took 285 ms as a sequential scan over 116,630 buffers; with a partial index on (order_id) WHERE status = 'refunded' it became an Index Only Scan with Heap Fetches: 0 at 91 ms — 3.1x faster, because the index is the answer set. A covering index with INCLUDE does the same job when the predicate needs a second column. Both still depend on the visibility map, so both still report Heap Fetches.
5. Maintain a counter table only when you have measured the need. An AFTER INSERT OR DELETE trigger incrementing one row serialises every writer on it: concurrent inserts block each other, and the row bloats by a dead tuple per update. The usual mitigation — insert deltas and sum them periodically — trades that contention for a second job to operate.
6. Refresh a materialised view on a schedule when the number is expensive and a few minutes of staleness is acceptable (docs). REFRESH MATERIALIZED VIEW CONCURRENTLY avoids locking readers but needs a unique index.
7. Sample when an approximation with known error is enough.
SELECT count(*) * 100 AS estimated_rows FROM orders TABLESAMPLE SYSTEM (1);This returned 4,849,400 against 5,000,000 — 3.0% low, from 1% of the pages. SYSTEM samples pages, fast but clustered; BERNOULLI samples rows, slower but less biased (docs).
How to prevent it
Vacuum is the lever. An index-only count degrades quietly as the visibility map falls behind, and the measurement above is the warning: 8.3% of rows changed stripped the all-visible bit from every page. Lower autovacuum_vacuum_scale_factor on large, frequently-updated tables — the default 0.2 means a 50-million-row table waits for 10 million changes (docs) — using per-table storage parameters rather than the global setting.
Watch Heap Fetches over time rather than the plan shape; a plan keeps saying Index Only Scan long after it stopped behaving like one.
On the application side, stop asking for counts you do not display. Offset-based pagination is the usual source and has a second cost of its own — see why OFFSET pagination gets slow. Keyset pagination removes both the offset scan and the total in one change, if the UI can live without a page count.
FAQ
Is COUNT(1) faster than COUNT(*) in PostgreSQL?
No. Measured on a 5,000,000-row table they produce the same node at the identical cost (cost=179128.56..179128.57, width=0) with overlapping timings, because neither evaluates a column (docs). The difference appears only with count(some_column), which skips NULLs and answers a different question.
Why is my index-only scan still reading the heap?
Because the visibility map could not vouch for those pages. It is maintained by vacuum (docs), so recently-written pages are not all-visible and the scan fetches each row from the heap to check; Heap Fetches: N counts those. Scattered updates are the worst case: changing one row in twelve left 0 of 128,969 pages all-visible, and Heap Fetches rose to every row in the table.
Does VACUUM FULL fix a degraded index-only count?
Not on its own, which surprised us. VACUUM FULL rewrites the table but leaves the new heap's visibility map empty — 0 of 116,630 pages all-visible immediately afterwards, with the planner dropping back to a sequential scan for count(*). A plain VACUUM then set all 116,630 pages and restored the index-only plan.
How accurate is pg_class.reltuples?
It is near-exact immediately after VACUUM or ANALYZE — 4,999,920 against a true 5,000,000 on the test table — and drifts from there. The default autovacuum_vacuum_scale_factor of 0.2 means up to a fifth of the table can change before a refresh is triggered (docs), so treat it as a figure with a percentage-scale error bar, not one to show an accountant.
Part of the Reading PostgreSQL EXPLAIN and EXPLAIN ANALYZE Output guide. Last verified against PostgreSQL 18, 2026-09-17.