Why ON DELETE CASCADE Slows Postgres to a Crawl
The page: "DELETE has been running for 40 minutes"
Short answer: if a DELETE with ON DELETE CASCADE is slow, the child table almost certainly has no index on the foreign key column. Postgres indexes the referenced side of a foreign key automatically but never the referencing side, so every cascaded delete forces a full sequential scan of the child table, once per deleted parent row. On a table with hundreds of millions of rows, that turns a four-second cleanup job into a multi-hour lock queue. Below is how that actually played out, how to catch it in pg_stat_activity, and the fix — index the column, batch the delete, and watch CREATE INDEX CONCURRENTLY progress so it doesn't turn into a second outage.
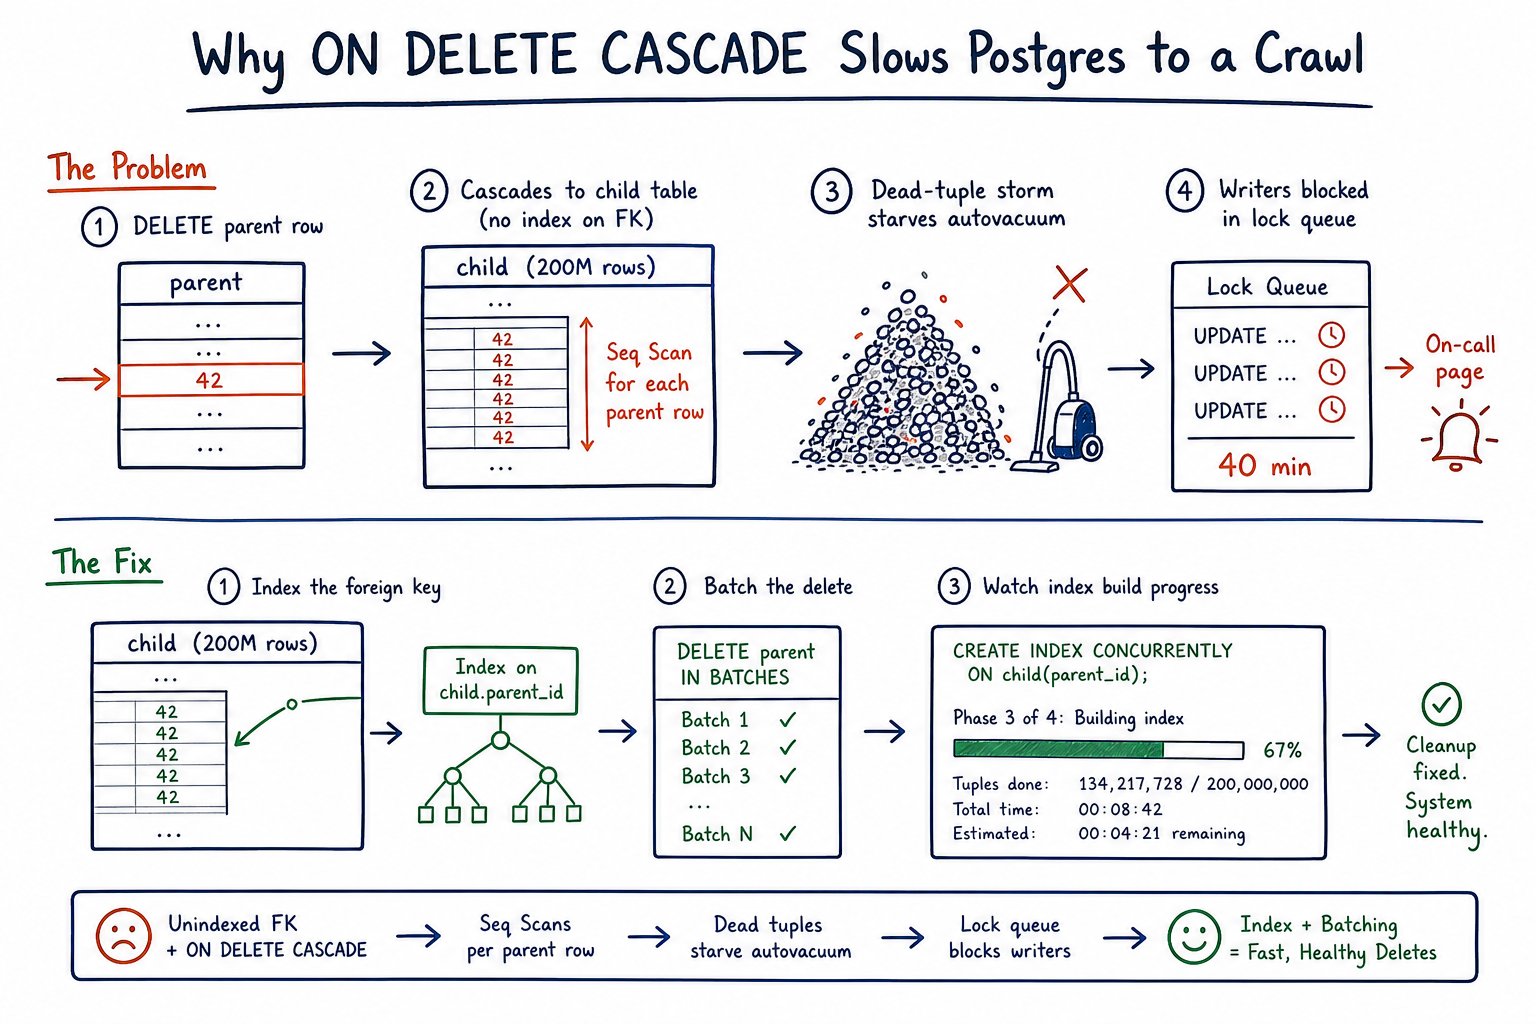
02:15 UTC, the nightly cleanup job fires. It's a small thing: delete accounts that have been soft-deleted for more than 180 days. On a normal night it removes somewhere between 400 and 900 rows and finishes in under four seconds.
02:57 UTC, PagerDuty. Alert text: pg-prod-01: transactions waiting on locks > 300s (count: 61).
I got to a laptop at 03:01. By then the application was returning 504s on any endpoint that wrote to the events table, which on this system is most of them. The cleanup job was still running. It had been running for 42 minutes.
The relevant schema, sanitized:
-- accounts: ~2.1M rows
-- events:   ~204M rows, partitioned by nothing, one big heap

ALTER TABLE events
  ADD CONSTRAINT events_account_id_fkey
  FOREIGN KEY (account_id) REFERENCES accounts(id)
  ON DELETE CASCADE;
That ON DELETE CASCADE is the whole story. The rest of this is me finding that out at three in the morning.
First look: pg_stat_activity and the lock queue
First query, always the same one. I don't bother with dashboards until I know whether the database is busy or blocked.
> Diagnostic: who is running, who is waiting > ``sql > SELECT pid, > now() - xact_start AS xact_age, > state, > wait_event_type, > wait_event, > pg_blocking_pids(pid) AS blocked_by, > left(query, 60) AS query > FROM pg_stat_activity > WHERE state <> 'idle' > ORDER BY xact_start; > ``
Output, trimmed to the interesting rows:
  pid  |    xact_age     | state  | wait_event_type |  wait_event   | blocked_by |                    query
-------+-----------------+--------+-----------------+---------------+------------+----------------------------------------------
 21874 | 00:42:11.402913 | active | IO              | DataFileRead  | {}         | DELETE FROM accounts WHERE deleted_at < now(
 22910 | 00:11:48.220104 | active | Lock            | transactionid | {21874}    | INSERT INTO events (account_id, kind, payloa
 22913 | 00:11:47.913887 | active | Lock            | transactionid | {21874}    | INSERT INTO events (account_id, kind, payloa
 22931 | 00:11:44.008812 | active | Lock            | tuple         | {22910}    | UPDATE events SET processed_at = now() WHERE
 23004 | 00:09:02.771190 | active | Lock            | transactionid | {21874}    | INSERT INTO events (account_id, kind, payloa
 23188 | 00:06:15.339022 | active | Lock            | transactionid | {21874}    | DELETE FROM events WHERE created_at < now()
 ...   | (56 more rows)  |        |                 |               |            |
pid 21874 is the cleanup job. Its blocked_by is empty, so nothing is blocking it — it's just working, and wait_event_type = IO with DataFileRead means it's reading heap pages off disk. That's already a hint: a delete that touches a few hundred parent rows should not be grinding through data files for 42 minutes.
Everything else has wait_event_type = Lock. pg_blocking_pids() resolves the chain for you, which saves the old joyless join against pg_locks on (locktype, database, relation, transactionid, ...). Note pid 22931: it's blocked by 22910, which is itself blocked by 21874 — a two-deep chain. The root is always the pid that appears in other rows' blocked_by but has an empty blocked_by of its own.
The row-level story: a single large DELETE runs as one transaction and holds row locks on every affected row until it commits or rolls back. Anyone trying to modify those rows waits. Our cascade was touching millions of events rows, so effectively every writer in the system found itself queued behind one transaction.
Why a single DELETE cascades into a table scan
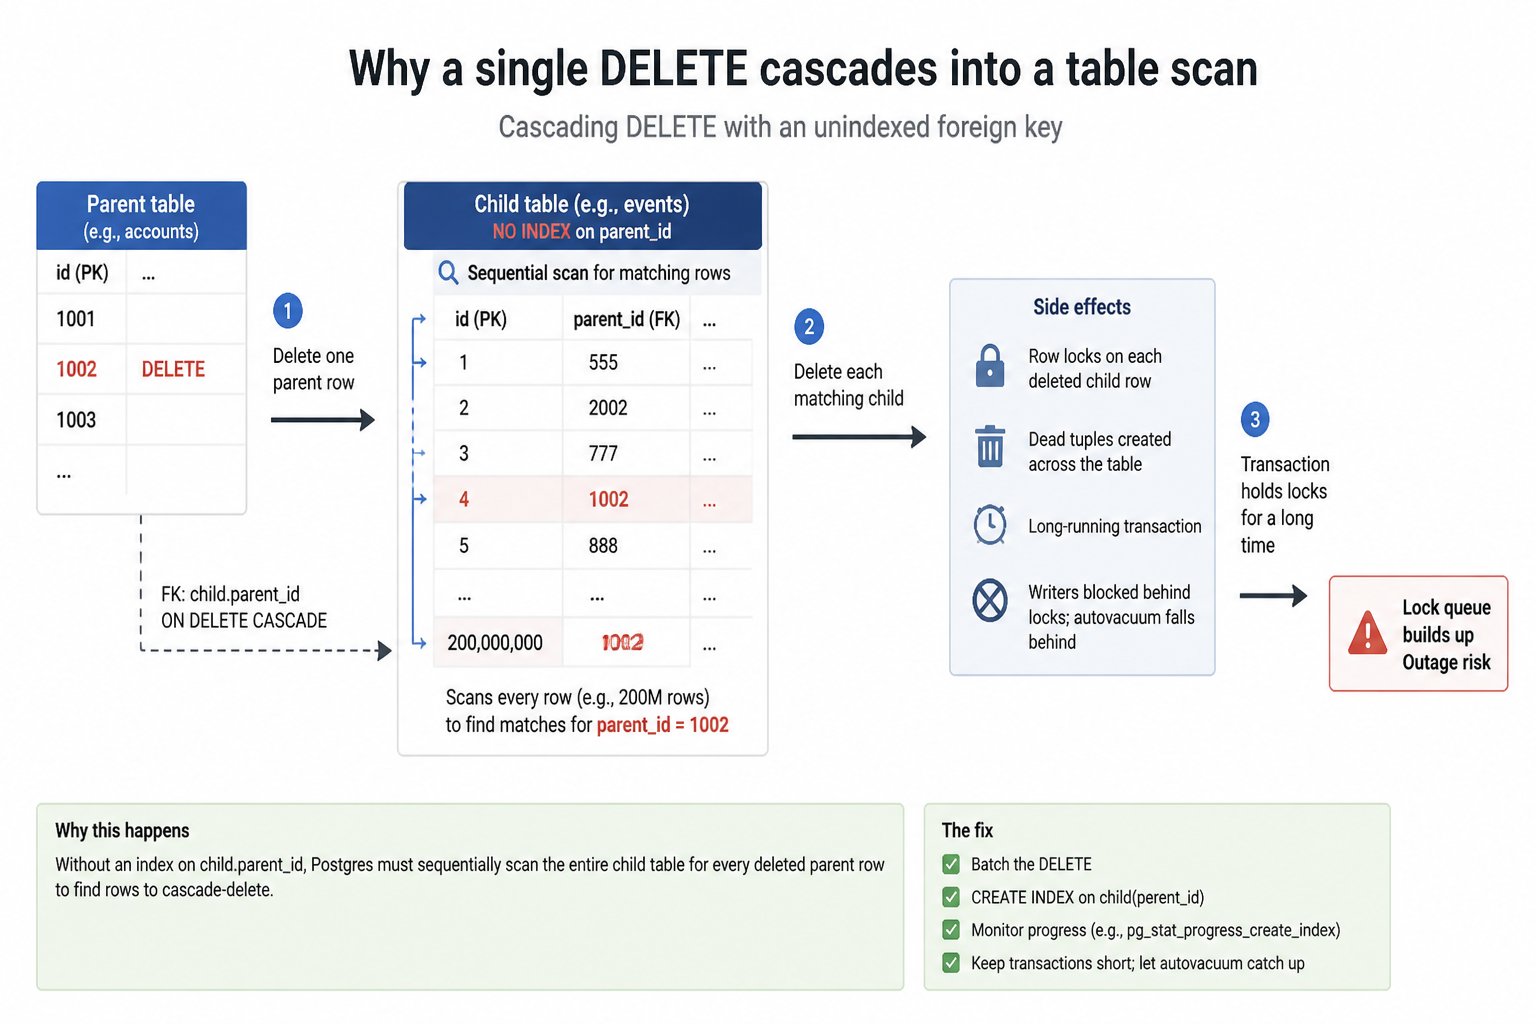
Here's the mechanism, and it's the part people get wrong.
Postgres does not automatically create an index on the referencing column of a foreign key. It indexes the referenced side (that's the primary key on accounts.id), but events.account_id gets nothing unless you ask. When you delete a parent row with ON DELETE CASCADE, Postgres has to find the child rows. With no index on events.account_id, the only way to find them is to read the entire child table — an unindexed foreign key lock waiting to happen.
Per deleted parent row.
We deleted 612 accounts that night. 612 sequential scans of a 204 million row table.
I reproduced it on a clone the next morning with a single-row delete:
EXPLAIN (ANALYZE, BUFFERS)
DELETE FROM accounts WHERE id = 8814203;
Delete on accounts (cost=0.43..8.45 rows=0 width=0)
(actual time=0.089..0.090 rows=0 loops=1)
-> Index Scan using accounts_pkey on accounts
(cost=0.43..8.45 rows=1 width=6)
(actual time=0.031..0.033 rows=1 loops=1)
Index Cond: (id = 8814203)
Buffers: shared hit=4
Trigger for constraint events_account_id_fkey:
time=48122.611 calls=1
Planning Time: 0.144 ms
Execution Time: 48122.930 msThe delete itself is 0.09 ms. The FK trigger is 48 seconds. The parent statement's plan looks perfect, which is exactly why this is hard to spot in a plan review. You have to read the Trigger for constraint line.
For confirmation, I ran the cascade's implicit lookup query directly:
EXPLAIN ANALYZE
SELECT 1 FROM events WHERE account_id = 8814203 LIMIT 1;
Seq Scan on events (cost=0.00..4823910.00 rows=1 width=0)
(actual time=48099.201..48099.201 rows=1 loops=1)
Filter: (account_id = 8814203)
Rows Removed by Filter: 203991884
Planning Time: 0.089 ms
Execution Time: 48099.230 ms204 million rows filtered to find the ones that match, once per parent row deleted.
If you want to see the scan itself, the cascade's internal query shows up in the child table's stats:
SELECT relname, seq_scan, seq_tup_read, idx_scan
FROM pg_stat_user_tables
WHERE relname IN ('accounts','events');
Before the incident window, and after (I had a snapshot from our stats collector):
 relname  | seq_scan | seq_tup_read  | idx_scan
----------+----------+---------------+-----------
 events   |       19 |     3901221   | 884120331    <- 02:00
 events   |      631 |  124883910422 | 884120388    <- 03:04
612 new sequential scans, roughly 125 billion tuples read, on a table that fits in neither shared buffers nor page cache. That's what wait_event = DataFileRead was telling me at the top.
The Postgres docs are explicit about this: index the referencing column when the referenced table sees many DELETEs or UPDATEs, specifically to avoid the sequential scan. It is not folklore.
The second failure: autovacuum starvation
While the cascade churned, it was also generating dead tuples at an enormous rate. Every deleted events row becomes a dead tuple that VACUUM has to reclaim.
SELECT relname, n_live_tup, n_dead_tup,
       last_autovacuum, autovacuum_count
FROM pg_stat_user_tables
WHERE relname = 'events';
relname | n_live_tup | n_dead_tup | last_autovacuum | autovacuum_count
---------+-------------+------------+------------------------+------------------
events | 198442190 | 31980554 | 2026-03-11 01:12:44+00 | 10418Nearly 32 million dead tuples, and the last successful autovacuum was 90 minutes before the incident even started. I checked whether a worker was even running:
SELECT p.pid, p.phase, p.heap_blks_total, p.heap_blks_scanned,
       a.wait_event_type, a.wait_event
FROM pg_stat_progress_vacuum p
JOIN pg_stat_activity a USING (pid);
pid | phase | heap_blks_total | heap_blks_scanned | wait_event_type | wait_event
-------+-------------------+-----------------+-------------------+-----------------+------------
22455 | scanning heap | 24118902 | 883114 | IO | DataFileReadOne was, and it was progressing, but at 883k of 24.1M blocks it had a long way to go, and it was competing for the same disk the cascade scans were saturating. Worse, the delete transaction was still open, so the dead rows it produced weren't even removable yet — VACUUM can't reclaim tuples that a still-running transaction might need. On a bad night this query comes back empty instead, meaning no worker is even in flight, either because it's been starved out by lock contention or hasn't been triggered yet. Either result is a warning sign.
This is the compounding failure that turns a slow query into an outage. Delete rate outpacing vacuum means bloat; bloat means more pages to scan; more pages to scan means the next cascade scan is slower than the last one. The problem gets worse the longer you let it run.
Immediate triage: killing it without making it worse
At 03:09 I had a decision: let it finish, or terminate it.
The arithmetic: 612 accounts, roughly 48 seconds of trigger time each on cold cache, though caching improves that somewhat as the same pages get touched. Call it 6 to 8 hours worst case. Not acceptable.
The counter-argument to killing it: rollback is not free. Cancelling a large DELETE doesn't undo the dead tuples it created. Postgres marks rows deleted by writing xmax; an abort just means those versions stay visible and the new dead tuples are the ones the transaction wrote. Either way, VACUUM has work to do afterward. Rollback itself is fast — Postgres doesn't replay an undo log, it just flips the transaction's status to aborted — but you get zero forward progress in exchange for the IO you already spent.
I killed it. Cancel first, terminate only if cancel doesn't take:
SELECT pg_cancel_backend(21874);
-- wait 10 seconds, re-check pg_stat_activity
SELECT pg_terminate_backend(21874);  -- only if still there
pg_cancel_backend sends SIGINT and lets the backend unwind cleanly. pg_terminate_backend sends SIGTERM and kills the connection, which is heavier-handed and can leave the client confused. Try the polite one first.
Locks cleared at 03:11:40. The blocked writer queue drained in about nine seconds. Application error rate back to baseline at 03:12.
Then I disabled the cron entry, because the job would have fired again the next night and I wanted to sleep.
The real fix, part 1: batching the delete
Even with a good index, deleting hundreds of thousands of child rows in one transaction holds locks for the whole duration. Batching large deletes on Postgres bounds that.
DO $
DECLARE
  deleted integer;
  total   integer := 0;
BEGIN
  LOOP
    DELETE FROM accounts
    WHERE id IN (
      SELECT id FROM accounts
      WHERE deleted_at < now() - interval '180 days'
      ORDER BY id
      LIMIT 25
    );
    GET DIAGNOSTICS deleted = ROW_COUNT;
    total := total + deleted;
    EXIT WHEN deleted = 0;
    COMMIT;              -- requires PG 11+ procedural COMMIT
    PERFORM pg_sleep(0.5);
  END LOOP;
  RAISE NOTICE 'deleted % accounts', total;
END $;
Three things matter here. The LIMIT in a subquery keeps each transaction small. The COMMIT releases row locks between batches so writers get a turn. The pg_sleep gives autovacuum a window to actually reclaim what the previous batch produced, which is the difference between steady state and runaway bloat.
We run ours from the application scheduler rather than a DO block, so we can log per-batch timing and abort on a lock-wait threshold, but the shape is identical. Batching alone doesn't fix the underlying sequential scan — it just bounds how long any single transaction holds locks while that scan runs. You still need the index.
The real fix, part 2: indexing the foreign key
First, find every FK in the database that lacks a supporting index. This query has earned its keep more than once.
> Diagnostic: unindexed foreign keys > ``sql > SELECT c.conrelid::regclass AS child_table, > c.conname AS constraint_name, > a.attname AS fk_column, > pg_size_pretty(pg_relation_size(c.conrelid)) AS child_size > FROM pg_constraint c > JOIN LATERAL unnest(c.conkey) WITH ORDINALITY AS k(attnum, ord) ON true > JOIN pg_attribute a > ON a.attrelid = c.conrelid AND a.attnum = k.attnum > WHERE c.contype = 'f' > AND NOT EXISTS ( > SELECT 1 FROM pg_index i > WHERE i.indrelid = c.conrelid > AND i.indkey::int2[] @> c.conkey[1:1] > AND i.indkey[0] = c.conkey[1] > ) > ORDER BY pg_relation_size(c.conrelid) DESC; > ` > The indkey[0]` check matters: a composite index only helps the FK lookup if the FK column is the leading column.
Our result:
 child_table  |     constraint_name      | fk_column  | child_size
--------------+--------------------------+------------+------------
 events       | events_account_id_fkey   | account_id | 184 GB
 audit_log    | audit_log_actor_id_fkey  | actor_id   | 12 GB
 webhooks     | webhooks_account_id_fkey | account_id | 340 MB
Two more time bombs sitting right there.
Watching CREATE INDEX progress live on a hot table

A plain CREATE INDEX takes a lock that blocks writes for the duration of the build. On a 184 GB table that means an outage, which defeats the purpose of fixing an outage. So:
CREATE INDEX CONCURRENTLY idx_events_account_id
  ON events (account_id);
CONCURRENTLY builds the index without blocking concurrent INSERT, UPDATE, or DELETE. The tradeoff is real: it does two full table scans instead of one and takes considerably longer overall, and it can't run inside a transaction block. On a live production table that's an easy trade.
The thing nobody tells you is how unnerving it is to watch a CREATE INDEX CONCURRENTLY sit there for 90 minutes with no output. That's what pg_stat_progress_create_index is for.
> Diagnostic: index build progress > ``sql > SELECT p.phase, > p.blocks_done, p.blocks_total, > round(100.0 * p.blocks_done / nullif(p.blocks_total,0), 1) AS pct, > p.tuples_done, p.tuples_total, > p.current_locker_pid > FROM pg_stat_progress_create_index p; > ``
Sample readings from our build:
        phase           | blocks_done | blocks_total |  pct  | tuples_done | tuples_total | current_locker_pid
------------------------+-------------+--------------+-------+-------------+--------------+--------------------
 building index: scan   |     8112004 |     24118902 |  33.6 |           0 |            0 |                  0
...and 40 minutes later:
waiting for writers before validation | 0 | 0 | | 0 | 0 | 24771The phases you'll see, in order: initializing, then building index: scanning table for the first full pass — this is where blocks_done climbing steadily against blocks_total tells you it's alive, not stuck. Then, for CONCURRENTLY specifically, a waiting for old snapshots phase, where the build waits for any transaction that started before the index existed to finish, so it can be certain nothing in flight is relying on a pre-index view of the table. Finally a waiting for writers phase around validation.
How to tell stuck from slow: during scan phases, sample blocks_done twice 30 seconds apart. If it moves, you're fine — compute the rate and go get coffee. If the phase is waiting for writers before validation and current_locker_pid is non-zero and unchanging for many minutes, the build is waiting on one specific long-running transaction. Look that pid up in pg_stat_activity. Nine times out of ten it's an idle-in-transaction session from an application connection pool, and it will hold your index build hostage indefinitely.
Ours was blocked for eleven minutes by a reporting query. I let it finish rather than kill it. Total build: 1 hour 52 minutes.
Always verify validity afterward, because a failed CONCURRENTLY build leaves an invalid index behind that will silently not be used:
SELECT indexrelid::regclass, indisvalid
FROM pg_index WHERE indrelid = 'events'::regclass;
Confirming the fix
Same batched job, next maintenance window, index in place:
batch  1: 25 accounts, 118441 child rows, 0.83s
batch  2: 25 accounts,  94012 child rows, 0.61s
batch  3: 25 accounts, 131887 child rows, 0.94s
...
batch 25: 12 accounts,  40118 child rows, 0.29s
total: 612 accounts, 2.41M child rows, 34.2s wall clock (incl. sleeps)
Under a second per batch, against 42 minutes and counting for the unbatched version. The FK trigger EXPLAIN on the clone:
Trigger for constraint events_account_id_fkey: time=31.442 calls=148 seconds to 31 milliseconds. The same lookup query, run directly:
 Index Only Scan using idx_events_account_id on events
   (actual time=0.019..0.019 rows=1 loops=1)
   Index Cond: (account_id = 8814203)
 Execution Time: 0.041 ms
0.041 milliseconds versus 48 seconds.
pg_stat_user_tables confirmed it from the other direction: seq_scan on events did not increment at all during the run, and idx_scan climbed by 612. Zero lock waits recorded during the window. n_dead_tup peaked at 2.4M mid-run and autovacuum had it back under 300k within twenty minutes, because the half-second gaps between batches gave it room to work.
How this gets caught before the page
Every piece of this was detectable in advance. The unindexed FK query above takes 40 milliseconds and would have flagged events_account_id_fkey on a 184 GB table any day in the previous two years. The vacuum lag on events had been drifting upward for weeks. Nobody was looking, because looking requires remembering to look.
That's the case for automating it. We run MyDBA against this cluster now, and the checks that would have turned this incident into a Tuesday ticket are exactly the boring ones: unindexed foreign keys on tables above a size threshold, blocking chains held longer than N seconds with the root pid identified, and dead tuple ratio trending against autovacuum throughput per table. The blocking-chain view in particular is what I wanted at 03:01 and had to assemble by hand.
Checklist: before you run a cascading delete on a big table
- Run the unindexed FK query. Do it for the whole database, not just the table you're about to touch. Cascades chain.
- Check the child row count —
SELECT count(*) FROM child WHERE fk_col IN (...)for a sample of parents. If it's thousands per parent, your batch size needs to be small. EXPLAIN (ANALYZE)a single-row delete on a clone and read theTrigger for constraintline, not the plan.- Batch it.
LIMITin a subquery, commit between batches, sleep briefly so autovacuum can interleave. Batching bounds lock duration; it does not fix a missing index. - Add missing FK indexes with
CREATE INDEX CONCURRENTLY, and watchpg_stat_progress_create_indexso you know whether it's building or blocked. - Check
pg_index.indisvalidafter any CONCURRENTLY build. - Have
pg_blocking_pids()in a saved snippet. At 3am you will not want to write apg_locksself-join. - Check
pg_stat_progress_vacuumduring any long-running delete. An empty result means no worker is even running, which is worse than a slow one. - Never schedule a cleanup job against an unindexed cascade and assume it'll be fine because it was fine last night. It's fine right up until the table crosses whatever size makes it not fine.
That last bullet is the one that gets people, because "it worked last night" is true right up until the row count crosses whatever threshold turns milliseconds into hours. Nothing about the schema changed between the good nights and the bad one — the data just grew into it.
What actually changed
None of this needed exotic tuning. One missing index turned a routine cleanup into a multi-hour lock queue, and one CREATE INDEX CONCURRENTLY turned it back into a routine cleanup. The pattern generalizes past this incident: cascading deletes are only ever as fast as the worst-indexed table in the chain, and Postgres will not warn you about that in advance — it just quietly does a sequential scan every time, until the table is big enough for that to hurt. Check your foreign keys before they check you.