Isolating the Query Type That's Killing Your Database
Isolating the Query Type That's Killing Your Database
The Problem
During an incident, the first question is: "Is this a read problem or a write problem?" The answer determines everything about your investigation path. If the database is slow because of a runaway SELECT scanning millions of rows without an index, you need to find that query and add an index. If it is slow because of a bulk INSERT generating massive WAL, you need to find the write and throttle it. Different causes, different fixes, different urgency.
pg_stat_statements shows everything in a flat list — hundreds of query templates sorted by total time or mean time. During an incident you are scrolling through SELECTs, INSERTs, UPDATEs, DELETEs, and utility statements mixed together. The query consuming the most total time might be a harmless high-frequency SELECT that runs millions of times per day. The actual problem might be an UPDATE that runs 50 times per hour but holds row locks for 2 seconds each time.
Without filtering by statement type, you are pattern-matching visually: scanning query text for keywords, mentally categorizing each entry, trying to spot the anomaly. This is slow and error-prone, especially under incident pressure. A developer who is not deeply familiar with the workload cannot quickly distinguish normal query patterns from abnormal ones.
Workload composition also matters outside of incidents. A database that shifts from 80% reads / 20% writes to 50/50 after a new feature launch is fundamentally different — the same hardware and configuration may no longer be adequate. But you cannot see this shift without statement type classification.
How to Detect It
You can manually classify queries by parsing the statement type from pg_stat_statements:
-- Group query statistics by statement type
SELECT
    CASE
        WHEN upper(left(ltrim(query), 6)) = 'SELECT' THEN 'SELECT'
        WHEN upper(left(ltrim(query), 6)) = 'INSERT' THEN 'INSERT'
        WHEN upper(left(ltrim(query), 6)) = 'UPDATE' THEN 'UPDATE'
        WHEN upper(left(ltrim(query), 6)) = 'DELETE' THEN 'DELETE'
        ELSE 'UTILITY'
    END AS statement_type,
    count(*) AS template_count,
    sum(calls) AS total_calls,
    round(sum(total_exec_time)::numeric, 2) AS total_time_ms,
    round(avg(mean_exec_time)::numeric, 2) AS avg_mean_time_ms
FROM pg_stat_statements
WHERE dbid = (SELECT oid FROM pg_database WHERE datname = current_database())
GROUP BY 1
ORDER BY total_time_ms DESC;
This gives you a workload breakdown, but it is a one-time snapshot with no trending. You see the current distribution but cannot tell if it changed after yesterday's deploy. And the regex-based classification is fragile — it breaks on queries with leading comments, CTEs, or whitespace variations.
To identify the most expensive queries per type during an incident:
-- Top 5 most expensive SELECT queries by total time
SELECT queryid, substring(query, 1, 100) AS query_preview,
       calls, mean_exec_time, total_exec_time
FROM pg_stat_statements
WHERE query ~* '^\s*SELECT'
  AND dbid = (SELECT oid FROM pg_database WHERE datname = current_database())
ORDER BY total_exec_time DESC
LIMIT 5;

-- Top 5 most expensive INSERT/UPDATE/DELETE queries
SELECT queryid, substring(query, 1, 100) AS query_preview,
       calls, mean_exec_time, total_exec_time
FROM pg_stat_statements
WHERE query ~* '^\s*(INSERT|UPDATE|DELETE)'
  AND dbid = (SELECT oid FROM pg_database WHERE datname = current_database())
ORDER BY total_exec_time DESC
LIMIT 5;
This requires multiple queries, manual regex, and mental assembly. During an incident, every minute spent writing SQL is a minute not spent fixing the problem.
How myDBA.dev Shows It
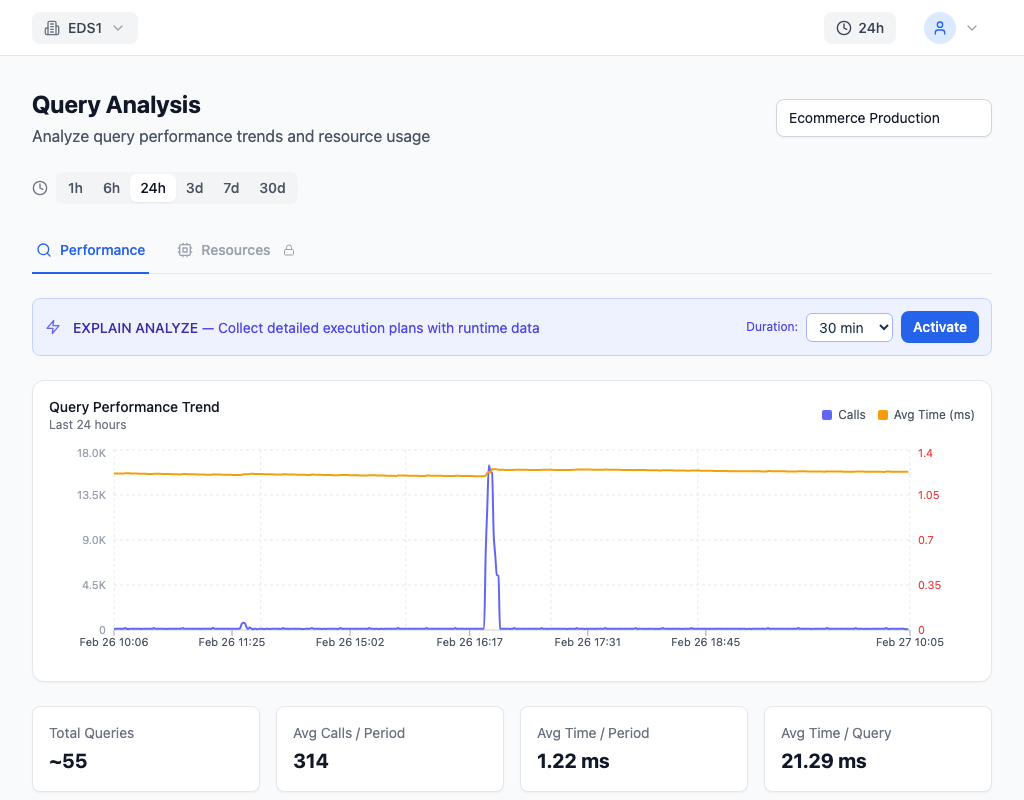
myDBA.dev classifies every query template by statement type automatically. Filter pills at the top of the Queries page — SELECT, INSERT, UPDATE, DELETE, and UTILITY — let you isolate a single type with one click. During write pressure, click INSERT to see only insert operations ranked by total time. During read latency spikes, click SELECT to focus on reads exclusively.
The classification handles edge cases that simple regex misses: CTEs that start with WITH, queries with leading comments, and prepared statement variations. Each query row retains its performance grade, call count, total time, and trend sparkline — the filters narrow the view without losing context.
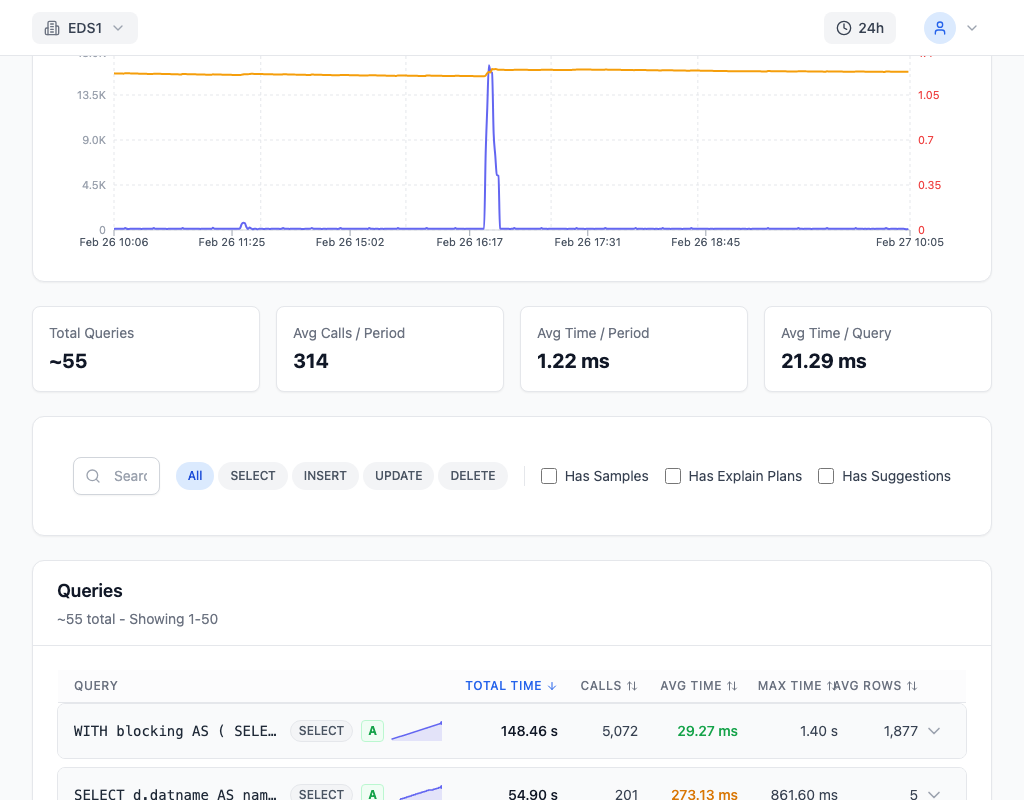
Combined with sortable columns, the statement type filter becomes a rapid triage tool. Sort by total time to find the most expensive queries of a given type. Sort by mean time to find the slowest individual executions. Sort by calls to identify high-frequency queries that might benefit from caching or batching. During an incident, the workflow is: click the suspected statement type, sort by total time, and the top entry is your primary suspect. This takes seconds rather than the minutes required for manual SQL classification.
How to Fix It
Once you have isolated the statement type, each category has a distinct investigation path:
SELECT problems — reads consuming too much time:
-- Check for sequential scans on large tables
SELECT schemaname, relname, seq_scan, seq_tup_read,
       idx_scan, pg_size_pretty(pg_relation_size(relid)) AS table_size
FROM pg_stat_user_tables
WHERE seq_scan > 100 AND pg_relation_size(relid) > 10485760  -- > 10MB
ORDER BY seq_tup_read DESC;
Common fixes: add missing indexes, rewrite N+1 query patterns into JOINs, add LIMIT clauses to unbounded queries.
INSERT problems — writes overwhelming WAL:
-- Check WAL generation rate
SELECT pg_size_pretty(pg_wal_lsn_diff(pg_current_wal_lsn(), '0/0')) AS total_wal;

-- Check for indexes slowing down inserts
SELECT indexrelname, idx_scan, pg_size_pretty(pg_relation_size(indexrelid))
FROM pg_stat_user_indexes
WHERE idx_scan = 0 AND schemaname = 'public'
ORDER BY pg_relation_size(indexrelid) DESC;
Common fixes: use COPY instead of row-by-row INSERT, drop unused indexes on write-heavy tables, batch inserts into larger transactions.
UPDATE/DELETE problems — lock contention:
-- Check for lock waits
SELECT blocked.pid, blocked.query, blocking.pid AS blocking_pid
FROM pg_stat_activity blocked
JOIN pg_locks bl ON bl.pid = blocked.pid
JOIN pg_locks kl ON kl.transactionid = bl.transactionid AND kl.pid != bl.pid
JOIN pg_stat_activity blocking ON blocking.pid = kl.pid
WHERE NOT bl.granted;
Common fixes: add missing foreign key indexes (cascading deletes scan child tables), reduce transaction scope, avoid SELECT ... FOR UPDATE where SKIP LOCKED would work.
How to Prevent It
Track statement type distribution as a workload health indicator. Establish your baseline — a healthy ratio for your application — and alert when the mix shifts significantly. A sudden increase in DELETE percentage might indicate a runaway cleanup job, while a spike in UTILITY statements might signal excessive ANALYZE or VACUUM activity competing for resources.
Review workload composition after every major feature launch. A feature that adds a new UPDATE-heavy workflow to a previously read-dominated database changes the performance profile fundamentally. Index strategies, work_mem settings, and WAL configuration that worked for a read workload may need adjustment for a mixed workload.
myDBA.dev tracks query statistics over time with statement type classification built in, making it straightforward to compare workload composition before and after deployments.