What is a bitmap heap scan, and why did the planner choose one?
A bitmap heap scan is PostgreSQL's two-step table access. A Bitmap Index Scan builds an in-memory bitmap of matching row locations, then a Bitmap Heap Scan visits those blocks in physical order. The planner chooses it when a query matches too many rows for a plain index scan, but too few to justify reading the entire table.
Key facts
| Fact | Value | |---|---| | Plan node pair | Bitmap Index Scan (child) feeding Bitmap Heap Scan (parent); BitmapAnd / BitmapOr sit between them when several indexes are combined (docs) | | What limits the bitmap | work_mem, default 4MB (docs) | | Overflow behaviour | The bitmap degrades from per-tuple to per-page tracking (tbm_lossify) (source) | | Line that tells you | Heap Blocks: exact=N lossy=M on the Bitmap Heap Scan node (docs) | | Cost of lossy pages | Every row on a lossy page is re-checked; rejects appear as Rows Removed by Index Recheck (docs) | | Prefetch depth | effective_io_concurrency, default 16 in PostgreSQL 18 (docs) | | Index-only scans | Not available on a bitmap path — the heap is always visited (docs) | | Fleet data | Across 50 monitored instances, 86% are not capturing plans automatically (auto_explain health check) |
Why this happens
An index scan fetches one heap row per index entry, in index order, which on a large table means random I/O. A sequential scan reads every block once, in order, and throws away what does not match. Neither is right in the middle. The bitmap path is the compromise: scan the index, record the locations of matching rows in a bitmap, sort that bitmap into physical order, then read each heap block once. PostgreSQL's own documentation describes the two levels as existing precisely so the upper node can sort row locations into physical order before fetching (docs).
That bitmap lives in memory, bounded by work_mem (docs). While it fits, PostgreSQL records individual tuples: those pages report as exact. When the bitmap outgrows its budget, it does not spill to disk — it lossifies. Pages are collapsed to a single "something on this page matches" bit, dropping the per-tuple detail (source). Those pages report as lossy, and the heap scan must then re-apply the index condition to every row it finds on them. That is what Recheck Cond is for, and the rows it discards are counted as Rows Removed by Index Recheck (docs).
Recheck Cond is printed on every bitmap heap scan, even when nothing is rechecked, so its presence means nothing on its own. The Rows Removed by Index Recheck line is the one that only appears when work was actually wasted.
When more than one index can help, PostgreSQL scans each, builds a bitmap from each, and combines them with BitmapAnd or BitmapOr before visiting the table (docs). Combining is only possible in bitmap form — which is also why any ordering the indexes provided is lost, and a separate Sort appears if the query has an ORDER BY.
How to detect it
Ask for buffers. In PostgreSQL 18 ANALYZE enables BUFFERS implicitly, but being explicit costs nothing (docs):
EXPLAIN (ANALYZE, BUFFERS)
SELECT count(*), sum(order_total_amount_pence)
FROM orders
WHERE status = 'refunded' AND order_total_amount_pence > 19000;
On a 5,000,000-row, 939 MB orders table with a B-tree on status, at the default work_mem of 4MB:
 Aggregate  (cost=189722.27..189722.28 rows=1 width=16) (actual time=319.875..319.876 rows=1.00 loops=1)
   Buffers: shared read=120995
   ->  Bitmap Heap Scan on orders  (cost=10752.55..189472.33 rows=49988 width=4) (actual time=34.310..316.899 rows=50045.00 loops=1)
         Recheck Cond: (status = 'refunded'::text)
         Rows Removed by Index Recheck: 2194781
         Filter: (order_total_amount_pence > 19000)
         Rows Removed by Filter: 950383
         Heap Blocks: exact=54214 lossy=65923
         Buffers: shared read=120995
         ->  Bitmap Index Scan on orders_status_idx  (cost=0.00..10740.06 rows=984483 width=0) (actual time=27.301..27.301 rows=1000428.00 loops=1)
               Index Cond: (status = 'refunded'::text)
               Index Searches: 1
               Buffers: shared read=858
 Execution Time: 319.893 ms
Read it bottom-up. The index scan found 1,000,428 rows in 27 ms — fast, and it never touches the table (width=0, 858 buffers). The heap scan above it then spent 290 ms. Heap Blocks: exact=54214 lossy=65923 says more than half the bitmap was lossified, and Rows Removed by Index Recheck: 2194781 is the bill: 2.2 million rows read and re-tested only because their pages had lost per-tuple detail. Rows Removed by Filter: 950383 is separate — that is the order_total_amount_pence predicate, which no index covered. See what Filter means in a plan for that distinction.
Three numbers are worth checking every time: the ratio of lossy to exact, whether Rows Removed by Index Recheck is present at all, and whether the Bitmap Index Scan's actual rows are close to its estimate.
How MyDBA shows this
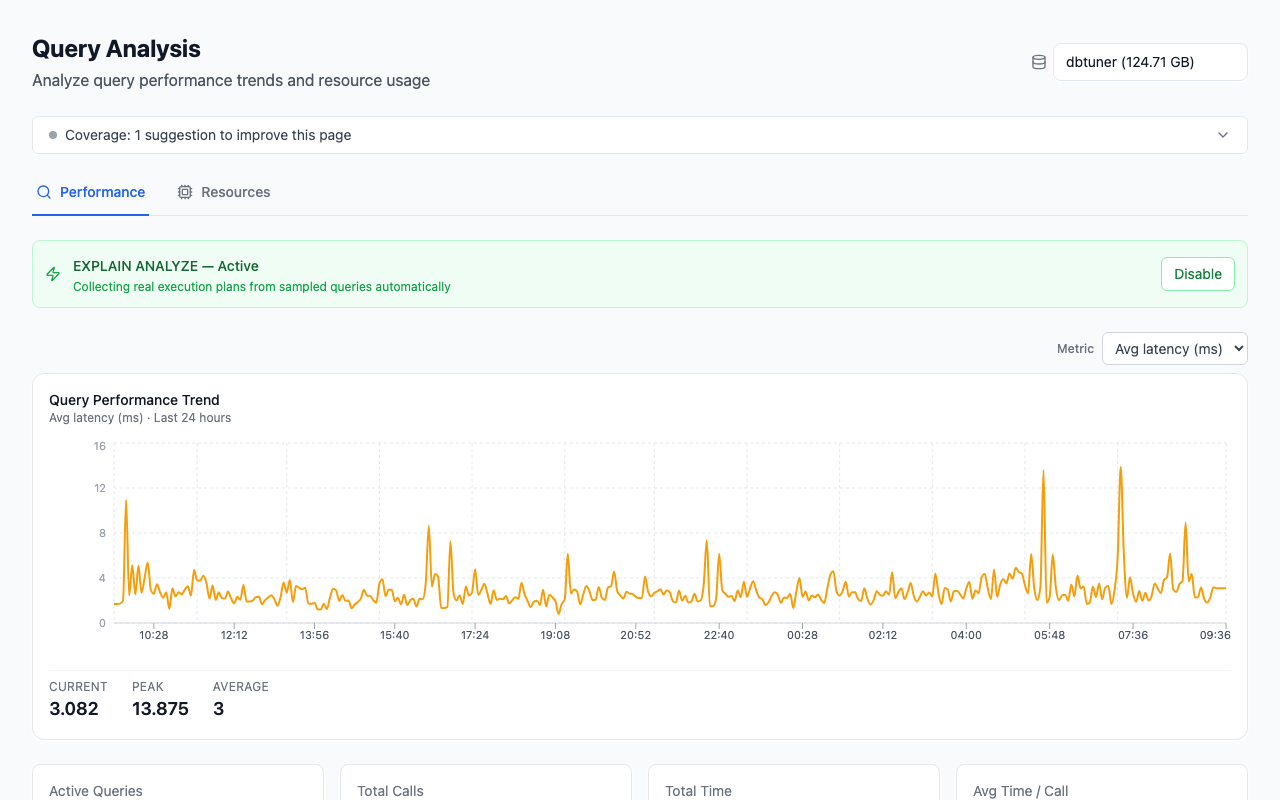
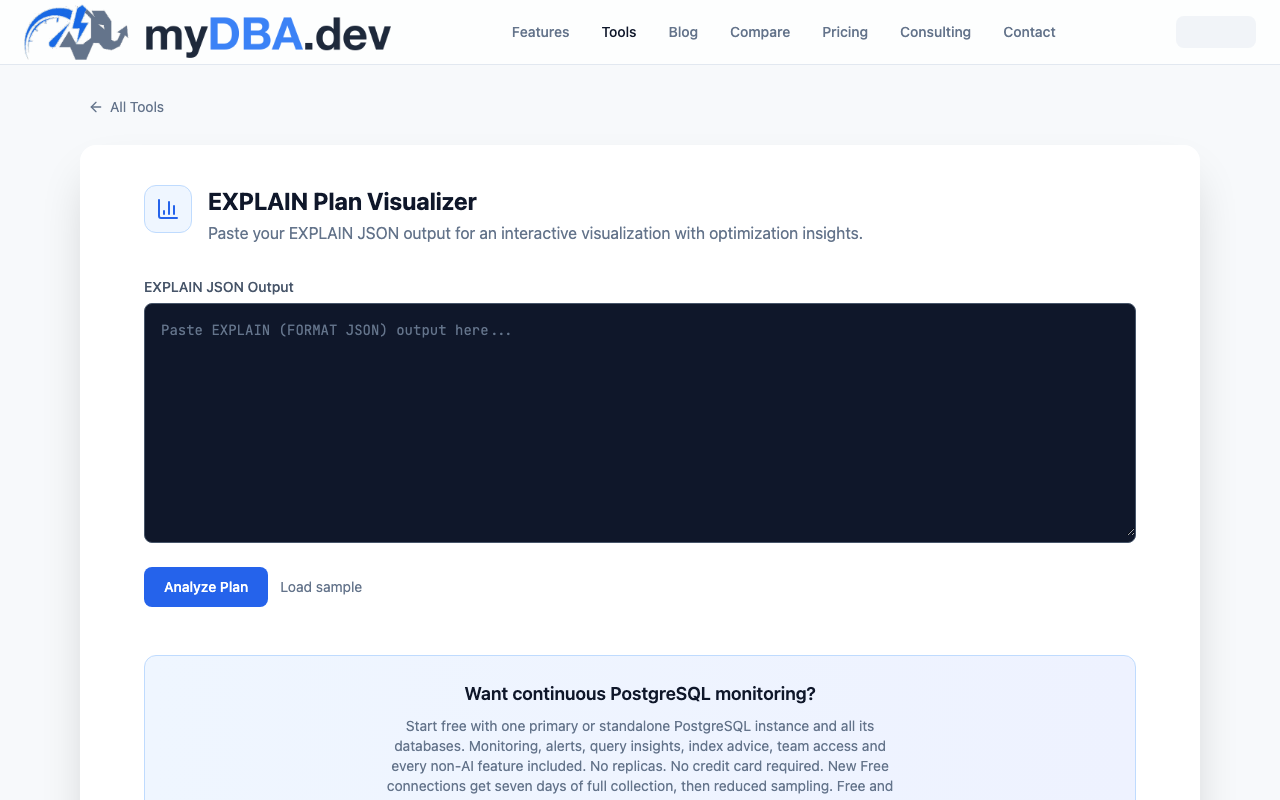
MyDBA collects EXPLAIN plans from sampled real queries on a schedule, so the plan you read is the one the server produced when the query was slow, rather than a replay you run later against a warmer cache and different statistics; the collected plan keeps the Heap Blocks and recheck counters intact, which is the part that is lost when someone re-runs the query by hand. That matters because across 50 monitored instances, 86% have no automatic plan capture configured at all, so the plan for the slow run simply does not exist by the time anyone goes looking — see auto_explain slow query capture. The free plan visualizer at /tools/explain-plan-visualizer will render a plan you paste in, with no account needed.
If you would like the same reading applied to your own instance, the free PostgreSQL health check scores plan capture, work_mem and temp-file pressure together.
How to fix it
1. If lossy dominates, raise work_mem for that query. The same statement, unchanged, with work_mem at 64MB:
SET work_mem = '64MB'; Bitmap Heap Scan on orders (cost=10752.55..145667.80 rows=49988 width=4) (actual time=36.586..205.953 rows=50045.00 loops=1)
Recheck Cond: (status = 'refunded'::text)
Filter: (order_total_amount_pence > 19000)
Rows Removed by Filter: 950383
Heap Blocks: exact=120137
Buffers: shared read=120995
Execution Time: 208.525 msNo lossy blocks, no index recheck, 320 ms down to 209 ms. Set it per session or per role, not globally: work_mem is granted per operation, and a complex query can run several at once (docs).
2. Check whether the bitmap was worth building. Forcing a sequential scan of that same query took 205 ms — indistinguishable from the fixed bitmap. At a million matching rows out of five million, the index bought nothing. That is the honest verdict here: the bitmap heap scan was not the bug, the predicate was.
3. Replace a wide BitmapAnd with one multicolumn index. Three single-column indexes combined for status, shipped_country and a two-week date range produced a BitmapAnd over 1.7 million index rows, 33,156 lossy blocks, and 400 ms. One index on (status, shipped_country, created_at_utc) produced a single Bitmap Index Scan returning exactly 2,842 rows, Heap Blocks: exact=2798, and 9.7 ms. A multicolumn index is usually better when the columns are queried together; separate indexes stay more useful when each column is also queried alone (docs).
4. Confirm the estimate, not the node. If the Bitmap Index Scan's actual rows are an order of magnitude off its estimate, the plan shape was chosen on bad information. Run ANALYZE, consider raising the column's statistics target, and read how the planner uses table statistics before touching anything else. The same reasoning applies one level up when the bitmap feeds a join.
How to prevent it
Set effective_io_concurrency to match your storage. Bitmap heap scans read scattered blocks, and this setting controls how many reads PostgreSQL issues in parallel and the prefetch distance; the default rose to 16 in PostgreSQL 18 (docs). On network-attached storage, a higher value often matters more than anything in the query itself.
Turn on automatic plan capture so the slow run leaves evidence. Across 50 monitored instances, 86% are not capturing plans; when a report arrives the next morning, there is nothing to read. Watch temp-file volume too — across 46 monitored instances, 34.8% show a temp-file problem, and only 7.9% of 38 instances fail the work_mem check outright, which suggests most memory pressure shows up as spilled sorts and lossified bitmaps rather than as an obviously wrong setting.
Finally, do not treat a bitmap heap scan as a defect. It is the correct plan for a middling match set. Alert on the row-estimate error and on Rows Removed by Index Recheck, not on the node's presence.
FAQ
Why does my plan say Recheck Cond when nothing was rechecked?
Recheck Cond is printed on every Bitmap Heap Scan, because the node must be able to recheck if any page turns out lossy. It is a capability, not a measurement. The measurement is Rows Removed by Index Recheck, which only appears when rows were actually discarded (docs).
What does Heap Blocks: exact=54214 lossy=65923 mean?
54,214 heap pages had per-tuple detail in the bitmap, and 65,923 were collapsed to page granularity because the bitmap hit its work_mem budget. Every row on those 65,923 pages was read and re-tested. When lossy is a large share of the total, raising work_mem for that statement is the direct fix.
Can a bitmap heap scan ever be an index-only scan?
No. The bitmap stores row locations, not column values, and after a BitmapAnd or BitmapOr the original index entries no longer exist — the table rows must be visited (docs). An index-only scan is a different plan node entirely. For one test query, the bitmap path took 91 ms and the index-only scan of the same predicate took 1.3 ms, because it never touched the heap.
Should I use enable_bitmapscan = off to make this go away?
Only as a diagnostic, in one session, to see what the planner would have done otherwise. Leaving it off in production removes BitmapAnd and BitmapOr from every plan on that connection, usually substituting a sequential scan. Fix the estimate or the index instead.
I see BitmapOr but I only wrote one OR — where did it come from?
BitmapOr appears when separate indexes serve each side of an OR. When both sides are equality tests on the same column, PostgreSQL 18 folds them into a single = ANY (...) index condition instead, visible as a higher Index Searches count on one Bitmap Index Scan — no BitmapOr node at all.
Part of the Reading PostgreSQL EXPLAIN and EXPLAIN ANALYZE Output guide. Last verified against PostgreSQL 18, 2026-09-17.