How do I find long-running queries in PostgreSQL?
Query pg_stat_activity and rank backends by now() - query_start, excluding your own session and background workers. Then check xact_start as well: a long-running transaction is usually the worse problem, because it holds back the vacuum horizon while a merely slow query does not.
Key facts
| Fact | Value | |---|---| | View that lists running statements | pg_stat_activity, one row per backend | | Query age vs transaction age | now() - query_start vs now() - xact_start; both columns exist and differ | | Ask nicely vs pull the plug | pg_cancel_backend() cancels the statement; pg_terminate_backend() ends the session | | statement_timeout default | 0 — no limit (docs) | | idle_in_transaction_session_timeout default | 0 — no limit (docs) | | transaction_timeout | Added in PostgreSQL 17; default 0 | | Historical capture threshold | log_min_duration_statement, default -1 (off) | | Fleet data (46 monitored instances) | 2.2% fail the idle-in-transaction check; 52.6% of 38 have log_lock_waits off; 86.0% of 50 do not load auto_explain |
Why this happens
pg_stat_activity reports one row per server process, including autovacuum workers, the checkpointer and any replication process, so a naive SELECT * FROM pg_stat_activity mostly returns noise. The rows you care about have backend_type = 'client backend' and a state of active or idle in transaction. The sibling pg_stat_activity guide walks the columns one by one; this article is about acting on them.
The distinction that matters most is between two timestamps the view exposes. query_start is when the current statement began. xact_start is when the surrounding transaction began. A single SELECT that has run for twenty minutes is slow, and it costs you CPU and I/O while it runs. A transaction that opened twenty minutes ago and is now sitting idle costs you something worse: PostgreSQL cannot remove row versions newer than the oldest still-running transaction, because that transaction might yet need to see them. Routine vacuuming explains the mechanism — dead tuples pile up in every table that receives updates or deletes, not only in the tables the open transaction touched, and index scans start walking past tombstones. That is why state = 'idle in transaction' is the quiet one. Nothing is burning CPU, no query looks slow, and the tables bloat anyway.
There is a third case that looks identical from the outside: the backend is not slow, it is stuck. A statement waiting on a lock shows wait_event_type = 'Lock' and accumulates duration exactly like a genuinely expensive query. The wait event table lists the types; Lock means another transaction holds something this one wants. Tuning the query will not help. Finding the blocker will.
How to detect it
Rank the client backends by how long the current statement has been running, excluding your own session and anything that is not a client:
SELECT pid,
       now() - query_start   AS query_age,
       now() - xact_start    AS xact_age,
       state,
       wait_event_type,
       wait_event,
       usename,
       application_name,
       left(query, 120)      AS query_head
FROM pg_stat_activity
WHERE backend_type = 'client backend'
  AND pid <> pg_backend_pid()
  AND state <> 'idle'
ORDER BY query_start NULLS LAST;
Read the two age columns side by side. If query_age is large and xact_age is roughly the same, you have one long statement in its own transaction — ordinary slowness. If xact_age is much larger than query_age, the session has been in a transaction for a while and is running short statements inside it. If state is idle in transaction, query_start refers to a statement that already finished, and only xact_age is meaningful.
For the transaction horizon specifically, ignore query_start entirely:
SELECT pid, state, now() - xact_start AS xact_age, usename, application_name
FROM pg_stat_activity
WHERE xact_start IS NOT NULL
  AND backend_type = 'client backend'
ORDER BY xact_start
LIMIT 10;
The top row is the oldest transaction on the instance, and it sets the vacuum horizon for every table. Across 46 monitored instances in our fleet, 2.2% currently fail our idle-in-transaction check — rare, but it is the kind of finding that explains a bloat problem nobody could otherwise account for.
Before you blame the query, check whether it is blocked. pg_blocking_pids() returns the backends standing in the way:
SELECT a.pid,
       now() - a.query_start AS waiting_for,
       a.wait_event_type,
       a.wait_event,
       pg_blocking_pids(a.pid) AS blocked_by,
       left(a.query, 80) AS waiting_query
FROM pg_stat_activity a
WHERE cardinality(pg_blocking_pids(a.pid)) > 0;
An empty result means nothing is blocked and the long statements really are slow. A non-empty result gives you the PIDs to look at instead — and the blocker is frequently an idle-in-transaction session, which closes the loop with the query above.
How MyDBA shows this
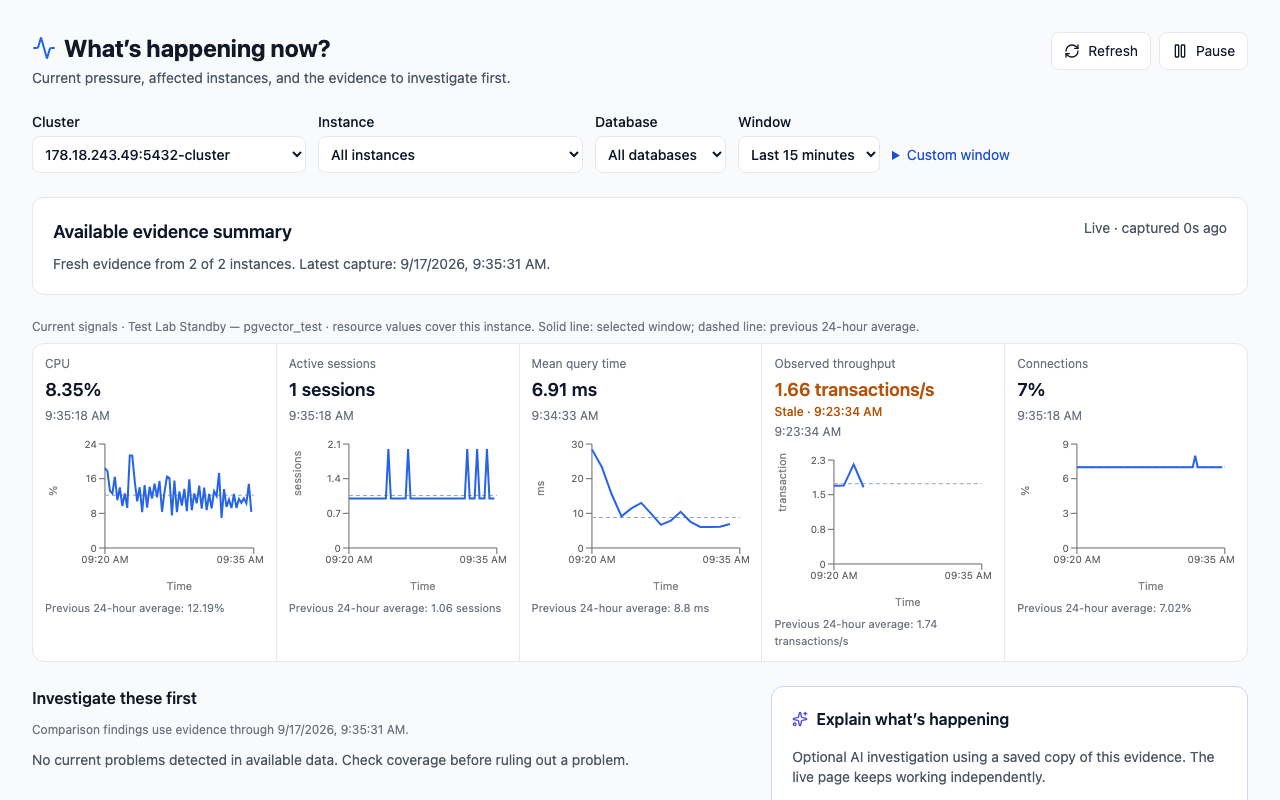
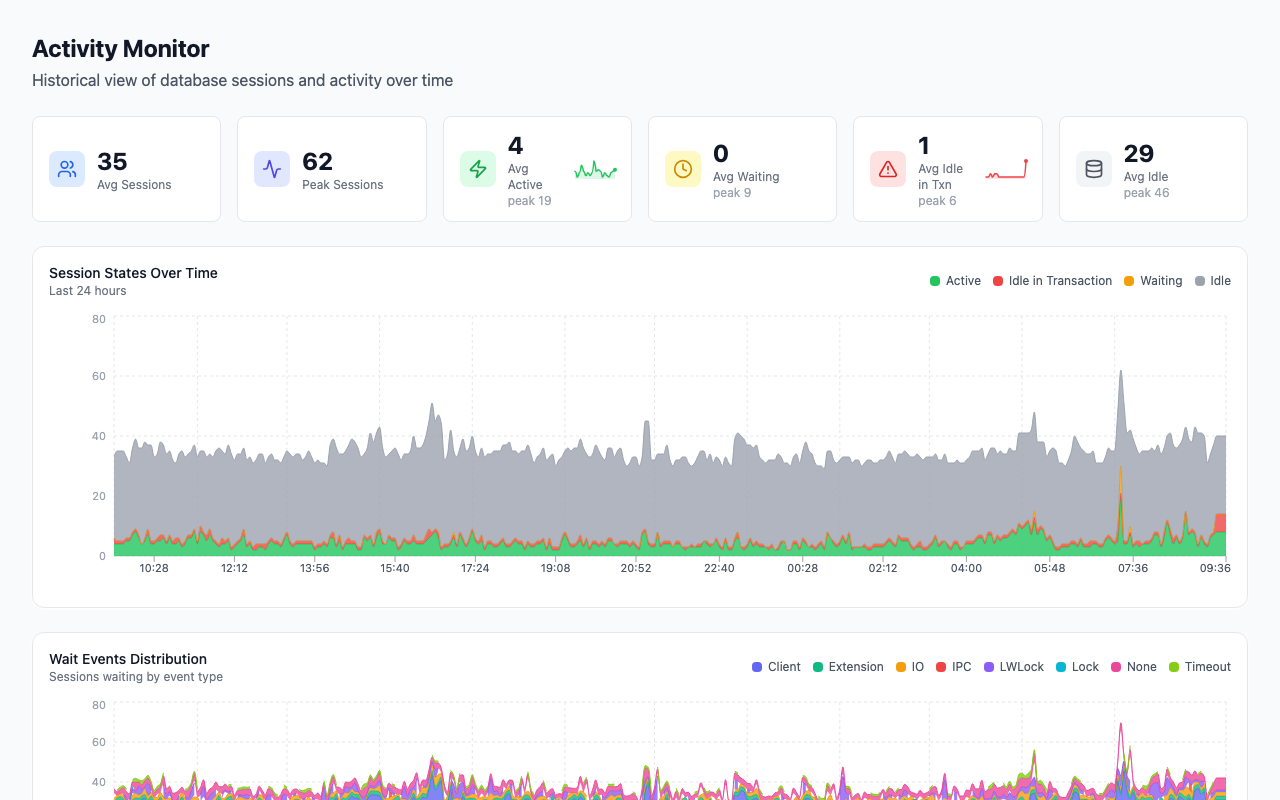
MyDBA's What's happening now? page runs this triage for a whole cluster instead of one connection at a time: it ranks deterministic findings by current pressure, shows each instance's current signals against a previous-24-hour average so you can tell a busy Tuesday from an actual change, and links straight through to Sessions, Blocking and Wait events for the backends behind a finding. The Activity Monitor is the per-instance view of the same data — Current Sessions sortable by duration with state, wait event and query text, a Session States Over Time chart with an Avg Idle in Txn counter, a minimum-duration filter, and a session detail panel that separates Query Duration, Transaction Duration and Session Duration, which is exactly the query_start/xact_start distinction above.
If you want to see what this looks like against your own instance, the free PostgreSQL health check scores idle-in-transaction sessions, lock waits and logging configuration among its checks.
How to fix it
Work through this in order. Stopping the wrong backend is worse than waiting.
1. Identify what it is. Slow query, long transaction, or blocked? The three queries above answer that. Do not skip to step 3. 2. If it is blocked, deal with the blocker. Cancelling the victim frees nothing; the next statement will queue behind the same lock. 3. Cancel first. SELECT pg_cancel_backend(12345); sends SIGINT: the current statement aborts, the transaction rolls back, and the session survives. This is the safe option and it is usually enough. 4. Terminate only if cancel does not work. SELECT pg_terminate_backend(12345); closes the connection. Some states — a backend stuck in certain system calls — ignore a cancel and need this. The sibling on pg_cancel_backend vs pg_terminate_backend covers the cases where the two differ and what the client sees. 5. Check it actually stopped. Both functions return a boolean meaning "the signal was sent", not "the backend is gone". Re-run the ranking query.
Both functions are documented under server signalling and require superuser, pg_signal_backend membership, or ownership of the target session's role.
For queries that have already finished, pg_stat_activity is no help — it only shows the present. Three options cover the past:
log_min_duration_statementlogs any statement over a threshold, with its text and parameters. Set it to something like1000(ms) and read the log. See the slow query log guide.auto_explaingoes further and logs the plan for slow statements, which is what you actually need to fix one. Across 50 monitored instances, 86.0% do not load it — the most-failed check in our performance domain.pg_stat_statementsaggregates per normalised query: calls, total time, mean, and since PostgreSQL 13 the min, max and standard deviation of execution time. It has no "longest single execution" column beyondmax_exec_time, and it records nothing about when a slow execution happened, so it tells you which query shape is expensive without telling you about last Tuesday's twenty-minute outlier. The pg_stat_statements guide covers the columns.
How to prevent it
Four settings, all client connection defaults, all 0 (disabled) out of the box:
| Setting | Stops | |---|---| | statement_timeout | A single statement running past N ms | | lock_timeout | Waiting for a lock past N ms | | idle_in_transaction_session_timeout | A session sitting idle inside a transaction | | transaction_timeout (PG 17+) | A whole transaction, idle or busy, exceeding N ms |
Setting these globally in postgresql.conf is the tempting move and usually the wrong one, because the value that protects your web requests will kill your nightly report. Scope them instead, with ALTER ROLE:
-- Interactive application: nothing should take 30s.
ALTER ROLE app_web SET statement_timeout = '30s';
ALTER ROLE app_web SET idle_in_transaction_session_timeout = '60s';
ALTER ROLE app_web SET lock_timeout = '5s';

-- Reporting role: long is expected, but not unbounded.
ALTER ROLE app_reports SET statement_timeout = '30min';

-- Migrations: never queue behind a lock holding one yourself.
ALTER ROLE app_migrate SET lock_timeout = '3s';
Per-database (ALTER DATABASE ... SET) and per-session (SET LOCAL inside a transaction) work the same way, and a session-level SET overrides the role default when a job genuinely needs longer. Start the timeouts generous, look at what gets cancelled, and tighten from evidence rather than guessing.
One caveat on measurement: a statement cancelled by statement_timeout is recorded by pg_stat_statements with calls = 0, so the time it burned before being killed is largely invisible there. If you add aggressive timeouts, the queries they cancel will quietly stop showing up in your top-N list. Keep log_min_duration_statement on so you still see them.
Finally, turn on log_lock_waits, which logs a message whenever a backend waits longer than deadlock_timeout for a lock. It is cheap and it turns "the app was slow at 3am" into a line with the blocking PID in it. Across 38 monitored instances where we evaluate it, 52.6% have it off.
FAQ
What counts as a long-running query?
There is no server-side definition — PostgreSQL has no threshold of its own, and statement_timeout defaults to 0. Pick one from your workload: for an interactive application anything over a few seconds is worth investigating, for a reporting instance minutes may be normal. The useful signal is a query that is much slower than its own usual, which is what pg_stat_statements mean and max columns give you.
Why is my query showing a long duration when it is not doing any work?
Check wait_event_type. If it is Lock, the backend is waiting for another transaction, not executing. pg_blocking_pids() names the blocker. If state is idle in transaction, the statement in query already finished and the duration you are reading from query_start is meaningless — use xact_start instead.
Is it safe to run pg_terminate_backend on a production backend?
It is safe for the database: the transaction rolls back and PostgreSQL stays consistent. It is not always safe for the application, which sees its connection drop rather than a query error, and may or may not retry cleanly. Try pg_cancel_backend first; it leaves the session alive and the client gets a normal error.
How do I find long-running queries that already finished?
pg_stat_activity cannot help — it is a snapshot of now. Set log_min_duration_statement to capture the statements, add auto_explain to capture their plans, and use pg_stat_statements for per-query-shape totals. Each answers a different question, and together they cover the history that the live view does not.
Does killing a long transaction recover the bloat it caused?
No. Ending the transaction lets the vacuum horizon advance again, so VACUUM can finally remove the dead tuples it was holding back — but the pages those tuples occupy stay allocated to the table. Regular autovacuum will reuse that space for new rows; returning it to the filesystem needs VACUUM FULL or a rewrite, both of which take an exclusive lock.
Part of the Reading PostgreSQL EXPLAIN and EXPLAIN ANALYZE Output guide. Last verified against PostgreSQL 18, 2026-09-17.