Catching Query Plan Regressions Before They Become Incidents
Catching Query Plan Regressions Before They Become Incidents
The Problem
A query runs fine for months. It uses an index scan on the orders table, joins efficiently via nested loop, and completes in 3ms. Then PostgreSQL runs ANALYZE after a batch import, the statistics for order_status shift slightly, the planner decides a hash join is now cheaper, and suddenly the query takes 150ms. Multiply that by 10,000 calls per hour and you have a production incident that appeared out of nowhere.
Plan regressions are one of the most insidious performance problems in PostgreSQL because nothing in your application changed. No code was deployed. No schema was altered. The planner simply re-evaluated its cost model with updated statistics and chose a different strategy. From the application's perspective, it looks like the database spontaneously got 50x slower.
The triggers are varied and often subtle:
- ANALYZE updates statistics — row count estimates change, selectivity assumptions shift
- Table growth crosses a planner threshold — a table that was small enough for a bitmap scan becomes large enough that the planner prefers a sequential scan
- Index bloat — an index becomes less efficient than the planner expects, tipping the cost calculation toward a different strategy
- New data distribution — a column that was uniformly distributed gets skewed by a new customer with an unusual usage pattern
Without plan tracking, you are debugging blind. You know something got slow, but not why or when the change happened.
How to Detect It
Standard PostgreSQL tools give you limited visibility into plan changes. pg_stat_statements tracks aggregate query performance — total time, call count, mean time — but says nothing about the execution plan. You can see that a query's mean time doubled, but not that it switched from an index scan to a hash join.
-- pg_stat_statements shows performance degradation but not the cause
SELECT
    queryid,
    substring(query, 1, 80) AS query_preview,
    calls,
    mean_exec_time,
    max_exec_time,
    stddev_exec_time
FROM pg_stat_statements
WHERE mean_exec_time > 100  -- queries averaging over 100ms
ORDER BY mean_exec_time DESC
LIMIT 20;
A high stddev_exec_time relative to mean_exec_time can hint at plan instability — if the same query sometimes runs in 5ms and sometimes in 500ms, the planner may be choosing different plans based on parameter values or current statistics. But this is a rough signal at best.
To actually detect a plan change, you need to compare EXPLAIN output across time:
-- Run EXPLAIN and save the output (manually, repeatedly)
EXPLAIN (FORMAT JSON)
SELECT o.*, c.customer_name
FROM orders o
JOIN customers c ON c.customer_id = o.customer_id
WHERE o.order_date > '2025-01-01';
You would need to run this periodically, hash or fingerprint the plan structure, and compare it to previous results. Most teams do not have this infrastructure, so plan regressions go undetected until performance monitoring or user complaints surface the symptom.
How myDBA.dev Shows It
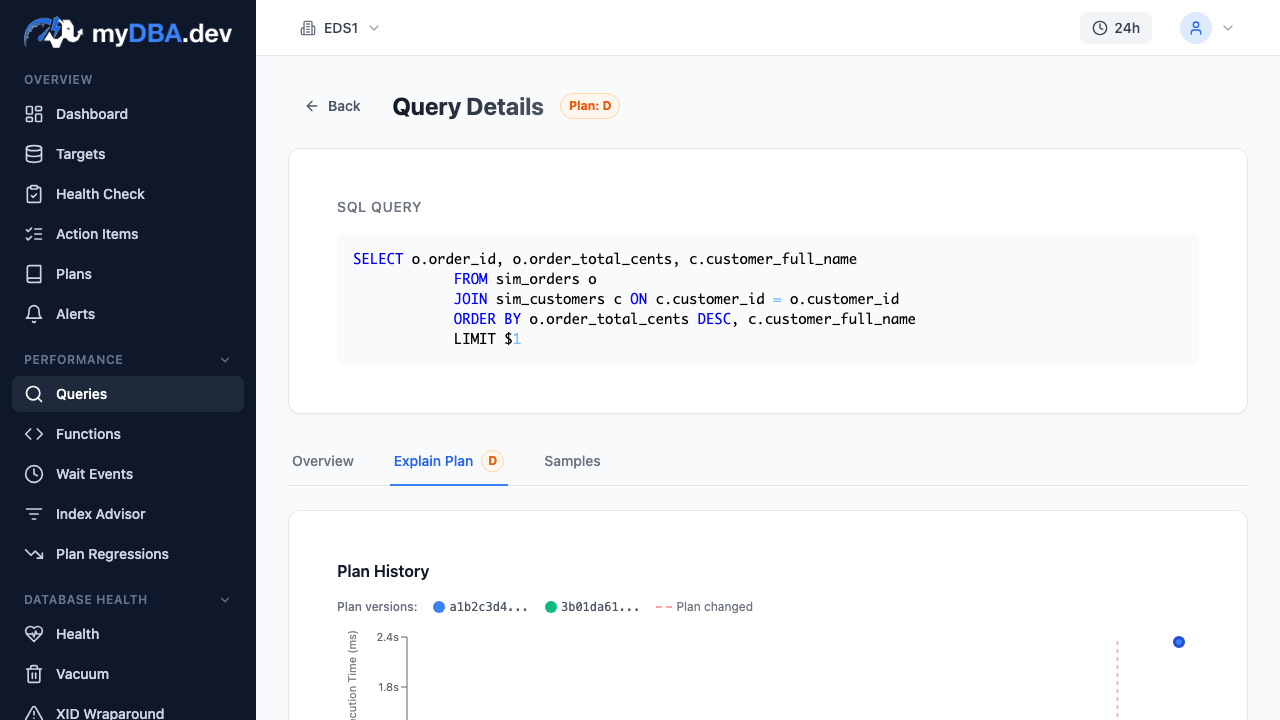
myDBA.dev fingerprints every EXPLAIN plan it collects. When the plan structure changes — a different join type, a different scan method, a different join order — a plan change badge appears on the query in the Queries page. The badge shows when the change was detected, making it immediately obvious which queries recently switched strategies.
This is not just a diff on the raw EXPLAIN text. The fingerprint captures the structural properties of the plan: node types, join methods, scan types, and their order. A cosmetic change (slightly different cost estimates with the same strategy) does not trigger a badge. Only genuine strategy changes — index scan to sequential scan, nested loop to hash join, different join order — are flagged.
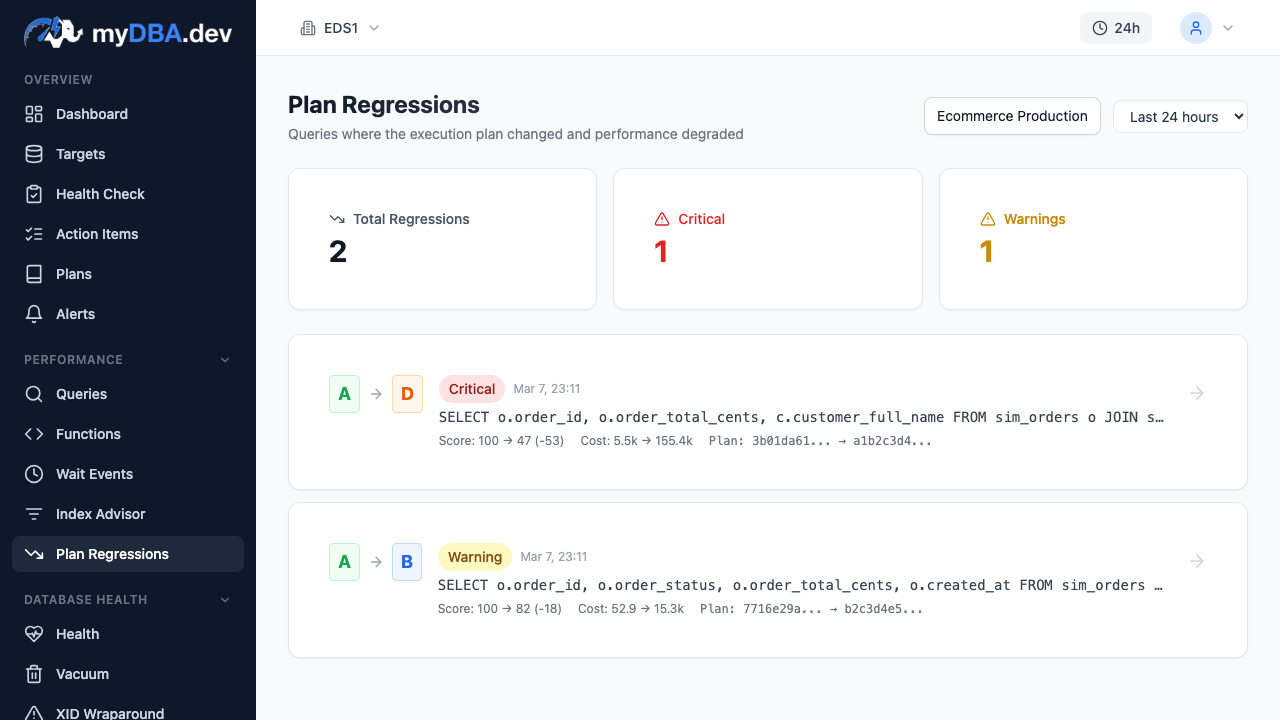
Clicking a plan change badge opens a side-by-side comparison. The previous plan and the current plan are displayed together with the structural differences highlighted. You can immediately see that the query switched from Index Scan on idx_orders_customer to Hash Join with a Seq Scan on orders. The performance impact is shown alongside: mean execution time went from 3.2ms to 148ms. This gives you both the diagnosis (plan changed) and the impact (45x slower) in one view, without needing to run any queries yourself.
How to Fix It
Once you have identified a plan regression, the remediation depends on the root cause:
Statistics drift after ANALYZE:
-- Check when statistics were last updated
SELECT schemaname, relname, last_analyze, last_autoanalyze
FROM pg_stat_user_tables
WHERE relname = 'orders';

-- Increase statistics target for columns with skewed distributions
ALTER TABLE orders ALTER COLUMN order_status SET STATISTICS 1000;
ANALYZE orders;
Higher statistics targets give the planner more histogram buckets, improving selectivity estimates for non-uniform columns. The default of 100 is often insufficient for columns with many distinct values or skewed distributions.
Table growth past a planner threshold:
-- Check if random_page_cost is realistic for your storage
SHOW random_page_cost;  -- default 4.0, too high for SSDs

-- Lower it for SSD storage to encourage index scans
SET random_page_cost = 1.1;
On SSDs, the default random_page_cost = 4.0 overestimates the cost of random I/O, making the planner prefer sequential scans over index scans earlier than it should. Setting it to 1.1 reflects the reality that random reads on SSDs are only marginally more expensive than sequential reads.
Force the plan back (temporary emergency fix):
-- Hint the planner away from sequential scans
SET enable_seqscan = off;
-- Run the query to verify the index scan returns
EXPLAIN ANALYZE SELECT ...;
-- Re-enable immediately
SET enable_seqscan = on;
This is a diagnostic tool, not a permanent fix. If enable_seqscan = off restores performance, the root cause is likely stale statistics or a miscalibrated cost parameter. Fix the underlying issue rather than relying on planner hints.
How to Prevent It
Plan stability requires ongoing attention to three areas: statistics accuracy, cost model calibration, and change detection.
Keep random_page_cost and effective_cache_size calibrated for your actual hardware. On SSD-backed databases, random_page_cost = 1.1 and effective_cache_size set to 75% of available RAM prevent the planner from making poor assumptions about I/O costs.
Increase default_statistics_target to 500 for databases with complex queries or skewed data distributions. Per-column overrides via ALTER TABLE ... SET STATISTICS are even better for known problem columns.
Monitor plan changes continuously rather than hoping ANALYZE produces stable plans. myDBA.dev tracks plan fingerprints over time and alerts when a query changes strategy, giving you the ability to investigate before the regression becomes an incident. Catching a plan change within 5 minutes of it occurring is the difference between a proactive fix and an emergency.