PostgreSQL Parallel Query: Configuration & Performance Tuning
PostgreSQL parallel query divides large operations across multiple CPU cores, using worker processes that each scan a portion of the data and feed results to a leader process via Gather nodes. When properly configured, parallel query can cut the execution time of sequential scans, hash joins, aggregates, and B-tree index scans by a factor proportional to the number of workers — turning a 10-second analytical query into a 2-second one.
The Problem
PostgreSQL is conservative with parallelism by default. The planner only considers parallel execution when the estimated cost of a sequential plan exceeds parallel_setup_cost + parallel_tuple_cost thresholds, and even then it limits workers based on several configuration parameters that ship with deliberately low defaults.
The key defaults:
max_parallel_workers_per_gather = 2— at most 2 workers per parallel operationmax_parallel_workers = 8— total parallel workers across all sessionsmax_worker_processes = 8— total background workers (shared with other subsystems)min_parallel_table_scan_size = 8MB— minimum table size to consider parallel scanmin_parallel_index_scan_size = 512kB— minimum index size to consider parallel index scanparallel_setup_cost = 1000— planner's estimate of the cost to start a parallel workerparallel_tuple_cost = 0.1— planner's estimate of the cost to transfer one tuple from worker to leader
These defaults are tuned for a general-purpose server running a mixed workload. For analytical queries on large tables — the exact scenario where parallelism provides the most benefit — the defaults leave significant performance on the table. A warehouse query scanning a 50 GB table with 2 workers takes 3x longer than it would with 6 workers.
The opposite problem also exists. On OLTP databases with many concurrent short queries, aggressive parallel settings cause harm. Each parallel query spawns worker processes that consume memory (work_mem per worker), CPU, and I/O bandwidth. If 20 concurrent sessions each spawn 4 parallel workers, that is 80 additional processes competing for resources — potentially worse than running each query sequentially.
The diagnostic challenge is that the planner does not tell you "I could have used more workers but the configuration prevented it." The query simply runs with fewer workers than optimal, or does not use parallelism at all. Without examining EXPLAIN output and comparing it against the configuration, the performance opportunity is invisible.
How to Detect It
Check your current parallel query configuration:
-- Review all parallel query settings
SELECT name, setting, unit, short_desc
FROM pg_settings
WHERE name LIKE '%parallel%'
   OR name = 'max_worker_processes'
ORDER BY name;
Identify whether queries are actually using parallel workers by checking EXPLAIN output:
-- Look for Gather nodes and worker counts in the plan
EXPLAIN (ANALYZE, VERBOSE, BUFFERS)
SELECT customer_region, count(*), sum(order_total)
FROM orders
WHERE created_at >= '2026-01-01'
GROUP BY customer_region;
In the output, look for:
GatherorGather Mergenodes — these indicate parallel executionWorkers Planned: 2andWorkers Launched: 2— the number of parallel workers- If
Workers Launchedis less thanWorkers Planned, the system ran out of available workers
Check whether parallel workers are being exhausted system-wide:
-- How many parallel workers are currently active?
SELECT count(*) AS active_parallel_workers
FROM pg_stat_activity
WHERE backend_type = 'parallel worker';

-- Compare against the limit
SELECT setting AS max_parallel_workers
FROM pg_settings
WHERE name = 'max_parallel_workers';
If active_parallel_workers frequently approaches max_parallel_workers, queries are competing for workers and some are running with fewer than planned. Identify which queries are consuming parallel workers:
-- Find sessions using parallel workers
SELECT
    leader_pid,
    count(*) AS worker_count,
    a.query
FROM pg_stat_activity w
JOIN pg_stat_activity a ON a.pid = w.leader_pid
WHERE w.backend_type = 'parallel worker'
GROUP BY leader_pid, a.query
ORDER BY worker_count DESC;
How myDBA.dev Shows It
myDBA.dev's Queries page surfaces parallel query behavior directly in the execution plan analysis. When you click on a query, the EXPLAIN plan output shows Gather nodes, worker counts, and per-worker buffer statistics. Queries that the planner chose to run sequentially — despite being large enough for parallel execution — stand out by their high execution time relative to the table size.
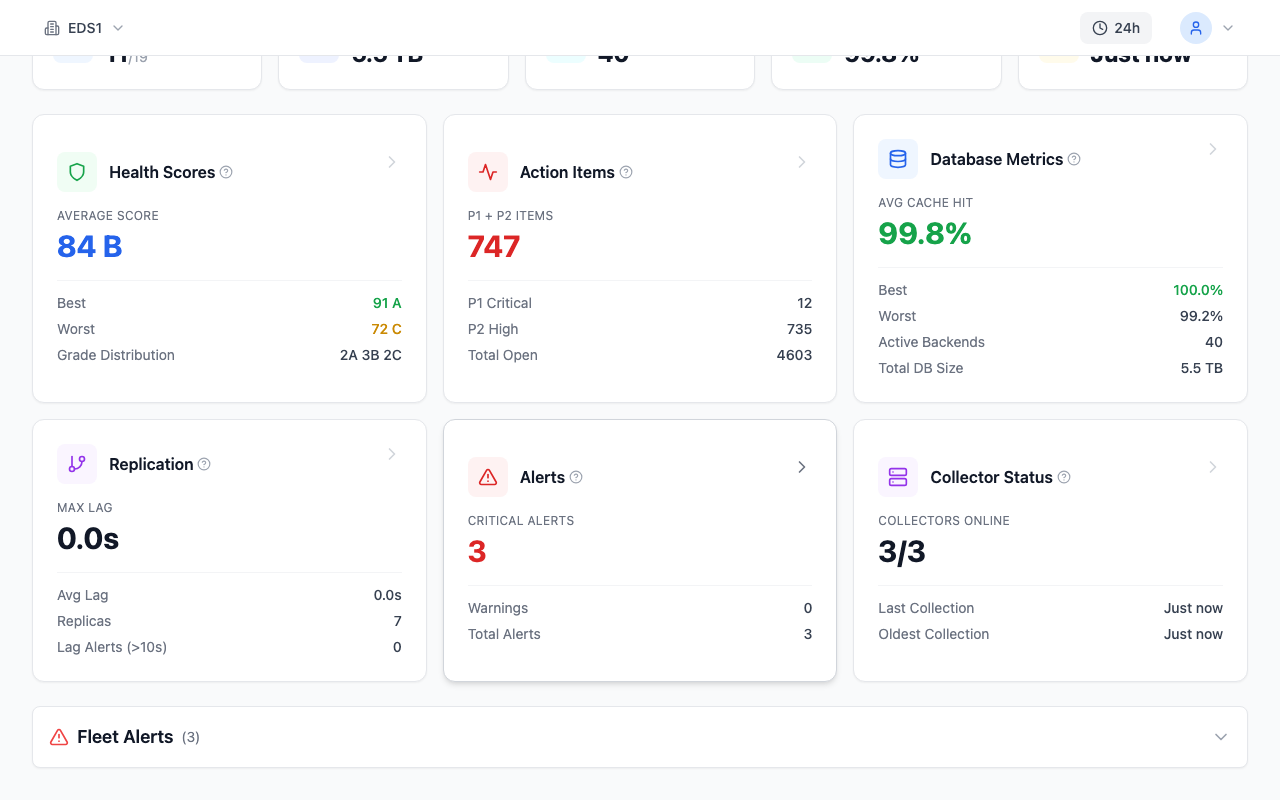
The Dashboard provides the CPU utilization context. When parallel queries run, CPU usage spikes proportionally to the number of workers. If CPU utilization is consistently low during slow analytical queries, it signals that parallelism is underutilized — the database has idle CPU capacity that could be applied to query execution. Conversely, CPU saturation during peak hours indicates that more parallel workers would add contention rather than speed.
How to Fix It
Tune for Analytical Workloads
If your database runs analytical queries on large tables (data warehousing, reporting, dashboards), increase parallel worker limits:
-- Increase per-query parallelism (session-level or postgresql.conf)
SET max_parallel_workers_per_gather = 4;

-- Increase total parallel workers available
ALTER SYSTEM SET max_parallel_workers = 16;

-- Ensure enough background worker slots
ALTER SYSTEM SET max_worker_processes = 20;

-- Lower the table size threshold for parallel scans
ALTER SYSTEM SET min_parallel_table_scan_size = '1MB';

-- Apply changes (max_worker_processes requires restart)
SELECT pg_reload_conf();
A rule of thumb: set max_parallel_workers_per_gather to half the number of CPU cores available, and max_parallel_workers to the total core count. On a 16-core server, max_parallel_workers_per_gather = 8 and max_parallel_workers = 16 allows full CPU utilization for a single large query while still sharing capacity with other sessions.
Lower the Cost Thresholds
The planner decides whether to parallelize based on cost estimates. If you find that queries on medium-sized tables are not using parallelism despite adequate configuration, lower the cost thresholds:
-- Make the planner more willing to parallelize
ALTER SYSTEM SET parallel_setup_cost = 100;    -- default: 1000
ALTER SYSTEM SET parallel_tuple_cost = 0.01;   -- default: 0.1
SELECT pg_reload_conf();
Lower parallel_setup_cost makes the planner consider parallelism for smaller operations. Lower parallel_tuple_cost reduces the estimated overhead of transferring tuples between workers and the leader, making parallel plans look cheaper to the planner.
Force or Disable Parallelism for Specific Queries
For testing or specific workloads, you can override parallel behavior at the session or query level:
-- Force maximum parallelism for a reporting query
SET LOCAL max_parallel_workers_per_gather = 8;
SET LOCAL parallel_setup_cost = 0;
SET LOCAL parallel_tuple_cost = 0;

SELECT region, count(*), avg(order_total)
FROM orders
GROUP BY region;

-- Disable parallelism for an OLTP-sensitive session
SET LOCAL max_parallel_workers_per_gather = 0;
Set Table-Level Parallel Workers
For critical large tables that benefit most from parallelism, set the maximum workers directly on the table:
-- Allow up to 8 workers for scans on this specific table
ALTER TABLE orders SET (parallel_workers = 8);

-- Verify
SELECT relname, reloptions
FROM pg_class
WHERE relname = 'orders';
This overrides the planner's automatic worker count calculation for this table. It is useful when you know a table is large and frequently scanned, and you want to guarantee full parallelism regardless of the planner's cost estimate.
Which Operations Parallelize?
Not all query operations support parallel execution. As of PostgreSQL 18:
| Operation | Parallel Support | |-----------|-----------------| | Sequential Scan | Yes | | B-tree Index Scan | Yes | | Bitmap Heap Scan | Yes | | Hash Join | Yes (build and probe) | | Merge Join | Yes (with Gather Merge) | | Nested Loop | Yes (outer side only) | | Aggregate (count, sum, avg) | Yes (partial + finalize) | | Hash Aggregate / Group By | Yes | | CREATE INDEX | Yes (B-tree only) | | Append (UNION ALL, partition pruning) | Yes |
Operations that do not parallelize: UPDATE, DELETE, CTEs (WITH queries), cursors, queries with FOR UPDATE/SHARE, and functions marked PARALLEL UNSAFE.
Verify the Improvement
After changing settings, measure the actual impact:
-- Compare sequential vs parallel execution
-- First, disable parallelism
SET LOCAL max_parallel_workers_per_gather = 0;
EXPLAIN (ANALYZE, BUFFERS, TIMING)
SELECT customer_region, count(*), sum(order_total)
FROM orders
GROUP BY customer_region;

-- Then, enable parallelism
SET LOCAL max_parallel_workers_per_gather = 4;
EXPLAIN (ANALYZE, BUFFERS, TIMING)
SELECT customer_region, count(*), sum(order_total)
FROM orders
GROUP BY customer_region;
Compare the Execution Time in both plans. The parallel plan should show a Gather node with workers, and the total execution time should be roughly sequential_time / (1 + num_workers) — though the actual speedup is typically 60-80% of theoretical due to Gather overhead.
How to Prevent It
Establish clear parallel query policies based on your workload type:
OLAP / Analytical databases: Set aggressive parallel parameters. max_parallel_workers_per_gather = CPU_cores / 2, max_parallel_workers = CPU_cores, lower cost thresholds. These databases benefit most from parallelism — large table scans, aggregations, and joins are their primary workload.
OLTP databases: Keep defaults or reduce parallelism. High-concurrency transactional workloads with many short queries do not benefit from parallelism — the overhead of spawning and coordinating workers exceeds the speedup on small queries. Set max_parallel_workers_per_gather = 0 or 1 for OLTP connections.
Mixed workloads: Use connection-level settings. Reporting connections (from your BI tool or dashboard) get high max_parallel_workers_per_gather, while application connections get low or zero. Set this in the connection's session initialization, not globally.
Monitor parallel worker utilization over time in myDBA.dev. If Workers Launched is consistently less than Workers Planned in your query plans, the system is running out of parallel workers and you need to increase max_parallel_workers. If CPU utilization spikes to 100% during parallel queries, you have too many workers competing — reduce max_parallel_workers_per_gather or stagger the reporting workload.
Remember that work_mem applies per worker. A query with work_mem = 256MB and 4 parallel workers can use up to 1.28 GB of memory for sorting and hashing. Account for this in your total memory budget: max_connections max_parallel_workers_per_gather work_mem should not exceed available RAM after shared_buffers and OS needs.
FAQ
How do I enable parallel query in PostgreSQL?
Parallel query is enabled by default in PostgreSQL 10+. The key parameter is max_parallel_workers_per_gather — set to 2 by default. To increase parallelism, raise this value and ensure max_parallel_workers and max_worker_processes are high enough to accommodate the additional workers. No restart is needed for max_parallel_workers_per_gather or max_parallel_workers (reload is sufficient), but max_worker_processes requires a restart.
How do I disable parallel query in PostgreSQL?
Set max_parallel_workers_per_gather = 0 to disable parallel query execution. This can be done globally in postgresql.conf, per-database with ALTER DATABASE, per-user with ALTER ROLE, or per-session with SET. Disabling globally is appropriate for OLTP databases where parallel overhead hurts more than it helps. Per-session disabling is useful for specific connections that should not trigger parallel workers.
Does parallel query work with UPDATE and DELETE?
No. As of PostgreSQL 18, UPDATE and DELETE operations do not support parallel execution. The scan portion of these operations can use parallel workers (e.g., the WHERE clause evaluation), but the actual modification happens sequentially. For large bulk updates or deletes, consider partitioning the operation into batches or using CREATE TABLE AS SELECT to rebuild the data in parallel.
How many parallel workers should I use?
Start with max_parallel_workers_per_gather set to half your CPU cores for analytical workloads. Monitor CPU utilization and adjust — if CPU stays below 70% during large queries, increase workers. If CPU hits 100% and other sessions slow down, decrease workers. The planner automatically reduces worker count for smaller tables, so a high maximum does not mean every query uses all workers.