Automatic EXPLAIN Plan Collection: Stop Guessing Why Queries Are Slow
Automatic EXPLAIN Plan Collection: Stop Guessing Why Queries Are Slow
The Problem
Most DBAs never run EXPLAIN until something is on fire. A query degrades gradually over weeks as a table grows from 2 million to 20 million rows, the planner's cost estimates shift, and execution time creeps from 50ms to 500ms. Nobody notices because the change is incremental — until one day it crosses a threshold and response times spike.
The worse scenario is a sudden plan change. PostgreSQL runs ANALYZE, statistics shift slightly, and the planner switches from an index scan to a hash join. A query that ran in 5ms now takes 250ms. You know something got slow, but you have no baseline plan to compare against because nobody was collecting them.
Manual EXPLAIN requires you to know which query to check and when to check it. The 50 queries that were fine yesterday could have 3 with degraded plans today, and you will not know unless you run EXPLAIN on each one. In practice, nobody does this. You have hundreds of query templates running against dozens of tables, and the idea of manually running EXPLAIN on all of them every few hours is not realistic.
The result is that most teams operate reactively. They wait for alerts, then scramble to figure out what went wrong. By the time someone runs EXPLAIN during an incident, the pressure is on and the context is lost — you are comparing against a plan you remember from weeks ago, if you remember it at all.
How to Detect It
You can manually run EXPLAIN on individual queries to inspect the execution plan:
-- Basic EXPLAIN shows the planner's chosen strategy
EXPLAIN (FORMAT JSON, VERBOSE)
SELECT o.order_id, c.customer_name
FROM orders o
JOIN customers c ON c.customer_id = o.customer_id
WHERE o.order_date > '2025-01-01'
  AND o.total_amount > 500;

-- EXPLAIN ANALYZE actually executes the query and shows real timing
EXPLAIN (ANALYZE, BUFFERS, FORMAT TEXT)
SELECT * FROM events
WHERE event_type = 'purchase'
  AND created_at > now() - interval '7 days';
Look for these warning signs in the output:
- Seq Scan on large tables where an index scan is expected
- Nested Loop with high actual row counts (indicates bad cardinality estimates)
- Hash Join with a build side larger than
work_mem(spills to disk) - Sort with
Sort Method: external merge(also spilling to disk) - Large gap between
rows=estimates and actual rows (planner misjudging selectivity)
The gap in this approach is coverage. Running EXPLAIN manually tells you about one query at one point in time. To catch regressions, you would need to run EXPLAIN on every active query template periodically, store the results, and compare them over time. That requires infrastructure that most teams do not build.
On PostgreSQL 16 and later, EXPLAIN (GENERIC_PLAN) generates a plan without executing the query and without needing specific parameter values. This makes automated collection safe — no risk of accidentally running a destructive query or waiting for a slow one to complete.
How myDBA.dev Shows It
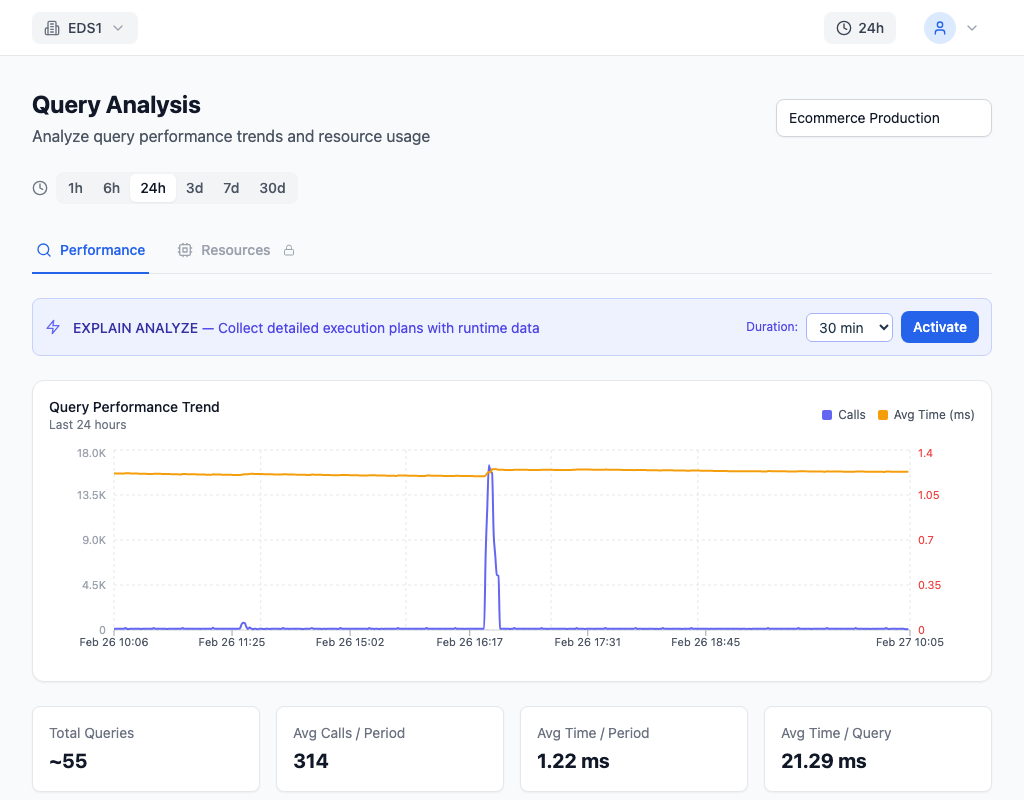
myDBA.dev collects EXPLAIN plans automatically every 5 minutes for the top 50 slowest queries on each monitored connection. On PostgreSQL 16+, it uses GENERIC_PLAN — the plan is generated without executing the query, making collection safe even for expensive or write-heavy statements. Each collected plan is analyzed and assigned a performance grade from A (optimal) to F (critical issues).
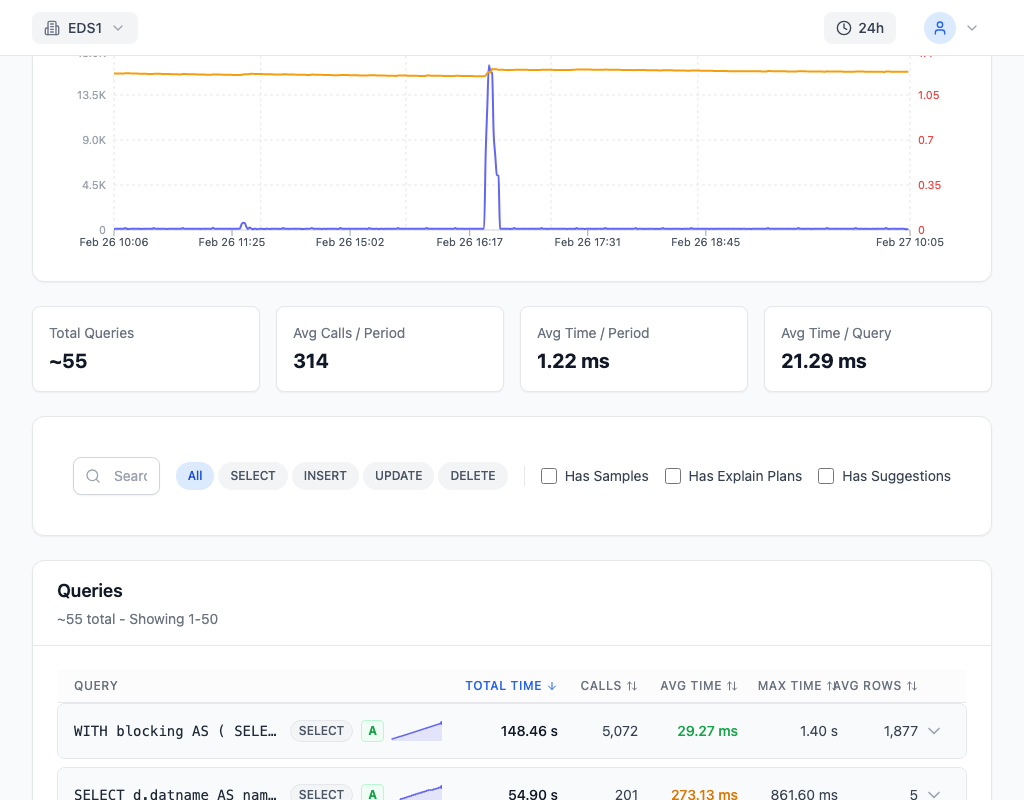
The Queries page shows every query template with its grade, call count, total time, average time, and trend sparklines. Queries graded D or F have specific recommendations — such as "Sequential scan on large table — consider adding an index" or "Hash join spilling to disk — increase work_mem for this query." You can scan the full list and immediately identify which queries need attention without connecting to the database.
Clicking into a specific query reveals the full plan visualization. The tree view shows each node with its actual vs. estimated rows, timing, and buffer usage. The flame graph makes it immediately obvious which node consumes the most time. The timing waterfall shows the sequential execution flow, and the bottleneck bar highlights the single most expensive operation. This replaces the process of reading raw EXPLAIN output and mentally reconstructing the execution flow.
How to Fix It
When you find a query with a poor plan grade, the fix depends on what the plan reveals:
High estimated vs. actual rows (bad cardinality estimate):
-- Update statistics to give the planner better data
ANALYZE orders;

-- For columns with non-uniform distributions, increase statistics target
ALTER TABLE orders ALTER COLUMN customer_id SET STATISTICS 1000;
ANALYZE orders;
Sequential scan where an index scan is expected:
-- Create the missing index
CREATE INDEX CONCURRENTLY idx_orders_date_amount
    ON orders (order_date, total_amount);
Hash join or sort spilling to disk:
-- Increase work_mem for the session (not globally)
SET work_mem = '256MB';
-- Then re-run the query and verify the plan changed
Understanding performance grades:
- A-B: Plan is reasonable. The query is using indexes efficiently and estimates are accurate. No action needed.
- C: Minor inefficiencies. Perhaps a slightly suboptimal join order or an index scan that could be an index-only scan. Worth investigating but not urgent.
- D-F: Significant problems. Sequential scans on large tables, sort or hash operations spilling to disk, nested loops with high row counts. These queries are candidates for immediate optimization.
The grade considers multiple factors: node types, buffer usage, row estimate accuracy, and spill-to-disk operations. A single sequential scan on a 100-row lookup table will not trigger a bad grade — the analysis accounts for table size and actual impact.
How to Prevent It
Make EXPLAIN plan collection automatic rather than reactive. Waiting for an incident to run EXPLAIN means you are always debugging without a baseline. Continuous plan collection gives you a historical record — when a query degrades, you can compare the current plan to the one from last week and see exactly what changed.
Review query grades weekly. A query that drops from B to D between deploys likely has a new access pattern or is hitting a table that grew past a planner threshold. Catching this during a routine review is vastly preferable to catching it during a 2am incident.
Set track_activity_query_size to at least 4096 (default is 1024) so that long queries are not truncated in pg_stat_activity. Truncated queries cannot be EXPLAINed. myDBA.dev flags this configuration issue in its health checks automatically, ensuring your monitoring infrastructure is not silently losing data.