The Slow Query Hidden Inside Your PL/pgSQL Function
The Slow Query Hidden Inside Your PL/pgSQL Function
The Problem
A function call takes 800ms but you cannot find a matching slow query in pg_stat_statements. You search for queries averaging over 100ms, check the top entries by total time, and the function does not appear. This is not a monitoring gap — it is how PostgreSQL works.
When a PL/pgSQL function runs, each SQL statement inside it is tracked separately in pg_stat_statements. A function that runs 40 internal queries will appear as 40 separate query templates, each individually fast — maybe 15-20ms each. None of them cross the threshold that would flag them as slow. But the function call as a whole takes 800ms because it is calling those 40 queries in a loop, with PL/pgSQL overhead between each execution.
This pattern is extremely common in applications that use database functions for business logic. An process_order() function might validate inventory, calculate discounts, insert order lines, update stock levels, and record an audit log — all in a single function call. Each step is fast, but the total duration is the sum of all steps plus the PL/pgSQL interpreter overhead.
The problem gets worse with row-by-row processing. A function that iterates over 500 rows using a FOR loop, running 3 queries per iteration, executes 1,500 individual queries. Each query takes 1ms. The function takes 2 seconds — but no individual query shows up as slow. The performance problem is the loop, not any single query inside it.
Without function-level monitoring, these performance issues are invisible. The application layer sees the 800ms call and blames "the database," but query-level tools show nothing wrong because no individual query is slow.
How to Detect It
PostgreSQL has built-in function monitoring through pg_stat_user_functions, but it is disabled by default:
-- Check if function tracking is enabled
SHOW track_functions;
-- 'none' (default) = no tracking
-- 'pl' = track PL/pgSQL and other procedural language functions
-- 'all' = track all functions including built-in SQL functions

-- Enable tracking for procedural language functions
ALTER SYSTEM SET track_functions = 'pl';
SELECT pg_reload_conf();
Once enabled, query function statistics:
-- Find the slowest functions by total time
SELECT
    schemaname,
    funcname AS function_name,
    calls AS call_count,
    round(total_time::numeric, 2) AS total_time_ms,
    round(self_time::numeric, 2) AS self_time_ms,
    round((total_time / NULLIF(calls, 0))::numeric, 2) AS avg_time_ms,
    round((self_time / NULLIF(calls, 0))::numeric, 2) AS avg_self_time_ms
FROM pg_stat_user_functions
ORDER BY total_time DESC
LIMIT 20;
The distinction between total_time and self_time is critical:
total_time: Wall-clock time including all SQL statements and nested function callsself_time: Time spent in the function body itself, excluding called functions and SQL
If self_time is much lower than total_time, the function is spending most of its time executing SQL statements or calling other functions. If self_time is close to total_time, the PL/pgSQL interpreter overhead itself is the bottleneck — usually indicating excessive looping or complex conditional logic.
The limitation of pg_stat_user_functions is that it shows aggregate statistics but does not break down which internal queries consume the most time. You know the function is slow, but not which of its 40 internal queries is the bottleneck.
How myDBA.dev Shows It
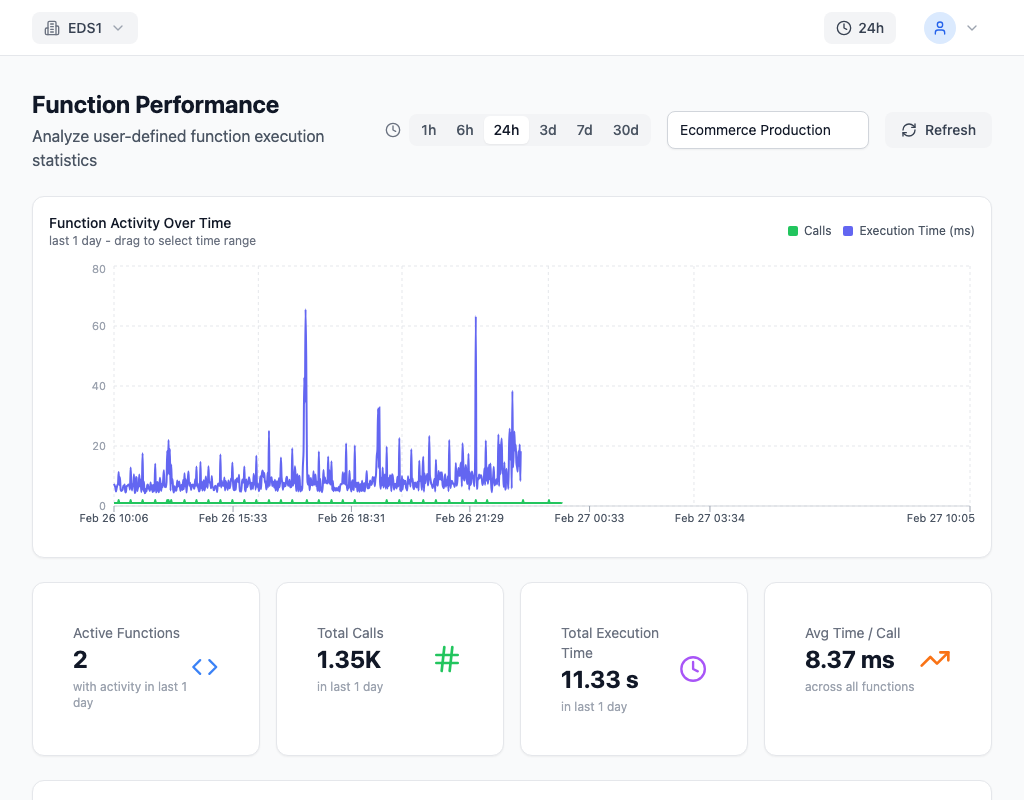
myDBA.dev's Functions page surfaces all tracked PL/pgSQL functions with their performance metrics. Each function row shows call count, total time, self-time, average duration, and a trend sparkline. Functions are sorted by total time by default, immediately highlighting the most expensive function calls across the database.
The self-time vs. total-time breakdown is displayed as a ratio. A function with 800ms total time and 50ms self-time tells you that 750ms is spent inside SQL statements — the function body itself is not the problem, the queries it runs are. Conversely, a function with 800ms total and 600ms self-time indicates that the PL/pgSQL interpreter is doing significant work — likely looping, string manipulation, or complex conditional logic that could be rewritten as set-based SQL.
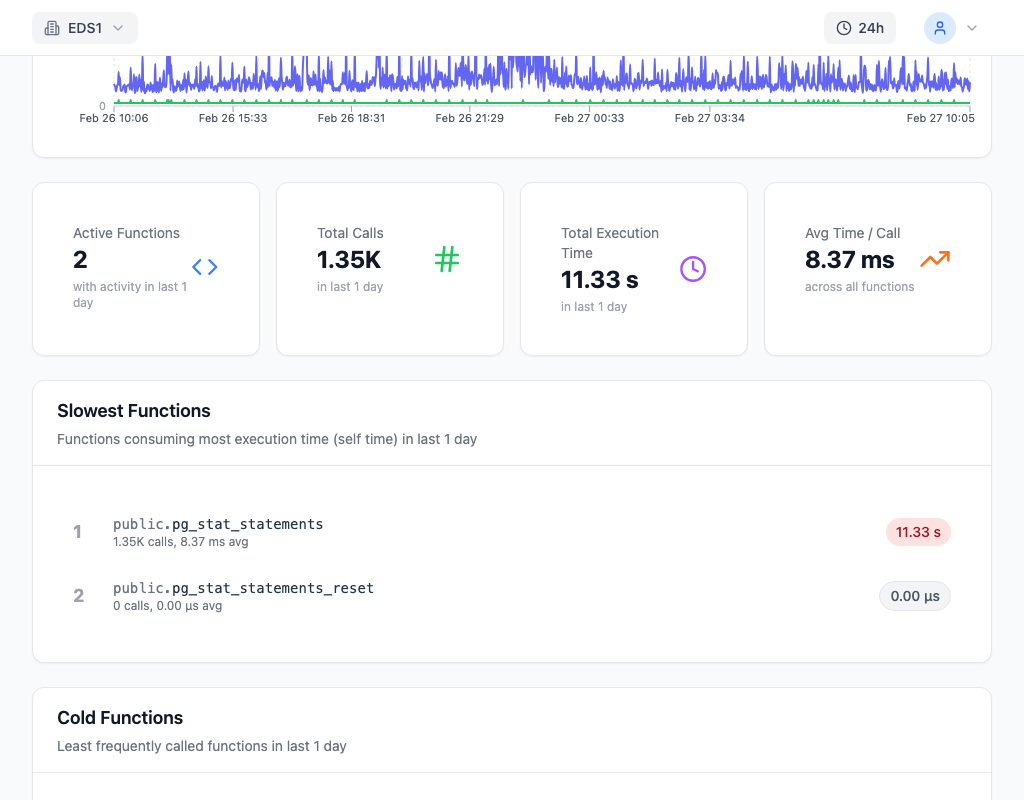
Drilling into a specific function reveals its internal query breakdown. Each SQL statement executed by the function is listed with its individual timing, call count, and percentage of the function's total time. This answers the question that pg_stat_user_functions alone cannot: "Which query inside this function is the bottleneck?" If one query accounts for 60% of the function's total time, that is where to focus optimization effort — not rewriting the entire function, but fixing the one expensive query inside it.
How to Fix It
The fix depends on whether the problem is a slow internal query, excessive looping, or function architecture.
Slow internal query — optimize the bottleneck query:
-- If the internal query does a sequential scan, add an index
CREATE INDEX CONCURRENTLY idx_order_lines_order_id
    ON order_lines (order_id);

-- If the query uses a suboptimal plan, check statistics
ANALYZE order_lines;
Row-by-row processing — replace loops with set-based SQL:
-- BEFORE: PL/pgSQL loop processing rows one at a time
FOR rec IN SELECT * FROM pending_orders LOOP
    UPDATE inventory SET stock = stock - rec.quantity
    WHERE product_id = rec.product_id;
END LOOP;

-- AFTER: Single set-based UPDATE (orders of magnitude faster)
UPDATE inventory i
SET stock = stock - po.quantity
FROM pending_orders po
WHERE i.product_id = po.product_id;
This single change can turn a 2-second function into a 20ms operation. Every row in the loop was a separate query execution with its own planning overhead, lock acquisition, and buffer lookups. The set-based version does it all in one pass.
EXCEPTION blocks creating hidden savepoints:
-- Each EXCEPTION block creates an implicit savepoint
-- This is expensive if called in a tight loop
BEGIN
    INSERT INTO audit_log (event) VALUES (v_event);
EXCEPTION WHEN unique_violation THEN
    -- This savepoint overhead adds up quickly
    NULL;
END;

-- Better: use ON CONFLICT instead
INSERT INTO audit_log (event) VALUES (v_event)
ON CONFLICT DO NOTHING;
Every EXCEPTION block in PL/pgSQL creates an implicit savepoint, which has overhead proportional to the amount of data modified in the current transaction. In a loop that runs thousands of times, the savepoint overhead alone can dominate execution time.
Nested function calls — flatten the call chain:
If function A calls function B which calls function C, each call adds PL/pgSQL interpreter overhead. Consider inlining the logic into a single function or replacing the chain with a single SQL query using CTEs.
How to Prevent It
Enable track_functions = 'pl' on every PostgreSQL instance. The overhead is negligible — it adds a timer around each function call — but the visibility it provides is essential. Without it, function performance is a complete blind spot.
Treat function duration as a first-class performance metric, just like query duration. Set a threshold for acceptable function execution time and investigate anything that exceeds it. A function averaging 500ms deserves the same scrutiny as a query averaging 500ms.
Prefer set-based SQL over procedural loops. A PL/pgSQL function should orchestrate operations, not iterate over rows. When a function's self-time is high relative to its total time, it is doing too much work in the interpreter and not enough in the SQL engine. myDBA.dev tracks function performance trends over time, making it straightforward to spot functions that are degrading as data volumes grow.