Is UNION ALL faster than UNION in PostgreSQL?
Usually yes, but that is the second question. UNION removes duplicate rows and UNION ALL does not, so UNION must sort or hash the whole combined result first. The extra cost scales with the total number of input rows. Choose UNION ALL when the branches cannot overlap — that is correctness, not tuning.
Key facts
| Fact | Value | |---|---| | What UNION adds | Duplicate elimination over the combined result; UNION ALL returns every row (SELECT docs) | | Plan shape for UNION | HashAggregate, or Unique over sorted input, above Append (using EXPLAIN) | | Plan shape for UNION ALL | A bare Append, nothing above it | | Memory budget for de-duplication | work_mem (default 4MB) × hash_mem_multiplier (default 2.0) for hash aggregation (resource config) | | Spill evidence in EXPLAIN ANALYZE | Batches: N … Disk Usage: NkB, or Sort Method: external merge Disk: NkB | | Measured below (2M rows, 200k distinct) | UNION ALL 322 ms, UNION 752 ms — about 2.3× | | ORDER BY / LIMIT binding | Applies to the whole set operation unless the branch is parenthesised (SELECT) | | Same behaviour elsewhere | INTERSECT and EXCEPT also de-duplicate by default; INTERSECT ALL / EXCEPT ALL do not | | Fleet observation | Across 46 monitored instances, 32.6% fail our temp-file health check — the same class of spill |
Why this happens
UNION eliminates duplicate rows from the combined result and UNION ALL does not (Combining Queries). PostgreSQL cannot know a row is unique until it has seen every other row, so de-duplication is a blocking operation over both branches.
There are two implementations. The planner can hash the combined rows and keep one entry per distinct value, which shows as HashAggregate; or it can sort them and discard adjacent equals, which shows as Unique over sorted input. Either way the work is proportional to the total number of rows entering the operation, not to the number of duplicates it finds. Two branches of a million rows that share nothing still pay to hash or sort two million rows.
That is the first thing people get wrong: "there are hardly any duplicates, so UNION is nearly free". The number of duplicates changes the output size, not the cost of finding it.
The second is memory. Sorts and hash aggregates get work_mem — 4MB by default — and hash aggregation multiplies that by hash_mem_multiplier, 2.0 by default (resource config). When the working set does not fit, the sort becomes an external merge on disk and the hash aggregate spills into batches.
The third is what UNION ALL lets the planner do structurally. A UNION ALL is flattened into an append relation, the same construct behind partitioned tables — which is why the docs mention "UNION ALL subqueries" alongside partitions when describing constraint exclusion. A UNION stays a subquery with a de-duplication node on top.
A popular corollary of that — "a UNION blocks the planner from pushing your outer WHERE clause into the branches" — did not hold up when measured, and the measurement is below. Related pull-up rules for subqueries and CTEs are genuinely restrictive; this particular case is not.
How to detect it
Build something reproducible. Everything below ran on a stock PostgreSQL 18 container with max_parallel_workers_per_gather = 0 and jit = off, purely so the plans stay short enough to read, and each statement was run twice with the second run pasted verbatim.
CREATE TABLE orders AS
SELECT g AS order_id,
       (g % 200000) AS customer_id,
       CASE WHEN g % 3 = 0 THEN 'shipped' ELSE 'cancelled' END AS status
FROM generate_series(1, 2000000) g;
VACUUM ANALYZE orders;   -- 95 MB heap, 2,000,000 rows, 200,000 distinct customers
EXPLAIN (ANALYZE, BUFFERS)
SELECT customer_id FROM orders WHERE status = 'shipped'
UNION ALL
SELECT customer_id FROM orders WHERE status = 'cancelled'; Append (cost=0.00..84320.00 rows=2000000 width=4) (actual time=0.125..274.783 rows=2000000.00 loops=1)
Buffers: shared hit=5266 read=19054
-> Seq Scan on orders (cost=0.00..37160.00 rows=658200 width=4) (actual time=0.124..78.227 rows=666666.00 loops=1)
Filter: (status = 'shipped'::text)
Rows Removed by Filter: 1333334
Buffers: shared hit=2586 read=9574
-> Seq Scan on orders orders_1 (cost=0.00..37160.00 rows=1341800 width=4) (actual time=0.246..104.941 rows=1333334.00 loops=1)
Filter: (status = 'cancelled'::text)
Rows Removed by Filter: 666666
Buffers: shared hit=2680 read=9480
Planning Time: 0.085 ms
Execution Time: 322.024 msA bare Append. Nothing sits above it; rows stream out as they are found. Now change one word:
EXPLAIN (ANALYZE, BUFFERS)
SELECT customer_id FROM orders WHERE status = 'shipped'
UNION
SELECT customer_id FROM orders WHERE status = 'cancelled';
HashAggregate (cost=191820.00..227445.00 rows=2000000 width=4) (actual time=689.787..745.012 rows=200000.00 loops=1)
Group Key: orders.customer_id
Planned Partitions: 16 Batches: 17 Memory Usage: 8345kB Disk Usage: 14920kB
Buffers: shared hit=6018 read=18302, temp read=1072 written=2835
-> Append (cost=0.00..84320.00 rows=2000000 width=4) (actual time=0.099..298.966 rows=2000000.00 loops=1)
Buffers: shared hit=6018 read=18302
-> Seq Scan on orders ... rows=666666.00
-> Seq Scan on orders orders_1 ... rows=1333334.00
Planning Time: 0.103 ms
Execution Time: 751.687 msFour things to read. HashAggregate is the de-duplication, and it is the whole 429 ms difference. Memory Usage: 8345kB confirms the budget is work_mem × hash_mem_multiplier, not work_mem. Batches: 17 with a non-zero Disk Usage means it did not fit and spilled, and the temp read=1072 written=2835 counters in BUFFERS are that spill in blocks. Finally, note rows=2000000 estimated against rows=200000.00 actual on the HashAggregate: the planner costed this as though no duplicates would be removed at all, which is worth remembering when a UNION sits under a join — see how the planner uses statistics.
With SET enable_hashagg = off the sort-based route appears, and it is not one big sort:
 Unique  (cost=301844.65..331844.65 rows=2000000 width=4) (actual time=339.539..669.012 rows=200000.00 loops=1)
   ->  Merge Append  (cost=301844.65..326844.65 rows=2000000 width=4) (actual time=339.536..584.524 rows=2000000.00 loops=1)
         Sort Key: orders.customer_id
         ->  Sort  (cost=109771.00..111416.50 rows=658200 width=4) (actual time=135.922..177.720 rows=666666.00 loops=1)
               Sort Method: external merge  Disk: 7840kB
         ->  Sort  (cost=192073.65..195428.15 rows=1341800 width=4) (actual time=203.611..292.119 rows=1333334.00 loops=1)
               Sort Method: external merge  Disk: 15688kB
 Execution Time: 676.598 ms
Each branch is sorted separately and merged, so each spills separately — two external merge lines, not one. Reading these node by node is covered in the hub guide.
How MyDBA shows this
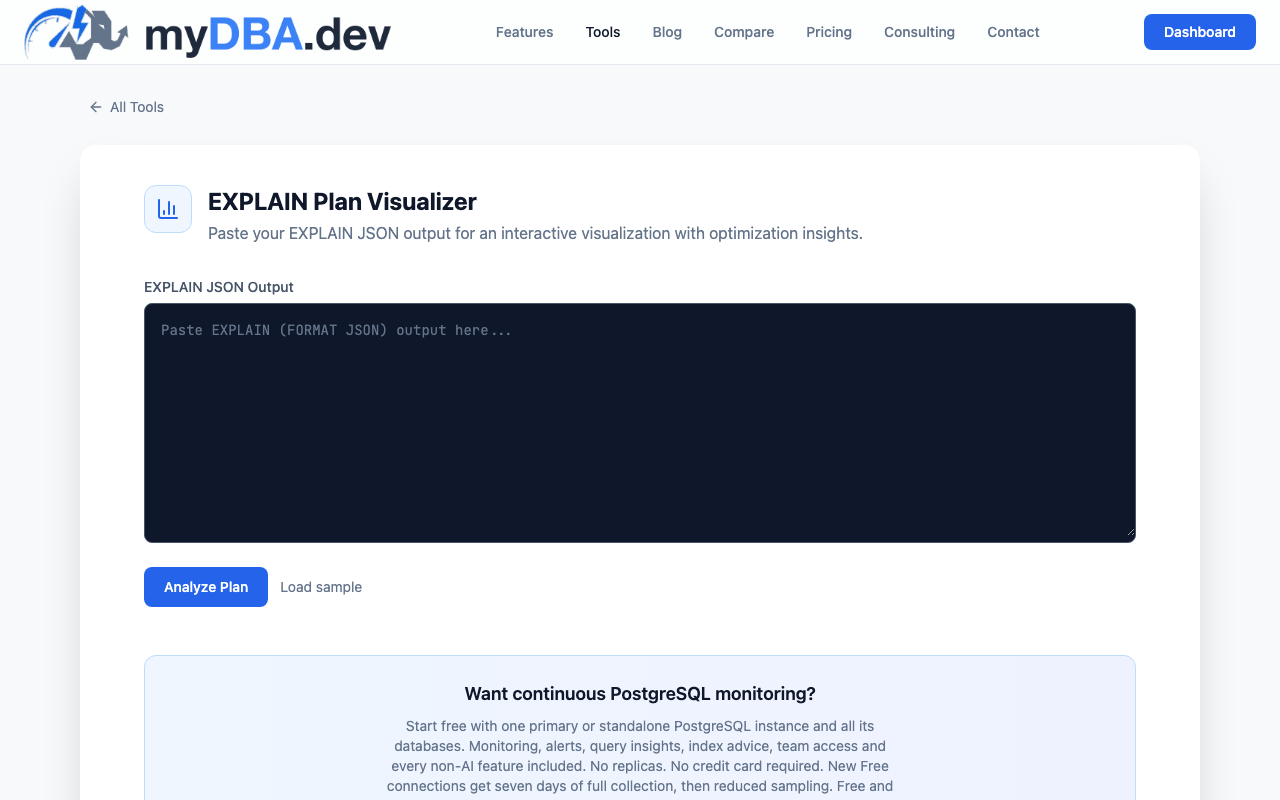
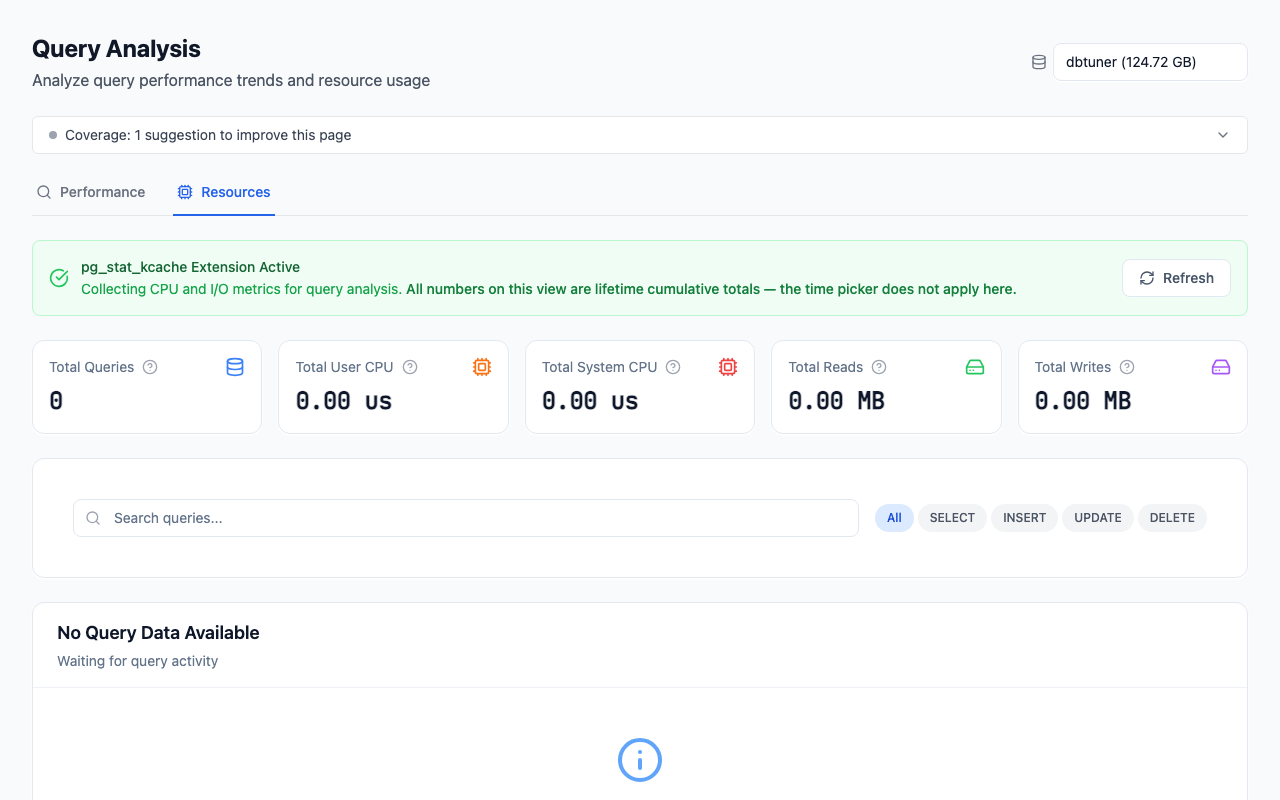
MyDBA keeps the collected plan for each query template, so the HashAggregate above the Append is visible without re-running anything, and the query detail view reports Temp Blocks Written per template — the counter that moves when a UNION stops fitting in work_mem. The Queries page also has a Resources view (CPU time, disk reads and writes per query, where pg_stat_kcache is installed) for ranking queries by the I/O they actually cause. It shows you the spill; whether the UNION was needed at all is still your call. Across 46 monitored instances, 32.6% currently fail our temp-file check and 7.9% of 38 instances fail the work_mem check, so spilling is common rather than exotic. If you want the same picture of your own instances, start with the free PostgreSQL health check.
How to fix it
1. Ask the correctness question first. Can the branches produce the same row? If they provably cannot — different tables, mutually exclusive predicates, disjoint key ranges — then UNION ALL is the correct operator and UNION is a bug waiting to be found. Writing UNION "just in case" hides duplicate rows your data should not contain. If duplicates do appear after switching, you have found a data problem, not a reason to switch back. 2. If duplicates are real but rare, remove them where it is cheap. A NOT EXISTS on the second branch is often cheaper than a set-wide de-duplication, because it discards rows before they enter the operation rather than after. 3. Do not assume more memory fixes it — measure. Re-running the UNION above with SET work_mem = '64MB' did exactly what the documentation says: Batches: 1 Memory Usage: 40985kB, no spill. Execution time went from 751 ms to 754 ms. The spill was not the problem here; hashing 2,000,000 rows was. Raise work_mem per statement when the spill is large, but check the plan afterwards instead of assuming a win — it is allocated per node, so a global increase multiplies across every concurrent query. 4. Fix the parenthesisation while you are there. ORDER BY and LIMIT attach to the whole set operation unless the branch is wrapped in parentheses (SELECT). To limit one branch you need (SELECT a FROM t1 ORDER BY a LIMIT 10) UNION ALL (SELECT a FROM t2 ORDER BY a LIMIT 10). People write the unparenthesised form, get the whole-set cost, and blame UNION. 5. Consider the OR-to-UNION rewrite in the other direction. When an OR across two columns stops an index being used, splitting it into two indexed branches combined with UNION ALL can be much faster. PostgreSQL can already combine indexes for OR via bitmap scans, so read the plan before rewriting. The caveat: a row matching both sides appears twice under UNION ALL, so either the predicates must be disjoint or you need UNION — and you are paying for de-duplication again. More of these trade-offs are in query rewriting techniques.
How to prevent it
Turn on log_temp_files — 0 logs every temp file, a value like 10MB logs only the ones worth reading. Every spilled de-duplication then names itself in the log with its size and its statement. Pair it with track_io_timing so the I/O attribution is measured rather than inferred.
In review, treat a bare UNION as a claim that the branches overlap, and ask for the case where they do. Usually nobody can produce one and the operator was habit. When UNION is right, re-check the plan after a data-volume change: a de-duplication that fit at 200,000 distinct values will not fit at 2,000,000, and the query gets slower without the SQL changing. Several common query anti-patterns fail the same way.
FAQ
Does a UNION stop the planner pushing my outer WHERE clause into the branches?
Measured on PostgreSQL 18, no. With the two branches wrapped in a view and WHERE customer_id = 42 applied outside it, both forms produced the same two Bitmap Index Scan nodes with Index Cond: (customer_id = 42) — the condition was pushed into each branch either way. The UNION version simply added Unique over Sort (quicksort Memory: 25kB) above the ten surviving rows, for 0.020 ms against 0.019 ms. The structural difference between an append relation and a de-duplicated subquery is real, but this particular consequence is folklore.
Do INTERSECT and EXCEPT behave the same way?
Yes. Both eliminate duplicates by default and both have ALL variants that do not (Combining Queries). INTERSECT also binds more tightly than UNION and EXCEPT, so a UNION b INTERSECT c means a UNION (b INTERSECT c). Parenthesise anything with more than two branches.
Is HashAggregate always better than sorting for a UNION?
No, and the gap is smaller than people expect. In the plans above the spilling HashAggregate took 752 ms and the sort-and-merge route 677 ms — the planner's preferred option was the slower one here. If EXPLAIN ANALYZE shows a high Batches count, that is worth investigating, but time both rather than assuming the hash wins.
Does UNION ALL ever return rows in a different order than UNION?
Neither guarantees any order without ORDER BY. UNION ALL usually looks branch-ordered because Append streams the branches in turn; UNION often looks sorted because the de-duplication sorted it. Both are accidents of the plan and both can change. If order matters, write ORDER BY.
Does UNION ALL help if both branches read the same table?
Only by removing the de-duplication. Both branches still scan the table — 24,320 buffers across the two Seq Scan nodes above, for a 95 MB table, because each branch reads it independently. If the branches differ only in a predicate, one scan with an OR or a CASE may beat both forms.
Part of the Reading PostgreSQL EXPLAIN and EXPLAIN ANALYZE Output guide. Last verified against PostgreSQL 18, 2026-09-17.