Find PostgreSQL performance problems.
See the evidence and plan your next step.
Track query performance, database health and index usage. Investigate changes with collected evidence, get prioritized recommendations, and review suggested fixes with your team.
Start free with one primary or standalone PostgreSQL instance and all its databases. Monitoring, alerts, query insights, index advice, team access and every non-AI feature included. No replicas. No credit card required.
Free uses full collection for the first seven days, then reduced sampling. Both plans keep 30 days of history; short-lived events can fall between samples.
The 24/7 DBA workflow · jump to a capability
Incident Analysis
When you have an outage, response times matter. MyDBA gathers the available before, during and after evidence to support an investigation. Review timelines and findings, with optional manual AI for further interpretation.
Learn morePhantom Incidents
MyDBA constantly looks for anomalies that aren't outages but could turn into them.
Learn moreSmart Tuning Advice
MyDBA identifies the places where your effort could produce the most benefit. We identify the highest-impact queries and analyse them to find the best candidates for tuning. Review suggested changes against your workload and validate their impact.
Learn moreSmart Alerting
Use the stock alerts out of the box or customise them to exactly what you need to alert on. Threshold, rate-of-change and compound rules cover common PostgreSQL risks.
Learn moreFrom deep evidence to safe action
MyDBA gives expert DBAs the full drill-down picture, and gives DevOps and software engineers the guidance to operate with DBA-level confidence.
Collect data your way
Shared managed and self-hosted collectors are included on every plan. Add a dedicated managed collector with its own IP when you need one.
Compare collection optionsMyDBA analyzes continuously
Rules, heuristics, and health checks constantly look for risks, anomalies, growing problems, and the next thing that needs attention.
See health checksAct safely with context
Action items, work plans, review workflows, and optional manual AI analysis help you understand what to do before anything changes.
See plans and reviewCollect your data the way you want to
Shared managed collection and self-hosted collector software are included on Free and Pro. Dedicated managed collectors cost £50 per machine per month and do not increase your monitoring allowance.
Shared managed collector
Included on every plan. We run the collector fleet for you, so you can connect cloud-hosted PostgreSQL without managing infrastructure.
Dedicated managed collector
£50 per machine per month. A collector just for your connections, managed by us, with a dedicated egress IP you can allowlist.
Self-hosted collector
Included on every plan. Run the collector in your network for private database access. Monitoring telemetry is sent to MyDBA over HTTPS.
Know what's wrong
Health checks that tell you what to do next
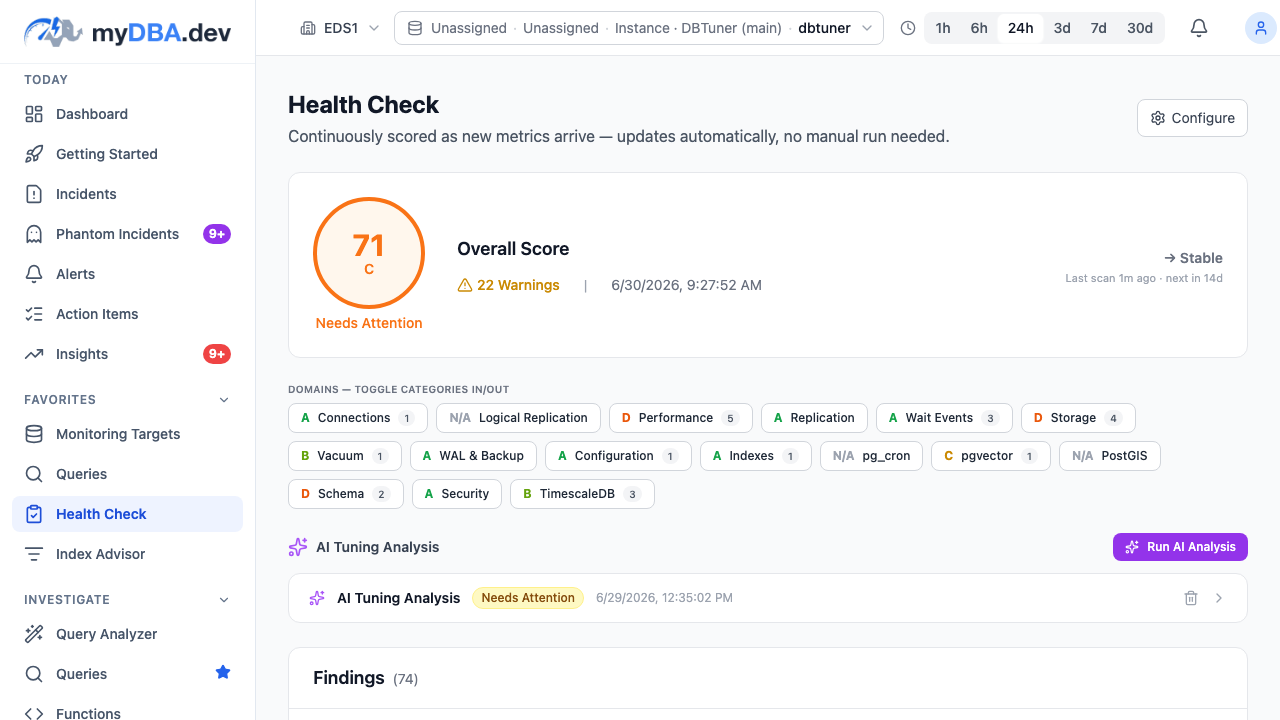
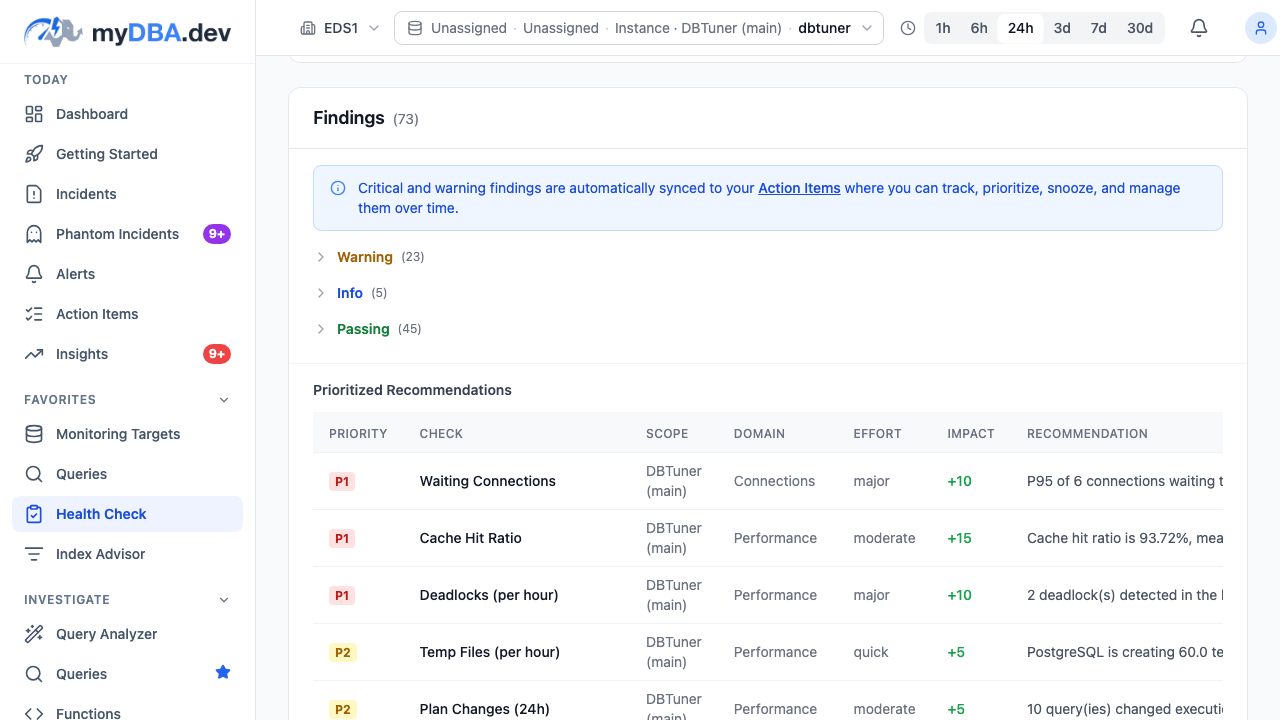
Automated health checks score your database across 12 domains using deterministic rules and PostgreSQL-specific heuristics. Each issue has a specific remedy and the SQL or next step to fix it — not just a metric that something is off.
- 75+ automated health checks — Score your database across indexing, vacuum, replication, locks, storage, and more
- Prioritised action items — P1 critical to P4 low — a single ranked list of what needs attention and why
- Cluster-aware analysis — Scores consider all instances — primaries, replicas, and cascading standbys
Optimise your schema
Cluster-aware index recommendations
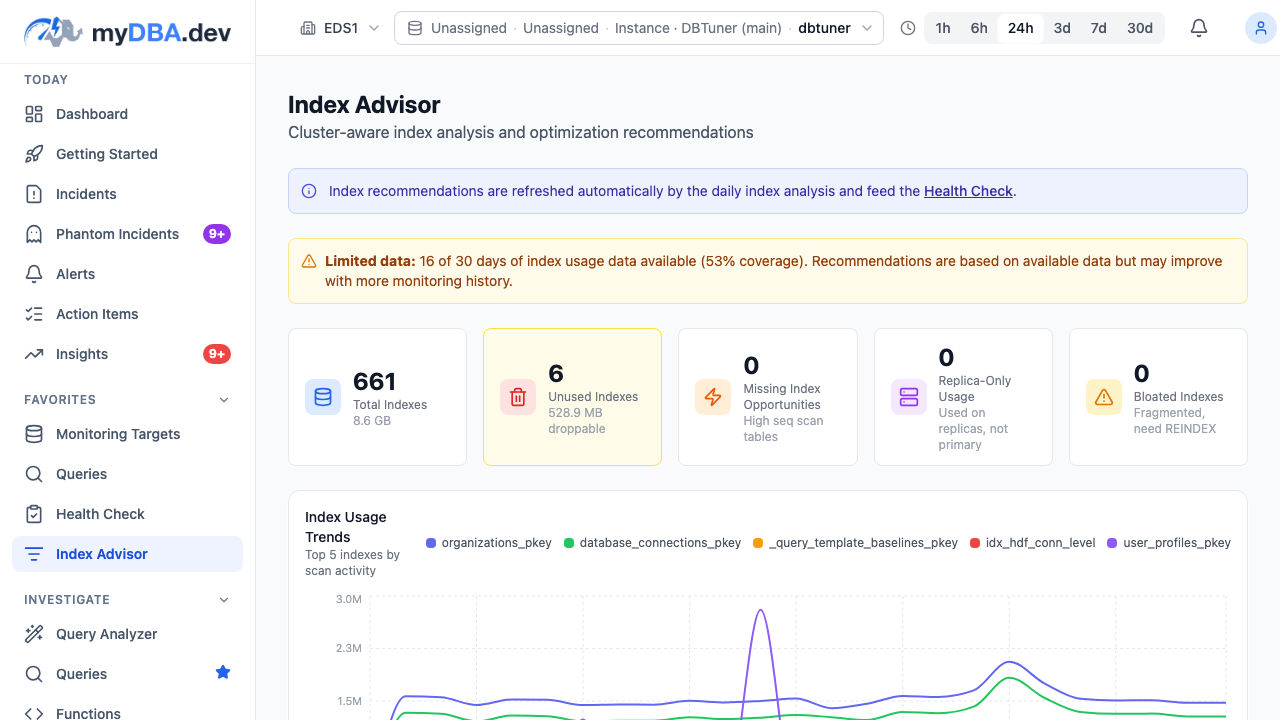
Identifies unused, missing, duplicate, and low-usage indexes across your entire cluster. Space-waste estimates and CREATE/DROP statements ready to execute.
- Unused, missing & duplicate detection — Scan every index across all databases and replicas in your cluster
- Schema diff with fix scripts — Auto-generated ALTER statements to bring schemas into parity
- Replica-aware analysis — Indexes critical on replicas won't be flagged for removal
Investigate what happened
Manual incident analysis with deep evidence
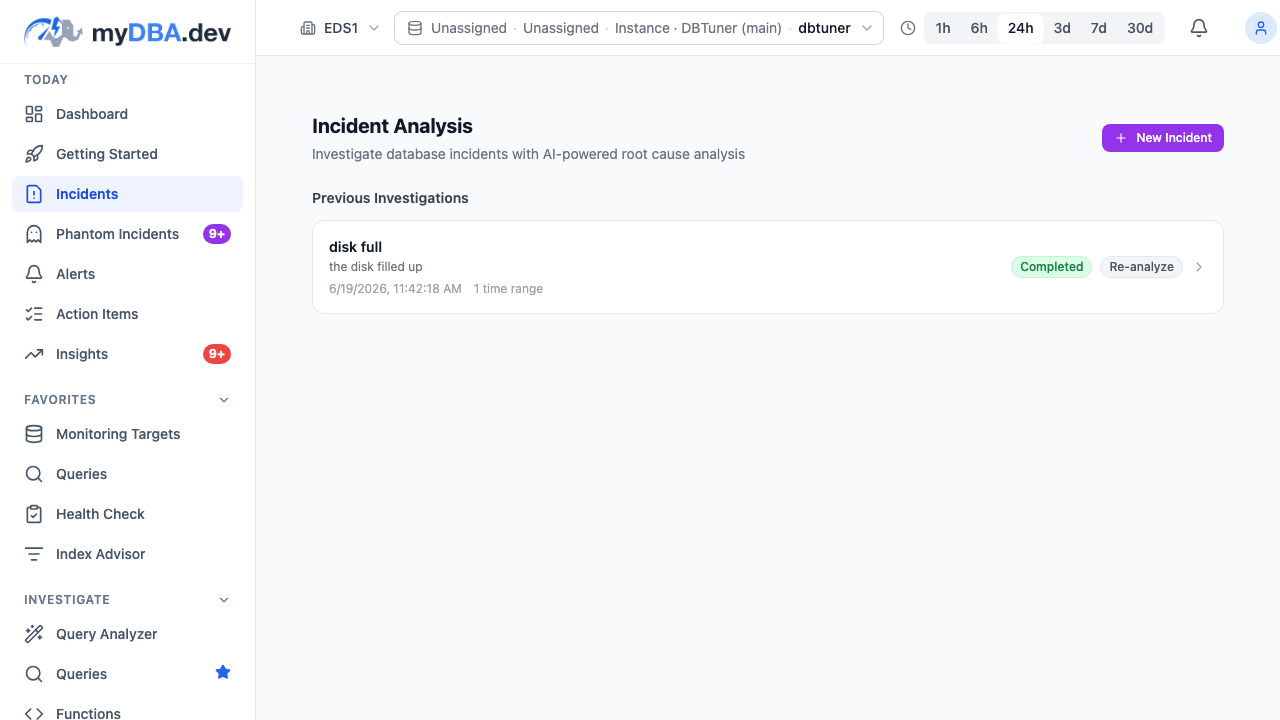
When something breaks, start an incident analysis from the time window you care about. MyDBA gathers the before, during, and after evidence; optional AI can add extra depth to the root cause, timeline, impact, and remediation report.
- Multi-window evidence — Error logs, locks, sessions, wait events, query stats, vacuum, and system metrics per frame
- Optional AI root cause & timeline — Manually triggered AI can turn the evidence into a shareable incident narrative
- Export & share — PDF/HTML export, evidence deep-links, full incident history
Manual AI, when you want it
Optional AI analysis for extra depth
MyDBA is not a black-box AI monitor. The core analysis runs through rules and PostgreSQL heuristics; AI is a manual option you can invoke for deeper explanation, tuning recommendations, incident analysis, and query-plan interpretation.
- Database-wide tuning analysis — Manually ask for a ranked review of configuration, workload, indexes, vacuum, waits, and plans
- Explanations grounded in collected evidence — Use AI to explain what the metrics, plans, and incidents mean in plain language
- Never automatic by default — Use an OpenRouter, OpenAI or Anthropic key on Free or Pro with no MyDBA monthly AI quota. Provider charges apply. New Pro includes 20 platform-funded AI operations per organization per UTC calendar month.
Get notified before it breaks
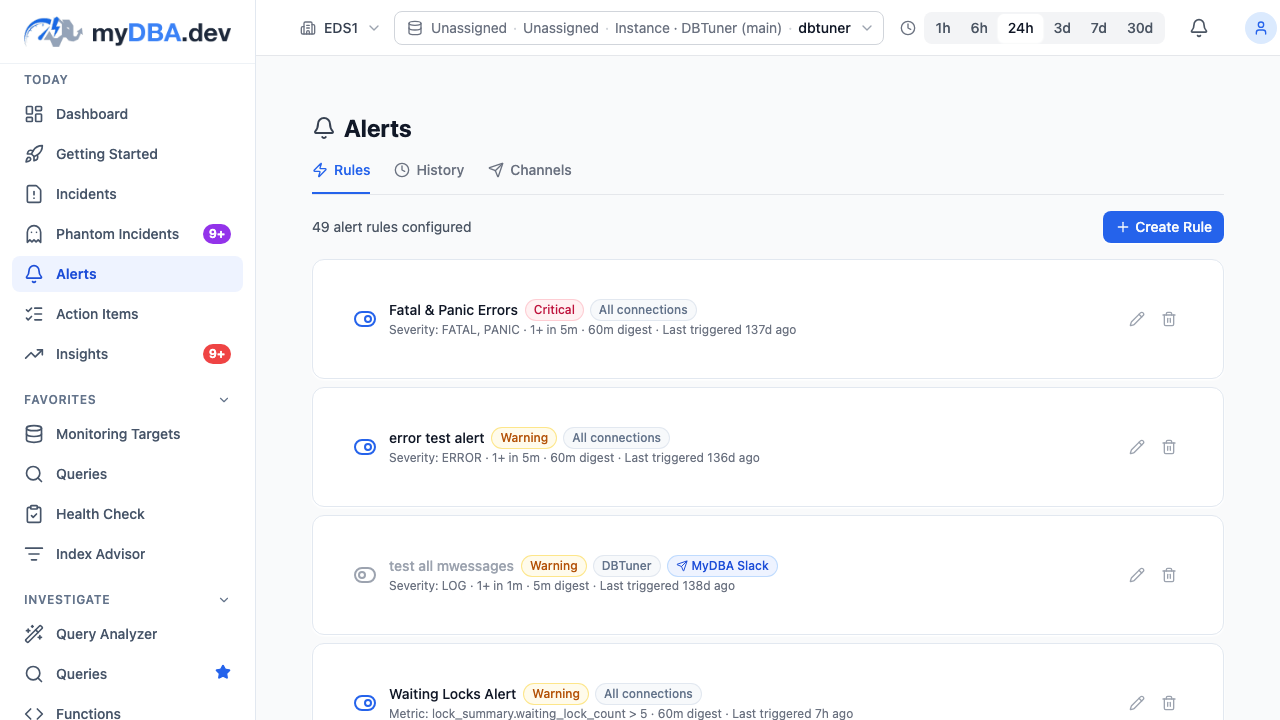
Smart alerting beyond thresholds
Rate-of-change alerts catch acceleration. Compound conditions cut false positives. 11 prebuilt templates get you running in minutes — with inline sparklines in every event.
- Rate-of-change detection — "+20% DB size in 60 min" catches incidents thresholds always miss
- Compound AND conditions — Combine metrics — "high connections AND low cache hit" — for real signal
- 11 prebuilt templates — XID risk, replica lag, bloat, idle-in-transaction, and 7 more — one click to enable
Work as a team
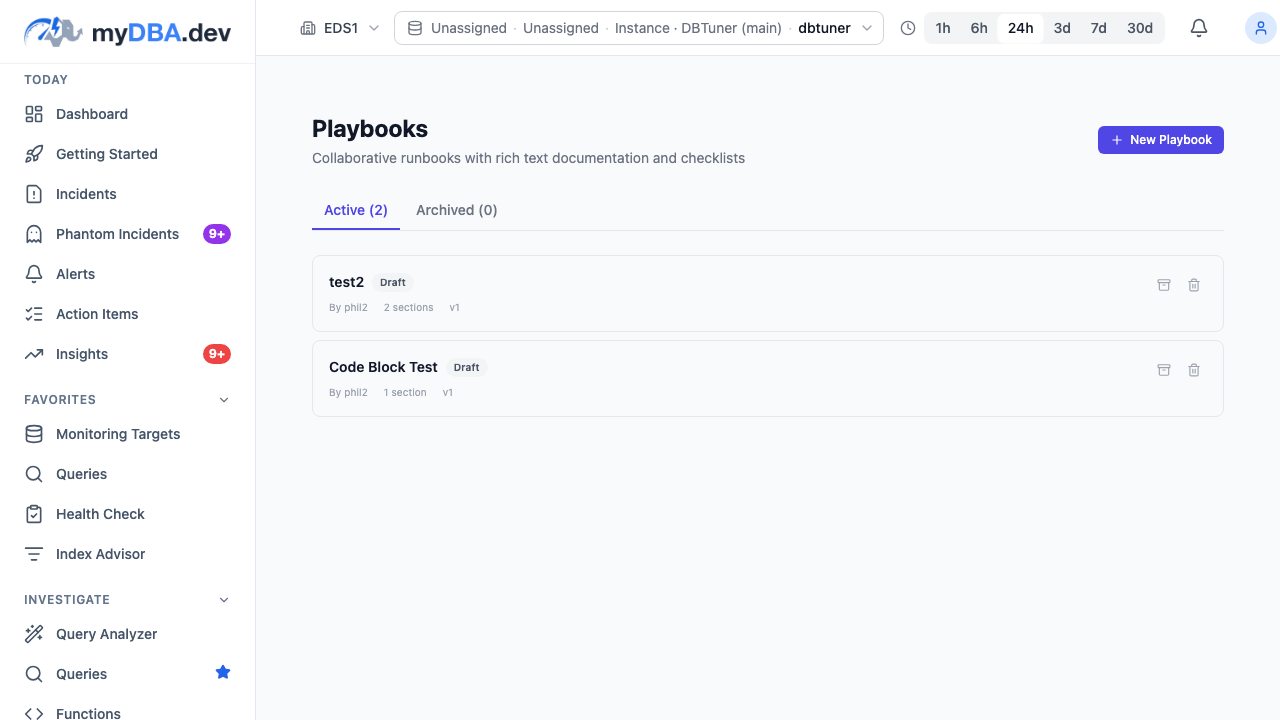
Collaborative playbooks & review
Turn EXPLAIN findings, schema diffs, health recommendations, and incident follow-ups into shared remediation plans. Request review, approve SQL before production, and keep a full audit trail.
- Reusable remediation plans — Send-to-plan from any page — EXPLAIN, schema diff, index recommendation
- Plan review workflow — Approval before production execution, with full audit history
- In-app notification inbox — Review requests, alerts, and plan status updates in one place
Understand every query plan
EXPLAIN Plan Advisor
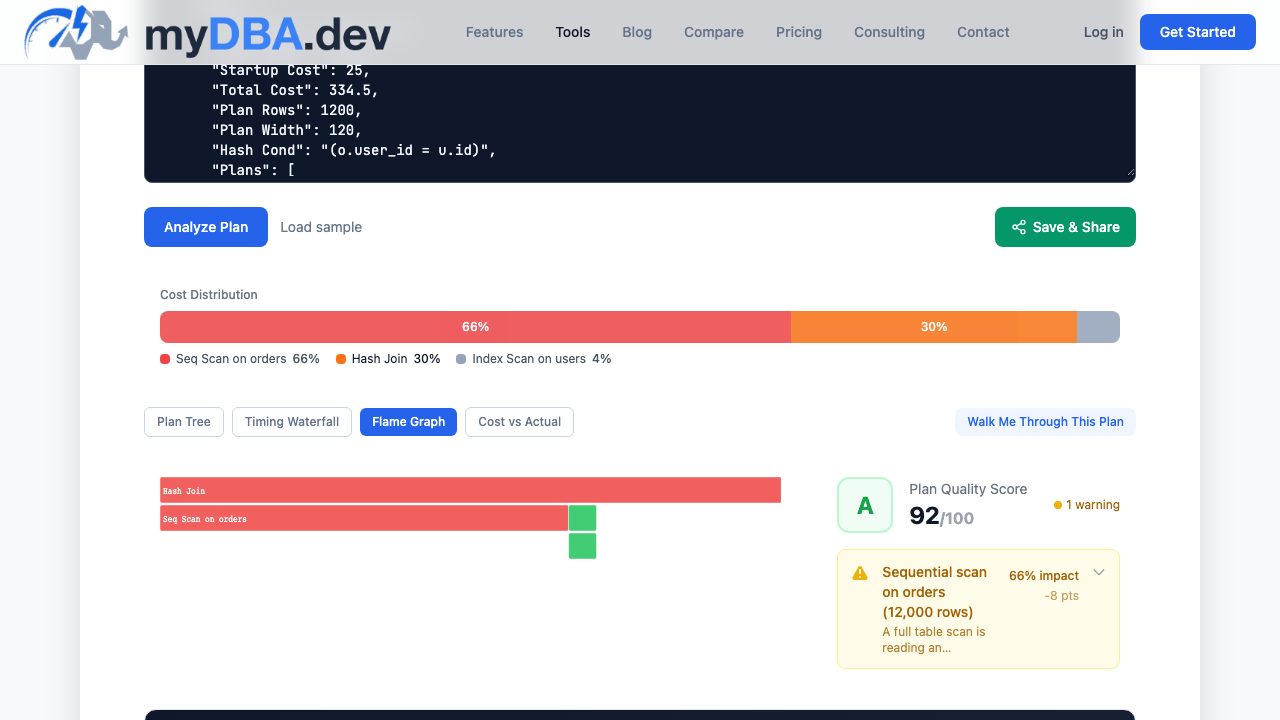
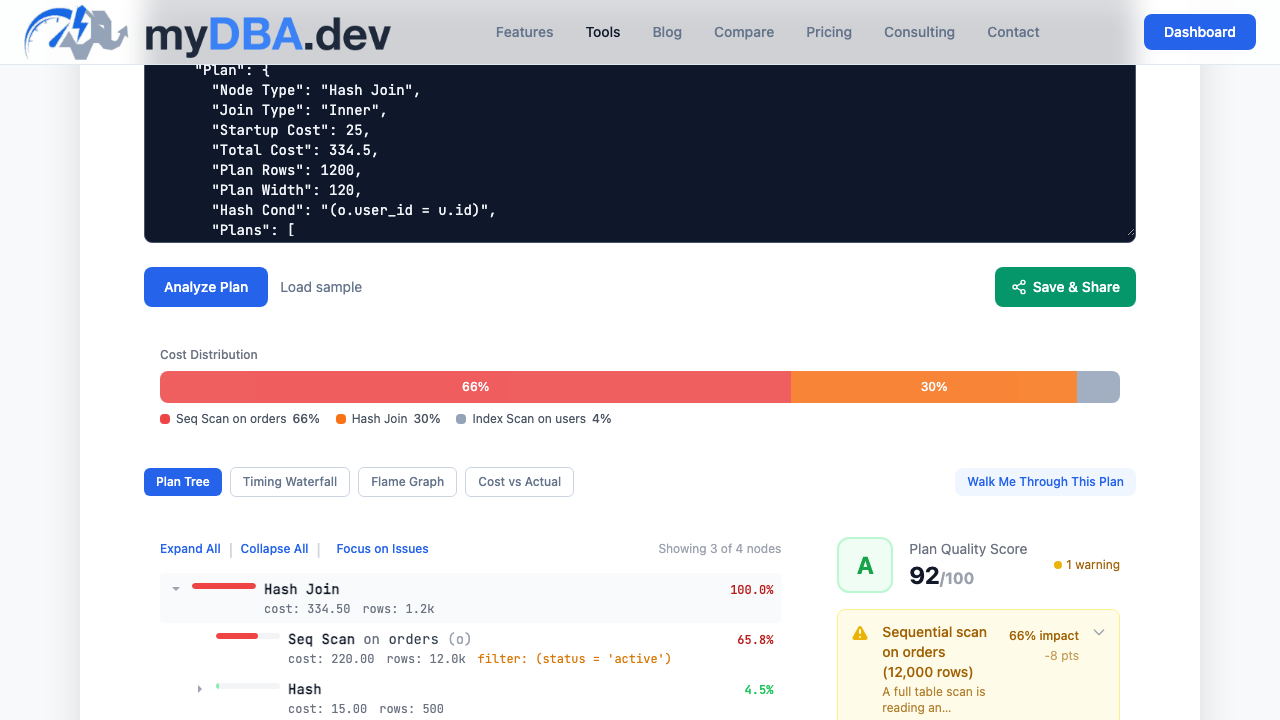
Visual plan analysis with 5 modes, guided walkthroughs that narrate each node in plain language, and automatic plan regression detection — not just raw EXPLAIN output.
- Visual plan analysis — Tree, flame graph, waterfall, bottleneck bar, and cost vs actual views
- Guided walkthrough — Step-by-step narration explains each node, highlights bottlenecks and misestimates
- Plan regression detection — Get alerted when a query switches to a slower execution plan
First-class extension monitoring
The only PostgreSQL monitor with dedicated TimescaleDB, pgvector, and PostGIS support
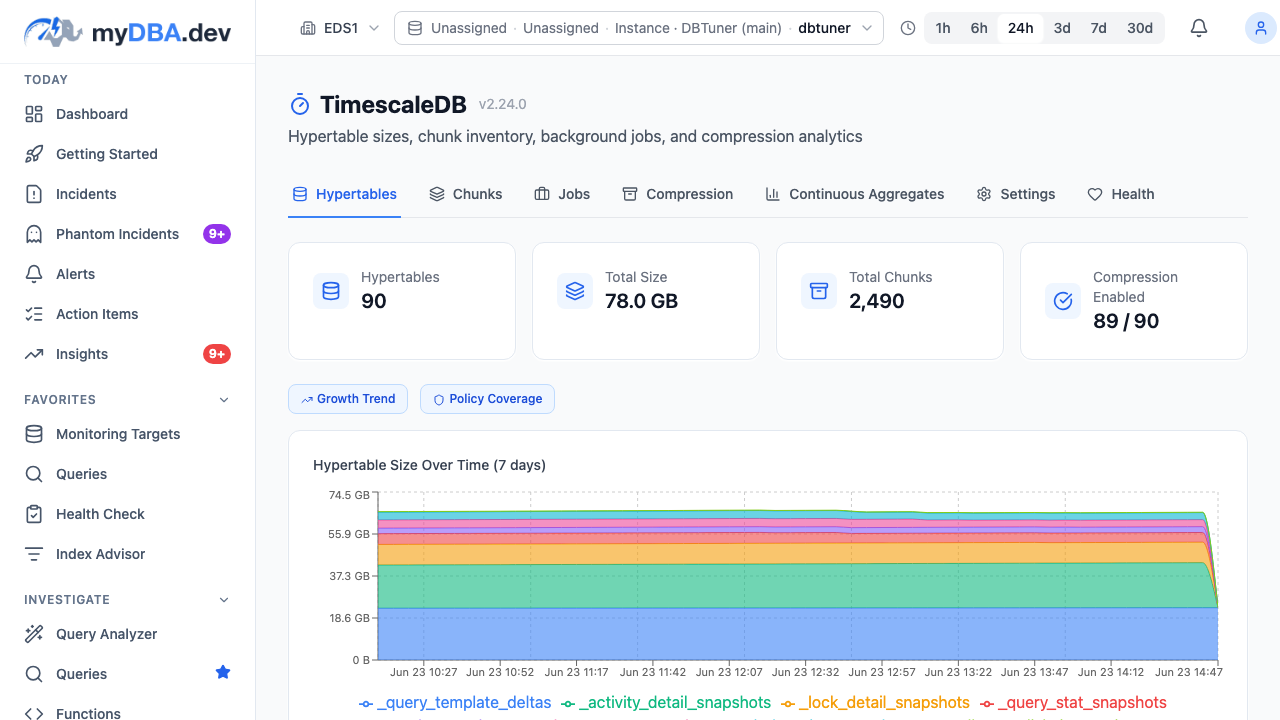
TimescaleDB
- Hypertable health checks & compression analytics
- Chunk-level visibility & growth trends
- Background job tracking & retention policies
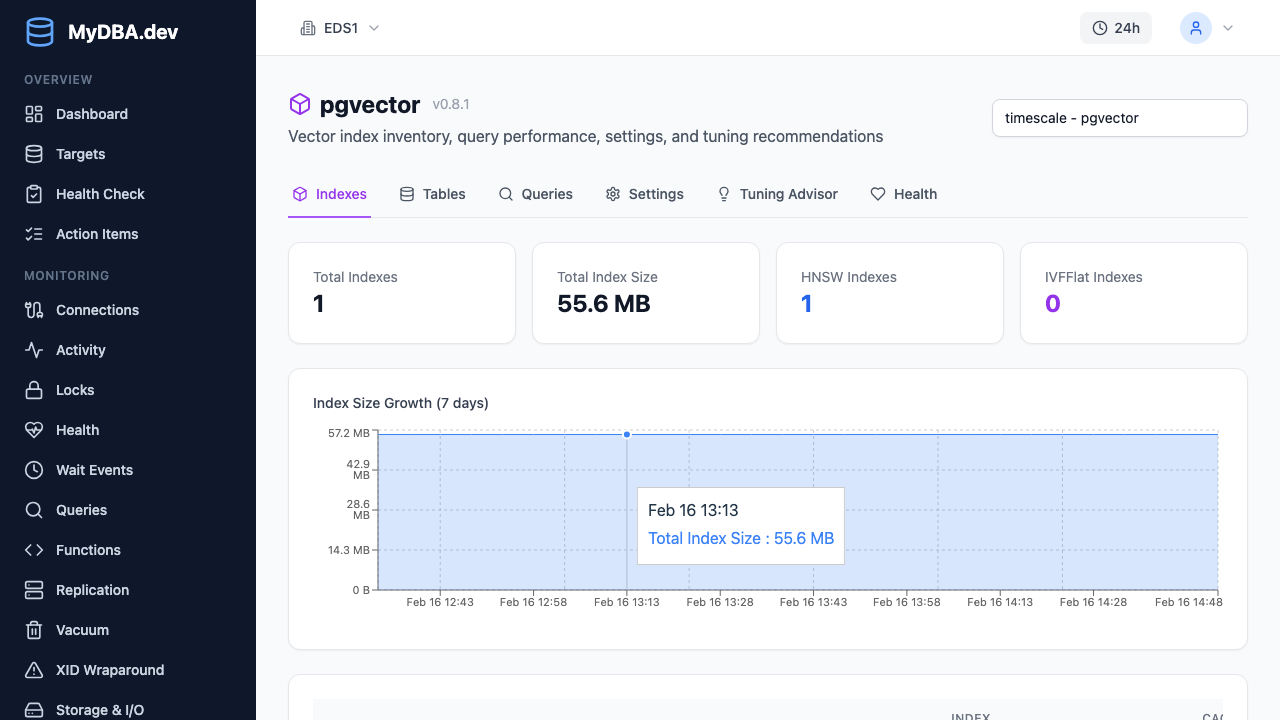
pgvector
- Index inventory — IVFFlat, HNSW, dimensions & build params
- Vector query performance & scan type tracking
- Settings audit & tuning recommendations
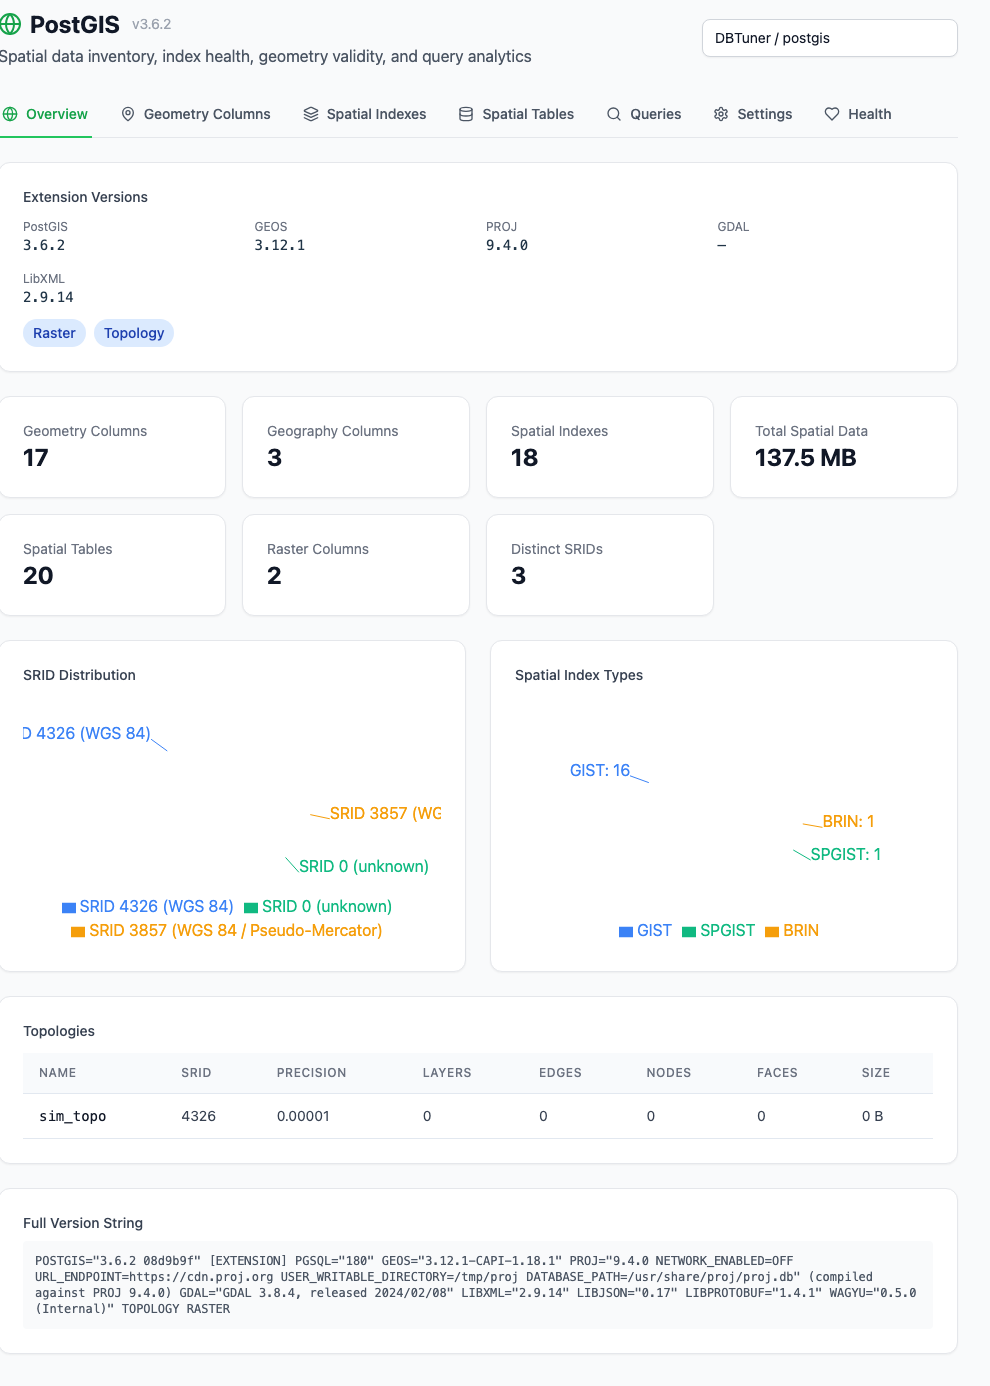
PostGIS
- Spatial data inventory — geometry columns, SRIDs & types
- Spatial index health & query performance tracking
- Geometry validity checks & 7 dedicated health checks
Works with your cloud
Provider-aware health checks and installation guides for 12 PostgreSQL platforms. No "edit postgresql.conf" advice on RDS.
See how we compare
We name names. Here's where MyDBA.dev goes further than the alternatives.
| Feature | MyDBA.dev | pganalyze | Datadog | pgwatch | PMM |
|---|---|---|---|---|---|
| Manual AI incident analysis & post-mortems | |||||
| Optional AI analysis grounded in real metrics | |||||
| Rate-of-change & compound alerts | |||||
| Collaborative playbooks with review | |||||
| Logical replication health (L0–L10) | |||||
| Automated health scoring (75+ checks) | |||||
| Priority-ranked action items with clear fixes | |||||
| Cluster-aware index analysis | |||||
| XID wraparound blocker detection & scripts | |||||
| Visual EXPLAIN plans with guided walkthrough | |||||
| TimescaleDB, pgvector & PostGIS monitoring | |||||
| Free tier (no credit card) |
Want hands-on help?
Our PostgreSQL experts can set up your monitoring, optimize slow queries, and audit your database — all backed by the data from MyDBA.dev.
Explore ConsultingStart with the Free plan
Start free with one primary or standalone PostgreSQL instance and all its databases. Monitoring, alerts, query insights, index advice, team access and every non-AI feature included. No replicas. No credit card required. Free uses full collection for the first seven days, then reduced sampling. Both plans keep 30 days of history; short-lived events can fall between samples. Add your own OpenRouter, OpenAI, or Anthropic key for AI analysis with no monthly limit; your provider bills the API usage.
Get Started Free