The most complete TimescaleDB monitoring anywhere
Hypertable health, chunk-level analysis, compression analytics, continuous aggregate tracking, background job monitoring, and dedicated health scoring.
Timescale Cloud shows you high-level metrics. We go deeper — individual chunks, compression effectiveness per hypertable, job histories, and automated health checks with fix scripts.
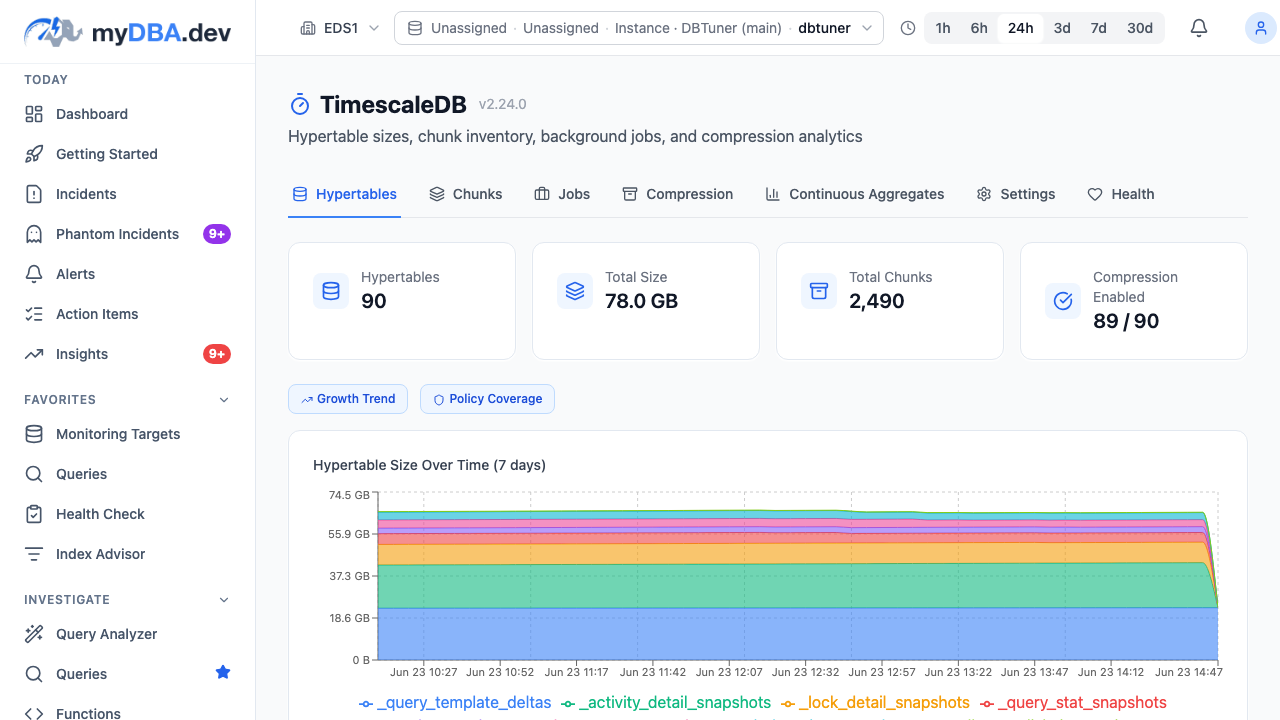
Hypertable monitoring
Size, chunk count, compression ratio, and row estimates for every hypertable. Track growth trends and compression effectiveness over time.
Chunk-level visibility
Individual chunk sizes, compression status, time ranges, and row counts. Spot bloated or uncompressed chunks before they cause problems.
Background job tracking
Status, duration, schedule, and success/failure history for every TimescaleDB background job — compression, retention, continuous aggregates.
Compression analytics
Per-hypertable compression ratios, before/after sizes, and compression policy effectiveness. Know exactly how much storage you are saving.
Continuous aggregate monitoring
Track refresh lag, materialization status, and data freshness for every continuous aggregate. Catch stale aggregates before they affect queries.
Settings audit
Review TimescaleDB-specific configuration settings and compare against best practices. Identify misconfigurations that impact compression or job performance.
TimescaleDB health scoring
Dedicated health check domain for TimescaleDB with findings, priority ranking, and fix scripts — the same depth you get for core PostgreSQL.
Related capabilities
Health Scoring
75+ automated checks across 12 scoring domains
Cluster-Aware Index Advisor
Index analysis across primaries and replicas
EXPLAIN Plan Advisor
Visual plan analysis, guided walkthroughs, and regression detection
XID Wraparound Protection
Blocker detection, recovery scripts, and runbooks
pgvector Monitoring
First-class pgvector index and query monitoring
PostGIS Monitoring
Spatial data inventory, index health, and geometry checks
Incident Analysis
Manual incident reports with evidence, root cause, timeline, and remediation
Phantom Incidents
Always-on anomaly detection for problems you haven't thought to alert on
Query Tuning
Highest-impact queries, the best tuning candidates, and exactly what to do
Optional AI Analysis
Manual AI depth for incidents, query plans, tuning, and explanations
Data Collection Options
Shared managed, dedicated managed, or self-hosted collectors
Smart Alerting
Rate-of-change, compound conditions, and 11 prebuilt templates
Logical Replication
Slot, subscription, apply lag, and PG17 conflict monitoring
Setup Assistant
Extension detection, auto-install, and provider-specific guides
Collaborative Playbooks
Shared remediation plans with review workflow
Trend Insights
Priority trend analyzers with severity cards and sparklines
See it in action
Start free with one primary or standalone PostgreSQL instance and all its databases. Monitoring, alerts, query insights, index advice, team access and every non-AI feature included. No replicas. No credit card required. New Free connections get seven days of full collection, then reduced sampling. Free and Pro include 30 days of monitoring history.