Everything an expert DBA needs, with guidance on what to do next
MyDBA collects deep PostgreSQL telemetry, constantly analyzes it with rules and heuristics, surfaces growing problems through health checks, phantom incidents, and insights, then helps you turn findings into safe action. Optional AI is always manual and available for extra explanation and depth.
Overview & Health
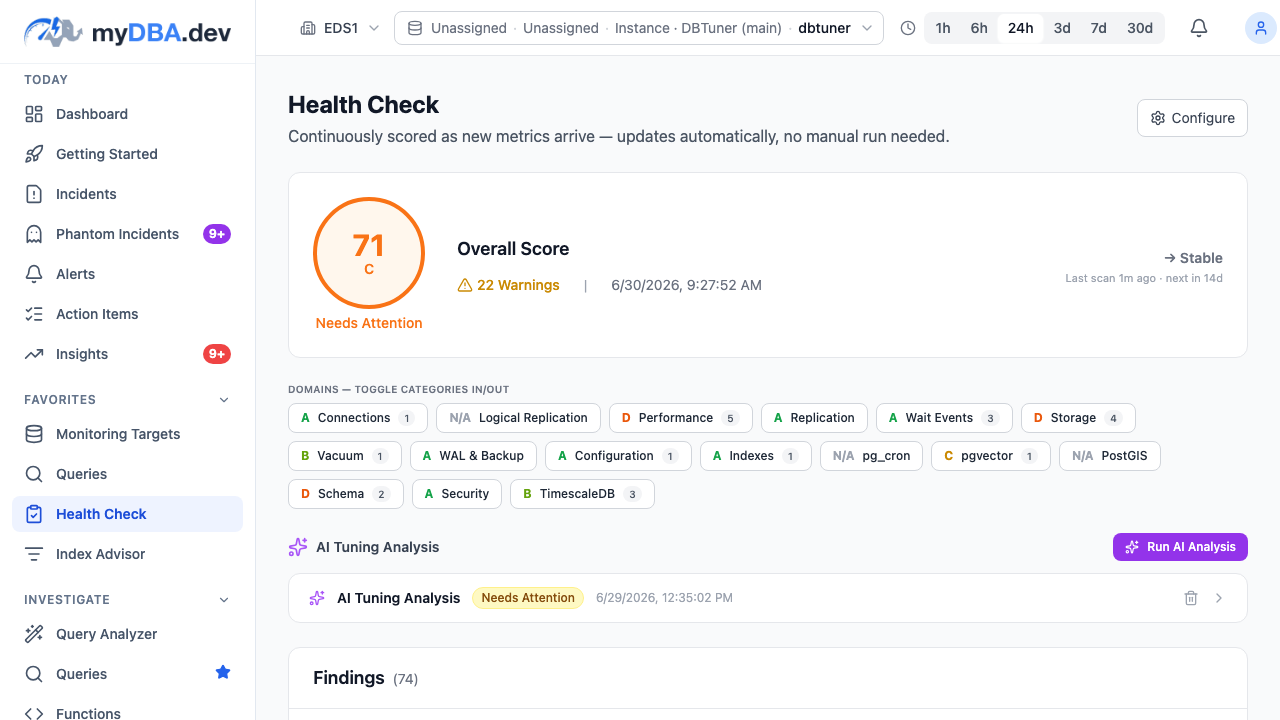
Automated health scoring, prioritized action items, and cluster-aware recommendations — across every database you monitor.
- Dashboard
Sampled overview of connections, queries, replication, and alerts at a glance.
- Health Check
Automated scoring across 10 domains with specific remedies and SQL to fix each issue.
- Action Items
Every check feeds into a single prioritized list — P1 critical to P4 low.
From constant checks to safe action
Health checks run continuously
Rules and PostgreSQL-specific heuristics check the database for configuration risks, maintenance debt, query regressions, bloat, locks, replication problems, and more.
Phantom incidents catch the drift
Background anomaly detection looks for growing issues and unusual behaviour before someone has named a real incident.
Action items keep the work moving
Findings feed into a maintained list of what needs attention, why it matters, and what action should be reviewed next.
Shared managed, dedicated managed, or self-hosted collectors
Shared managed collector
The fastest setup path: MyDBA runs the collector fleet and you connect your database from the dashboard.
Dedicated managed collector
A collector reserved for your connections, managed by us, with a dedicated IP address for database allowlists.
Self-hosted collector
Run the lightweight collector inside your own network when you need complete control over where database access originates.
Incident Analysis
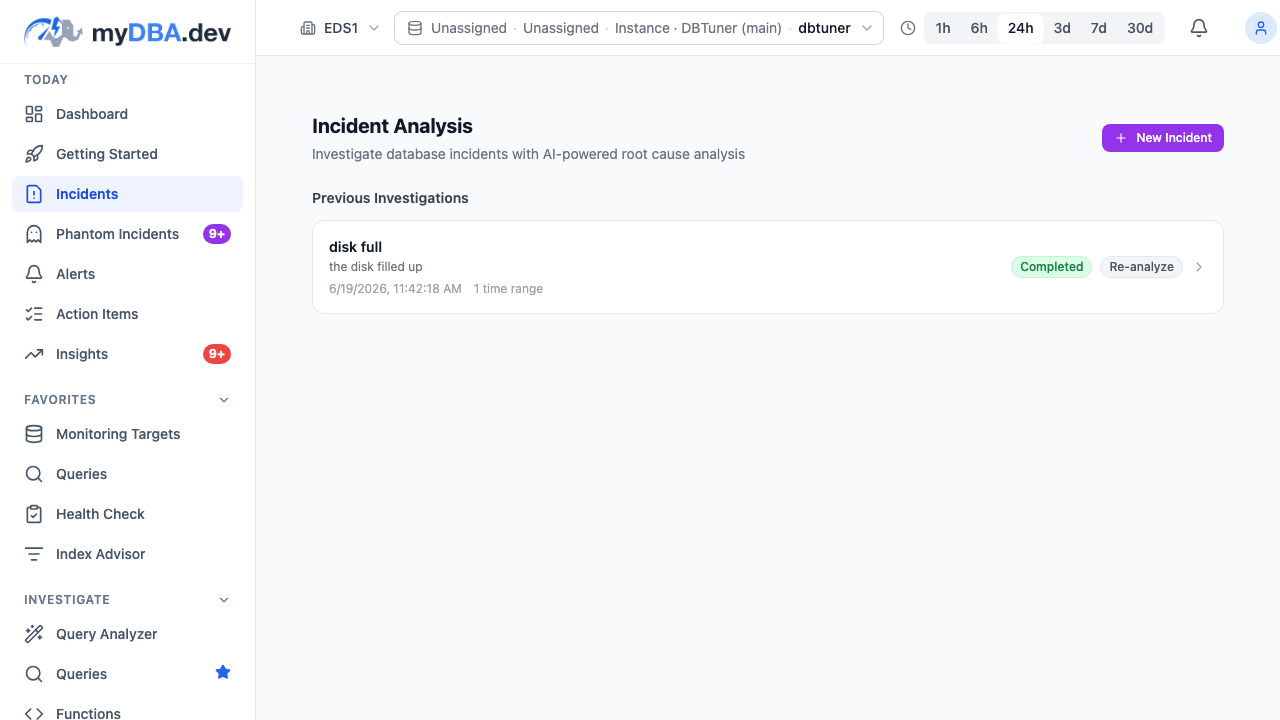
Turn "what happened last night?" into a complete incident report. MyDBA gathers before, during, and after evidence from your real database telemetry; optional manual AI can add root cause, timeline, impact assessment, and remediation depth.
- Multi-window evidence gathering
Error logs, locks, sessions, wait events, query stats, vacuum, and system metrics pulled per time window — not just a single snapshot.
- Optional AI root cause & timeline
AI is a manual action you choose when you want a deeper narrative on top of the collected evidence.
- Export, share & revisit
PDF/HTML export, evidence deep-links to the exact metric, and full history of every incident you have analysed.
Query Intelligence
Query Performance
Track execution time, calls, and row counts for every query. Identify slow queries and regressions with trend sparklines over time.
Query Resources
See which queries consume the most I/O, memory, and CPU via pg_stat_kcache. CPU vs I/O classification helps you target the right bottleneck.
Functions
Monitor PL/pgSQL function performance — call counts, average duration, and self-time for each function.
EXPLAIN Plan Advisor
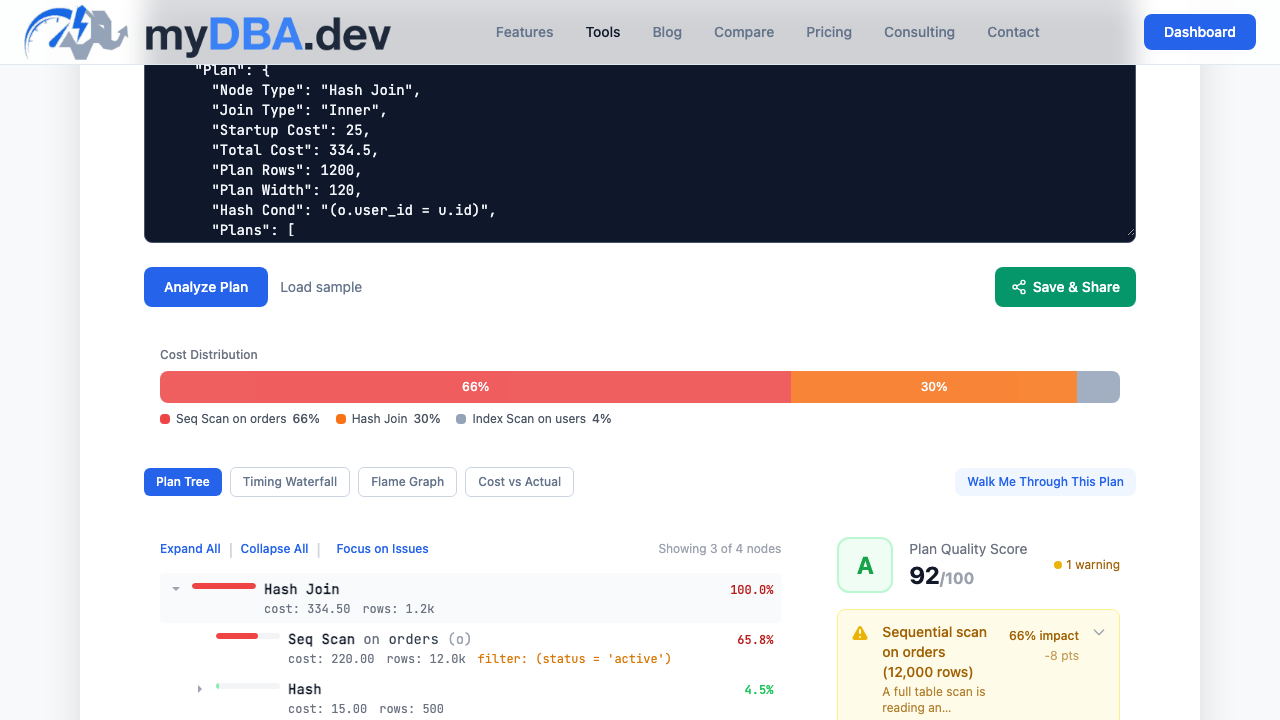
Visual plan analysis, guided walkthroughs, and plan regression detection — understand exactly why your queries perform the way they do.
- Visual Plan Analysis
5 visualization modes — tree, flame graph, waterfall, bottleneck bar, and cost vs actual — to see where time is spent.
- Guided Walkthrough
Step-by-step narration of each plan node, explaining what it does and why it matters in plain language.
- Plan Regression Detection
Automatic tracking of plan changes over time with alerts when a query switches to a slower execution strategy.
Optional AI Analysis & Tuning Advisor
Manual database-wide tuning analysis
When you choose to use AI, MyDBA can review configuration, workload, indexes, vacuum, waits, and plans to produce a ranked tuning analysis grounded in collected evidence.
Explain what the evidence means
Use AI for extra explanation of incident reports, query plans, tuning recommendations, and database-wide findings. The core monitoring and health analysis still runs without AI.
Bring your own key or go paid
Use your own OpenRouter, Anthropic or OpenAI key for unlimited product AI usage, with provider charges billed separately. New Pro subscriptions include 20 built-in AI operations per organization per UTC month. Org admins can toggle AI per organization.
Proactive Trend Insights
Priority trend analyzers
Hierarchical analyzers watch connection growth, query regression, lock contention, bloat accumulation, and cache hit drift — and surface the ones that matter most.
Severity cards with sparklines
Every insight includes a historical sparkline, severity level, affected objects, and a correlation hint linking the trend to its likely cause.
Environment-scoped filters
Scope insights to production, staging, or any environment tag. Focus only on the databases that matter right now.
Activity & Locks
Activity Monitor
See all active connections, their current queries, and collected state. Use sampled activity to investigate runaway queries and long-running transactions.
Lock Analysis
Visualize full blocking dependency graphs. See exactly which query is blocking which, trace to the root blocker, and take action.
Wait Events
Time-by-event heatmap to drill into I/O, lock, CPU, and internal waits. Click any wait type to see the queries contributing most to that bottleneck.
Schema & Optimization
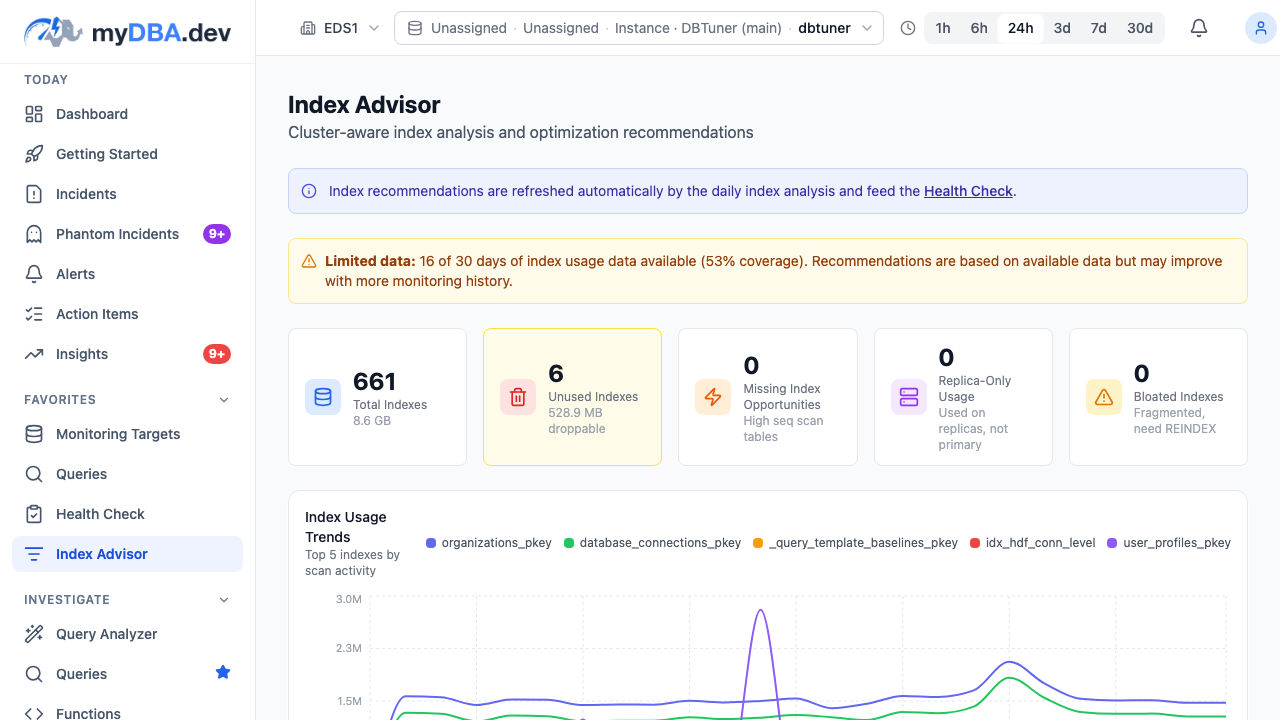
Cluster-aware index recommendations, schema diffing, and change tracking — so you optimize with confidence.
- Index Advisor
Identifies unused, missing, duplicate, and low-usage indexes with CREATE/DROP statements.
- Schema Diff
Compare schemas across connections and get auto-generated ALTER statements.
- Cluster-Aware Analysis
Recommendations consider all instances — an index critical on a replica won't be flagged.
Maintenance
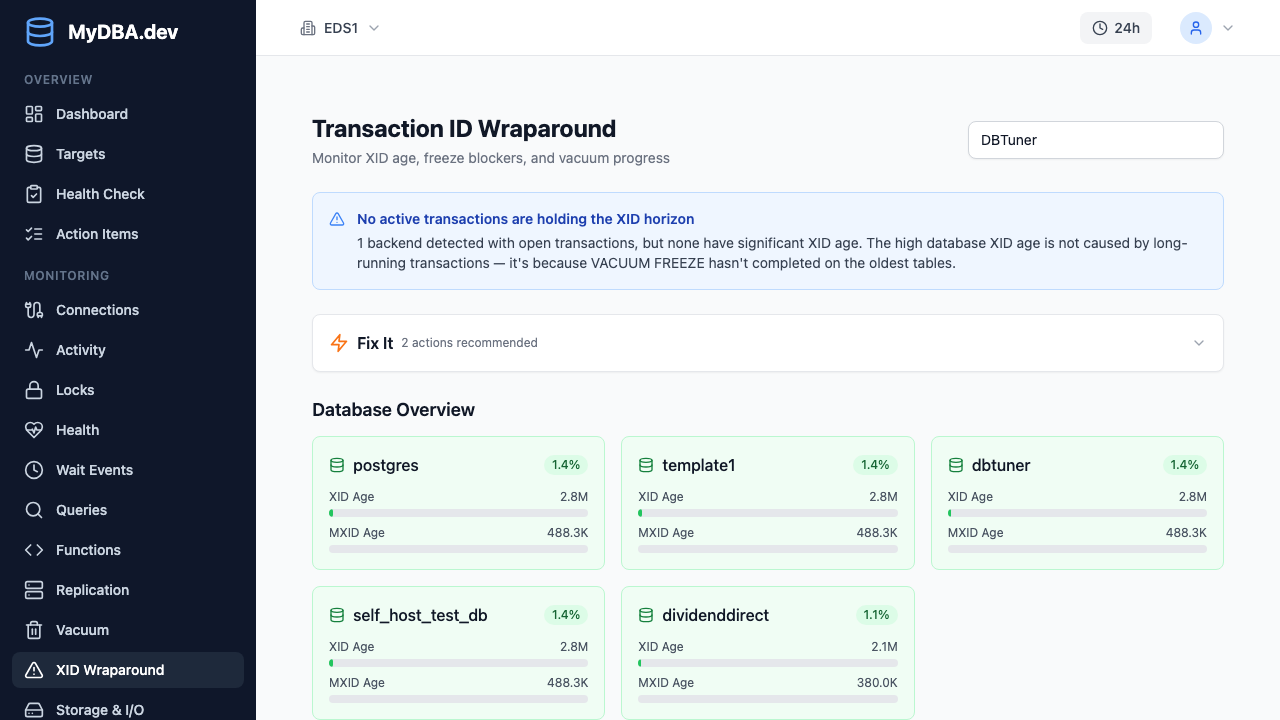
Stay on top of vacuum, WAL, checkpoints, and transaction ID wraparound before they become emergencies.
- Vacuum & Autovacuum
Worker timelines, dead tuple ratios, last vacuum times, and vacuum progress.
- XID Wraparound
Transaction ID age monitoring with blocker detection and auto-generated SQL fixes.
- WAL & Checkpoints
WAL generation rate, archive status, checkpoint frequency, and timing.
Infrastructure
Replication
Track replication lag, streaming state, slot usage, and WAL sender stats. Get alerts when replicas fall behind or slots become inactive.
Topology
Interactive diagram of your entire replication architecture — primaries, replicas, and cascading standbys in one view.
Storage & I/O
Monitor table sizes, disk usage trends, I/O throughput, and cache hit ratios. Plan capacity before you run out of space.
Logical Replication Monitoring
Slot & subscription health
Monitor every publication, subscription, and replication slot. Catch inactive slots, lost slots, disabled subscriptions, and stuck table sync before data drifts.
Apply lag & WAL retention
Track apply lag per subscription and WAL retained per slot. Get alerted before a stuck slot eats your disk or a replica falls catastrophically behind.
Conflict detection (PG17+)
10 dedicated health checks (L0–L10) covering slot state, WAL retention, apply lag, table sync, subscription status, and PG17 replication conflicts.
Smart Alerting
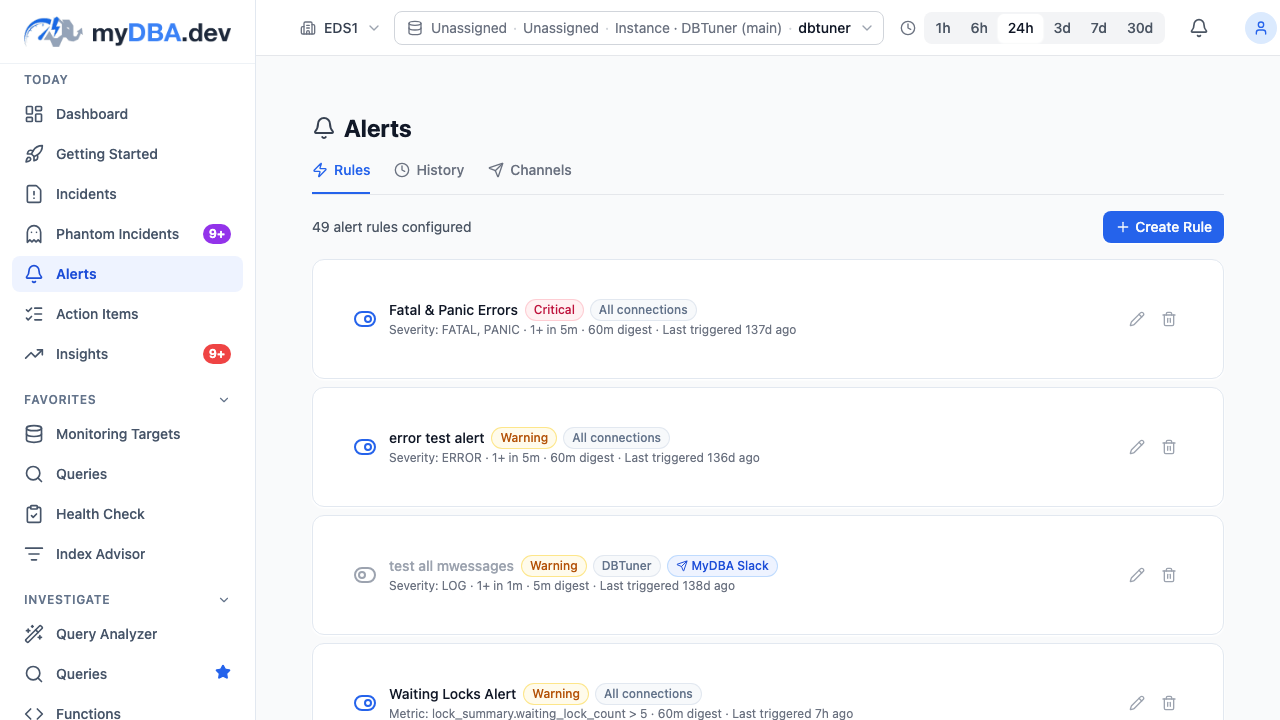
Not just thresholds. Rate-of-change detection, compound conditions, 11 prebuilt templates, and inline sparklines so you see context — not just a ping.
- 30+ metrics, 11 prebuilt templates
High connections, idle-in-transaction, cache hit ratio, query latency, replication lag, XID risk, bloat, dead tuples — ready to enable in one click.
- Rate-of-change alerts
Fire when a metric moves rapidly, not just when it crosses a line. "+20% DB size in 60 min" or "+50% connections in 5 min" catches incidents thresholds miss.
- Compound conditions
Combine multiple metrics with AND logic — e.g. "high connection count AND low cache hit ratio" — to reduce noise and catch real regressions.
- Sparklines in every event
Each alert event ships with a trend sparkline and the threshold overlaid, so you see exactly how the metric behaved without opening a dashboard.
- Log scanning & search
Continuous log collection with search and filtering by severity, user, and database — correlated with your metric alerts.
Collaborative Playbooks
Shared remediation plans
Create reusable plans and playbooks for common incidents. Send EXPLAIN findings, schema diffs, or index recommendations straight into a plan for action.
Plan review workflow
Formal review before execution — teammates approve or comment on SQL before anything touches production. Reduces "who approved this?" postmortems.
In-app notification inbox
Review requests, plan status updates, and alert events all live in one inbox — so work never slips through cracks.
Setup Assistant
Extension detection
Scans your database for pg_stat_statements, auto_explain, pgstattuple, pg_buffercache, pg_visibility, pg_cron, pgvector, PostGIS, and TimescaleDB — flags what is missing.
Provider-aware install
One-click install for safe extensions where your role allows it. For managed providers (RDS, Aurora, Neon, Supabase, Cloud SQL, Azure) you get the exact parameter-group or console steps.
Auto-detect your cloud
Recognises RDS, Aurora, Neon, Supabase, Cloud SQL, Azure, Aiven, Render, and Railway automatically, then tailors every check and recommendation to that provider.
Provider-Aware Monitoring
12 cloud providers, first-class
RDS, Aurora, Google Cloud SQL, Azure Database, Neon, Supabase, DigitalOcean, Aiven, Timescale Cloud, Crunchy Bridge, Heroku Postgres, and self-managed.
Provider-specific recommendations
Health checks know what you can and cannot change on each platform. No "set this GUC" advice on RDS when it needs a parameter group change.
CloudWatch system metrics
For RDS and Aurora, pull CPU, memory, disk/network I/O, storage, and burst balance directly from CloudWatch — no OS access required.
TimescaleDB Monitoring
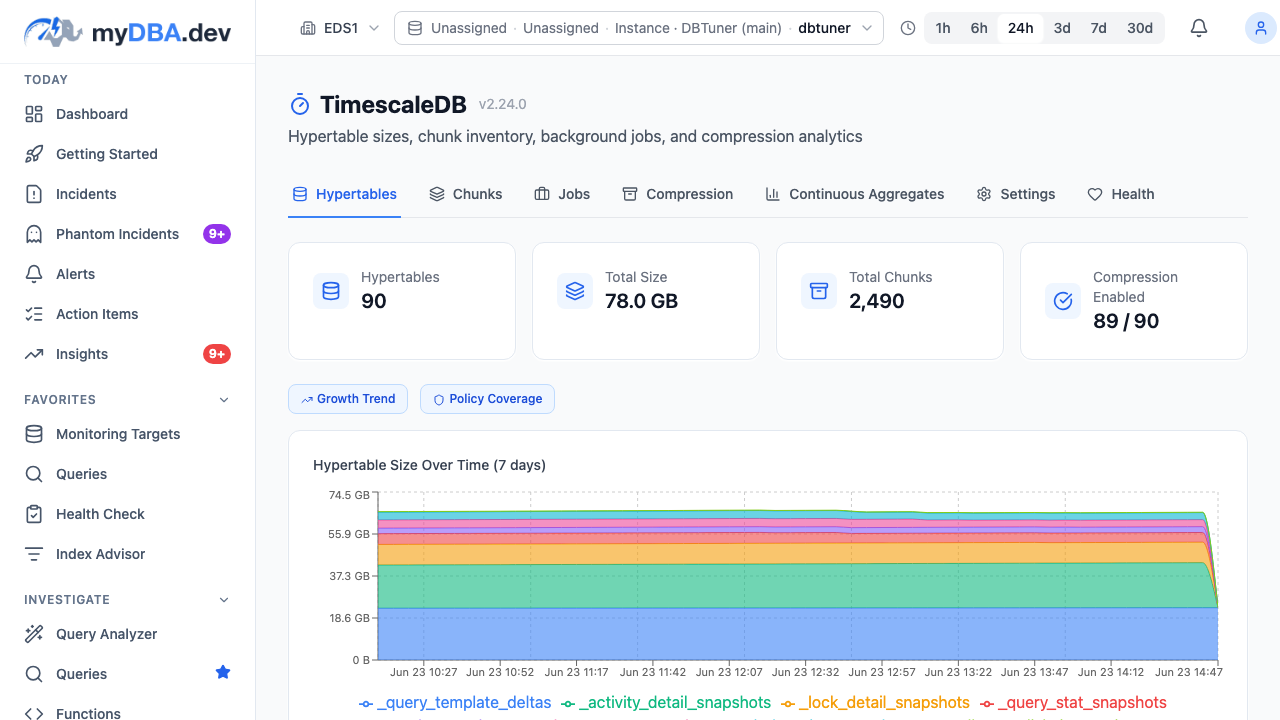
Industry-leading TimescaleDB monitoring — more complete than Timescale Cloud or TigerData themselves.
- Hypertable Monitoring
Size, chunk count, compression ratio, and row estimates for every hypertable.
- Chunk-Level Visibility
Individual chunk sizes, compression status, and time ranges at a glance.
- Background Jobs & Compression
Status, duration, and schedule of every background job with per-hypertable compression ratios.
pgvector Monitoring
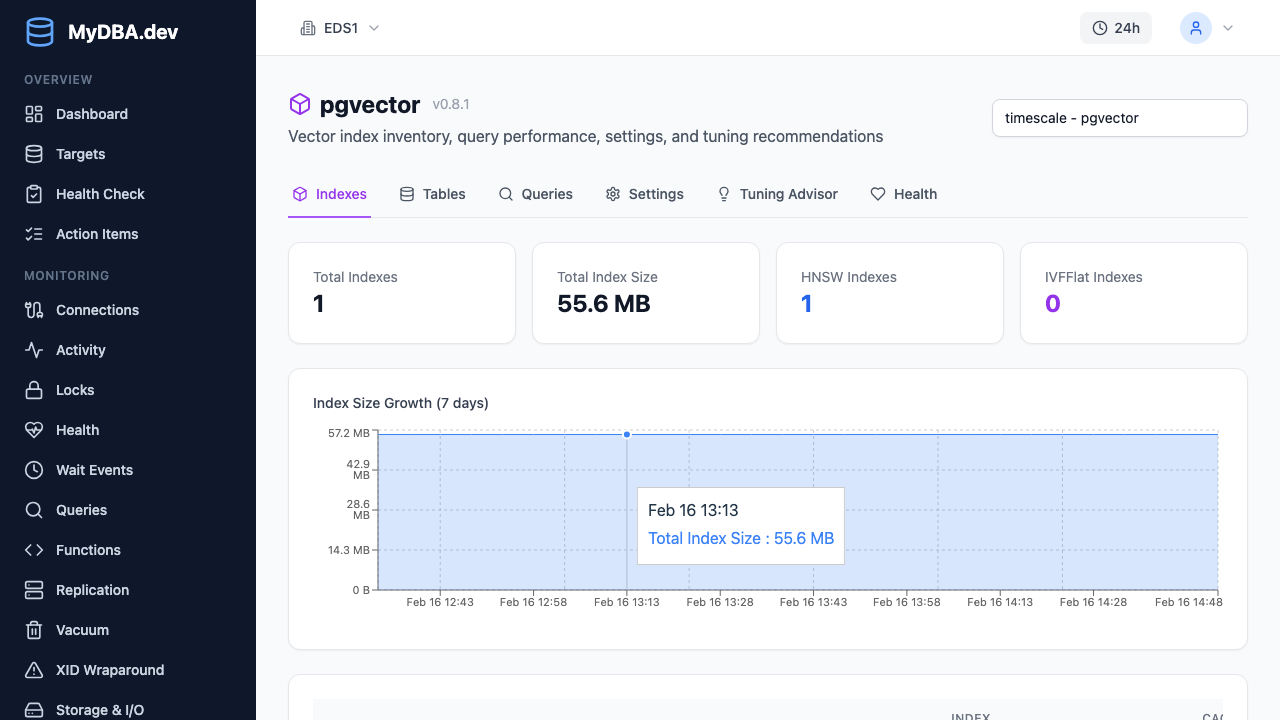
The first and only PostgreSQL monitor with dedicated pgvector support — index inventory, query analysis, and tuning.
- Index Inventory
Every pgvector index — type (IVFFlat, HNSW), dimensions, size, and build parameters.
- Query & Table Analysis
Vector similarity search performance, column coverage, and storage impact analysis.
- Tuning & Settings
Configuration audit for ivfflat.probes, hnsw.ef_search, and tuning recommendations.
PostGIS Monitoring
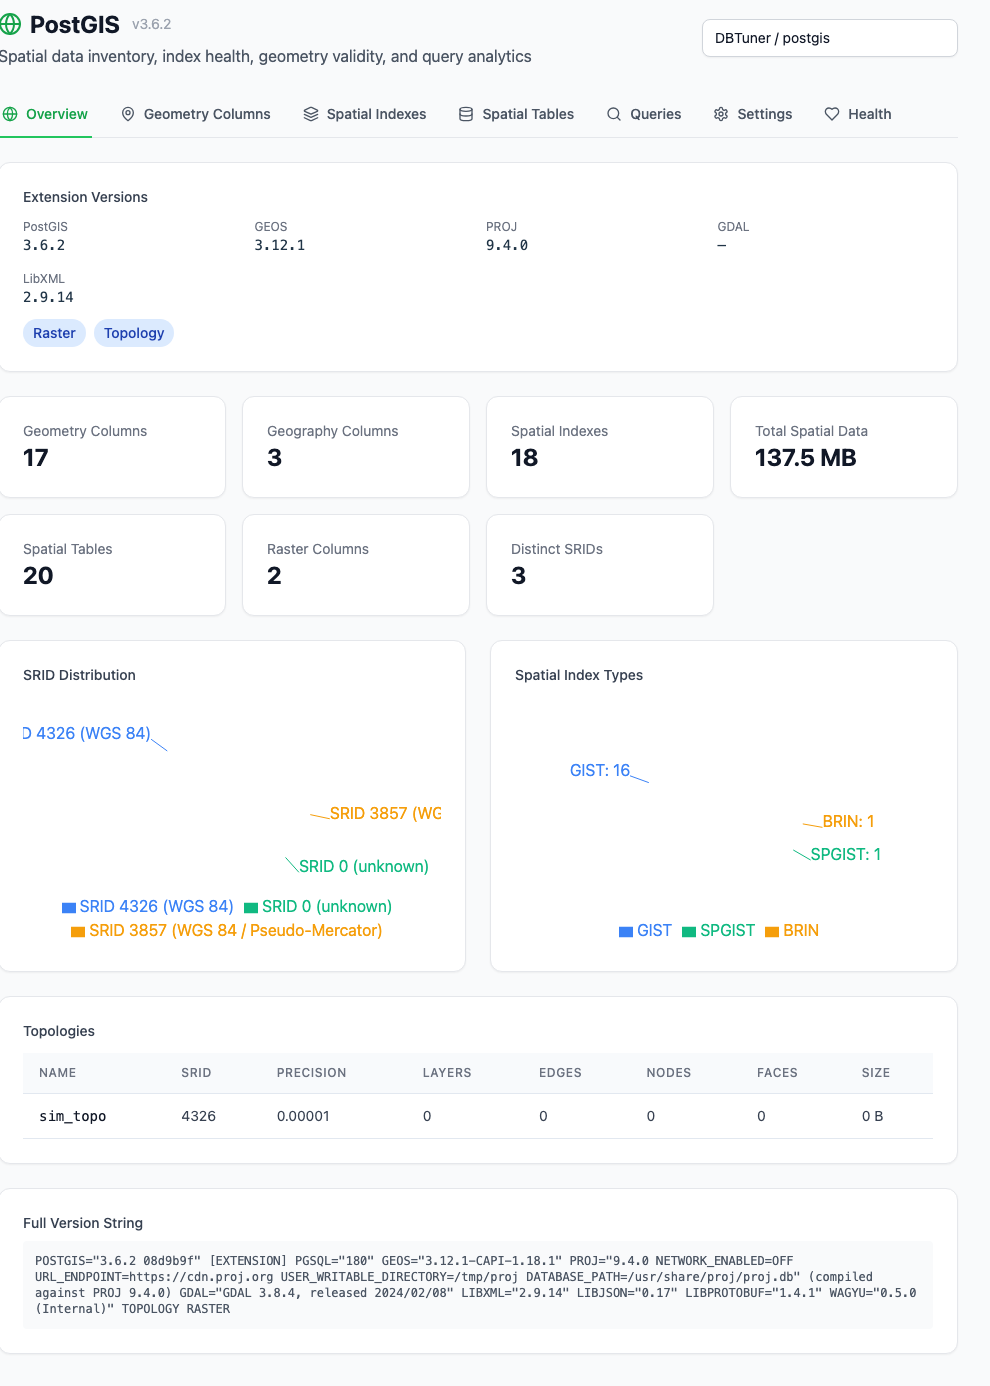
Dedicated PostGIS monitoring — spatial data inventory, geometry health, index analysis, and spatial query performance tracking.
- Spatial Data Inventory
Geometry columns, SRIDs, coordinate types, and storage sizes across all your spatial tables.
- Spatial Index Health
GiST and SP-GiST index inventory with size tracking, build progress, and usage analysis.
- Geometry Validity Checks
7 dedicated health checks covering invalid geometries, missing indexes, SRID mismatches, and more.
Collect data your way
Choose the deployment model that fits your infrastructure. Shared managed, dedicated managed, and self-hosted collectors provide the same monitoring experience with different control and security tradeoffs.
Shared managed collector
Connect your database directly from the dashboard. We run the shared collector fleet for you — no binaries to install, no infrastructure to manage. Ideal for cloud-hosted databases with public or VPN-accessible endpoints.
Dedicated managed collector
Optional at £50 per machine per month. Use a collector reserved for your connections, managed by us, with a dedicated egress IP address. This does not increase your plan’s instance allowance.
Self-hosted collector
Deploy a single Go binary inside your own network. Connections are managed from the dashboard and fetched automatically — no config files to maintain. Monitoring telemetry is sent to MyDBA over HTTPS.
Start monitoring your PostgreSQL databases
Start free with one primary or standalone PostgreSQL instance and all its databases. Monitoring, alerts, query insights, index advice, team access and every non-AI feature included. No replicas. No credit card required. New Free connections get seven days of full collection, then reduced sampling. Free and Pro include 30 days of monitoring history.