Diagnosing and Resolving Lock Contention in PostgreSQL
Diagnosing and Resolving Lock Contention in PostgreSQL
The Problem
Every row-level operation in PostgreSQL acquires a lock. An UPDATE takes a RowExclusiveLock on the table and an exclusive tuple-level lock on each modified row. A SELECT FOR UPDATE does the same. These locks are invisible when transactions are fast — acquired, held for milliseconds, released. The trouble starts when transactions hold locks for longer than they should.
A common scenario: your e-commerce checkout endpoint runs an UPDATE on the inventory table to decrement stock. Normally each transaction takes 5ms. Then a reporting query starts a long-running transaction that reads the same rows, holding a snapshot that prevents cleanup but — more immediately — a developer's migration script runs an ALTER TABLE that queues an AccessExclusiveLock. That queued lock blocks every subsequent query on the table, even simple SELECTs. Within seconds you have a pile-up: dozens of transactions waiting for a lock that's waiting for a lock that's waiting for a long-running transaction to finish.
The worst part is that lock contention is invisible until it cascades. The first blocked query waits quietly. The second one joins the queue. By the time your application starts timing out, the queue may be 50 transactions deep and the only fix is to terminate the blocking session.
Deadlocks are the extreme case — two transactions each waiting for a lock the other holds. PostgreSQL detects these automatically and kills one transaction, but the error means your application logic allowed an inconsistent lock ordering.
How to Detect It
The core query joins pg_stat_activity with pg_locks to show which sessions are blocked and what's blocking them:
-- Find blocked queries and what's blocking them
SELECT
    blocked.pid AS blocked_pid,
    blocked.query AS blocked_query,
    blocked.wait_event_type,
    blocked.wait_event,
    blocking.pid AS blocking_pid,
    blocking.query AS blocking_query,
    now() - blocked.query_start AS blocked_duration
FROM pg_stat_activity AS blocked
JOIN pg_locks AS blocked_locks
    ON blocked.pid = blocked_locks.pid
JOIN pg_locks AS blocking_locks
    ON blocked_locks.locktype = blocking_locks.locktype
    AND blocked_locks.relation = blocking_locks.relation
    AND blocked_locks.pid != blocking_locks.pid
    AND blocking_locks.granted
    AND NOT blocked_locks.granted
JOIN pg_stat_activity AS blocking
    ON blocking_locks.pid = blocking.pid
ORDER BY blocked_duration DESC;
What to look for: blocked_duration over a few seconds indicates a real problem. Check the blocking_query — if it's idle in transaction, the application opened a transaction and never committed. If the blocker is a DDL statement (ALTER TABLE, CREATE INDEX), it's holding an AccessExclusiveLock that blocks everything.
For deadlocks, check the PostgreSQL logs — each deadlock writes a detailed entry showing the two transactions and the lock cycle. You can also query pg_stat_database for the deadlocks counter.
The limitation of manual detection: by the time you run this query, the damage is done. Lock pile-ups escalate in seconds, and you need continuous monitoring to catch them before they cascade.
How myDBA.dev Shows It
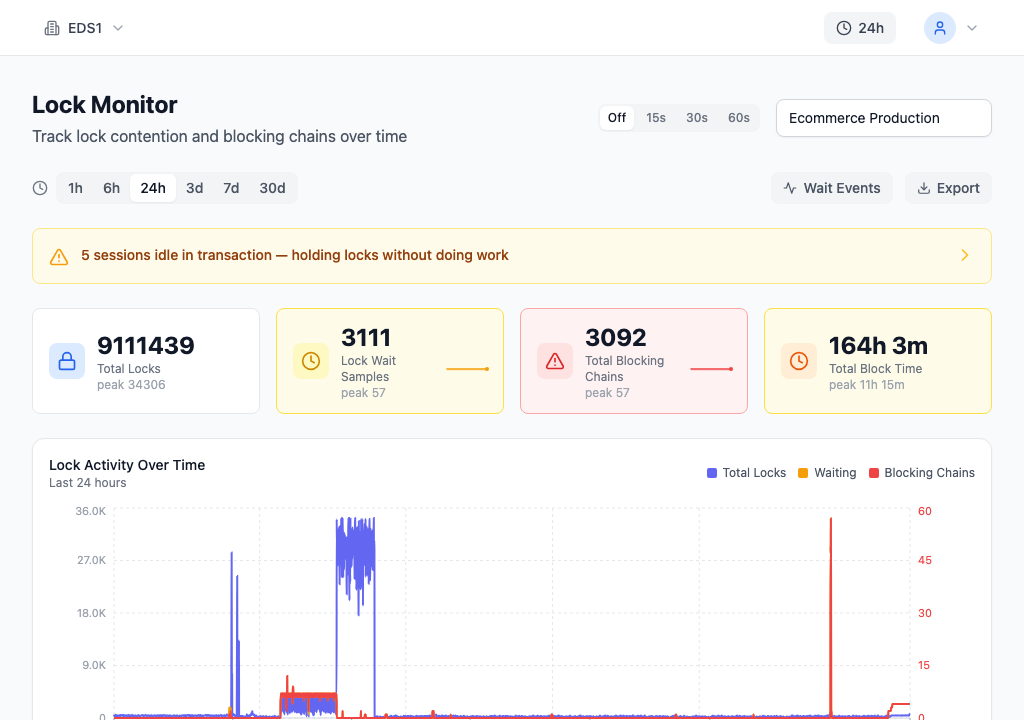
myDBA.dev's Locks page displays the full lock chain as a tree: blocking sessions at the top, blocked sessions nested below. You can see at a glance which PID is the root blocker, how many sessions are queued behind it, and how long each has been waiting. The wait events breakdown shows whether contention is on row-level locks (Lock:tuple), relation locks (Lock:relation), or transactionid locks (Lock:transactionid).
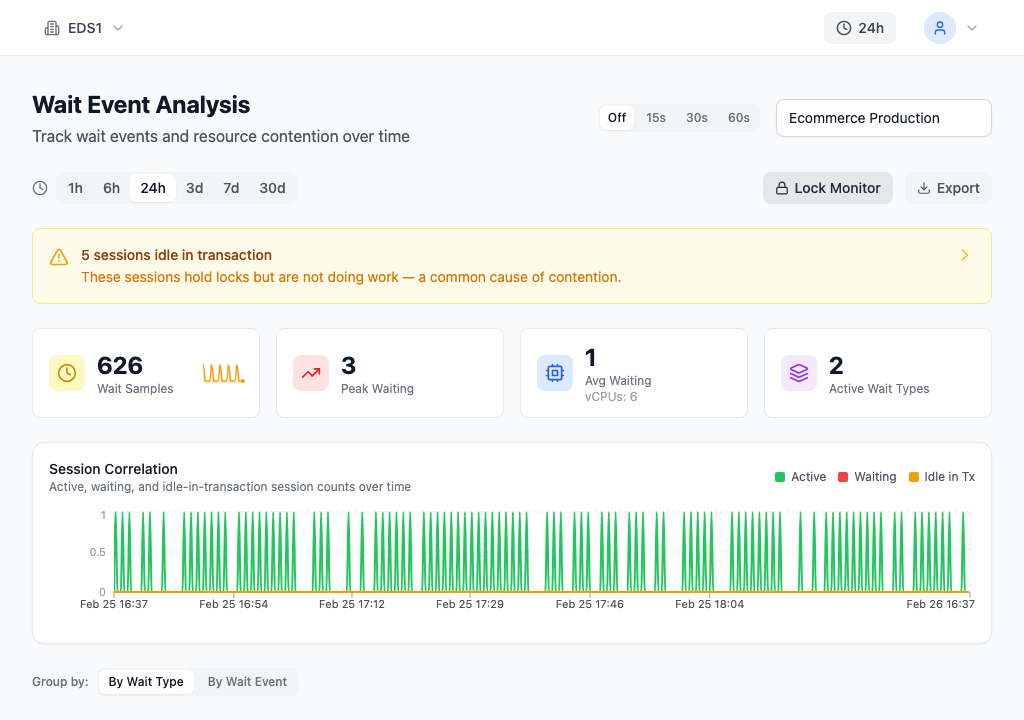
The Wait Events page gives a time-series view of lock waits over the past hour, so you can see whether contention is a one-off spike or a recurring pattern. Sustained Lock wait events during peak traffic indicate a design problem, not just a slow query.
How to Fix It
When you find a blocking session, you have two options:
-- Option 1: Cancel the blocking query (gentle — lets the transaction roll back)
SELECT pg_cancel_backend(12345);

-- Option 2: Terminate the blocking session (forceful — closes the connection)
SELECT pg_terminate_backend(12345);

-- Verify locks are cleared
SELECT count(*) FROM pg_locks WHERE NOT granted;
Use pg_cancel_backend first — it sends a cancel signal that the query can handle gracefully. If the session is idle in transaction (the query already finished but the transaction wasn't committed), pg_cancel_backend won't help and you'll need pg_terminate_backend.
For the longer-term fix, set timeouts to prevent lock pile-ups:
-- Fail fast instead of waiting indefinitely for a lock
ALTER DATABASE mydb SET lock_timeout = '5s';

-- Kill transactions that sit idle too long
ALTER DATABASE mydb SET idle_in_transaction_session_timeout = '30s';

-- Cap query execution time
ALTER DATABASE mydb SET statement_timeout = '30s';
lock_timeout is the most important: it makes queries fail immediately when they can't acquire a lock within 5 seconds, instead of piling up in a queue. The application gets an error it can retry, rather than hanging indefinitely.
How to Prevent It
The best prevention strategies target the root causes:
Keep transactions short. The longer a transaction holds locks, the higher the chance of contention. Move any non-database work (API calls, file processing) outside the transaction boundary. Use idle_in_transaction_session_timeout to catch forgotten transactions.
Use NOWAIT for explicit locking. When your application uses SELECT FOR UPDATE, add NOWAIT to fail immediately if the row is already locked:
SELECT * FROM inventory WHERE product_id = 123 FOR UPDATE NOWAIT;Run DDL with care. ALTER TABLE acquires AccessExclusiveLock. Use lock_timeout in your migration scripts so a DDL that can't get its lock immediately fails rather than blocking all queries. For index creation, always use CREATE INDEX CONCURRENTLY.
Fix inconsistent lock ordering. Deadlocks happen when transaction A locks row 1 then row 2, while transaction B locks row 2 then row 1. Ensure all code paths that touch the same rows do so in the same order.
Continuous monitoring with tools like myDBA.dev lets you spot recurring lock patterns and correlate them with deployments or traffic changes — turning lock contention from a firefighting exercise into a preventable condition.