Postgres Is Down: A 15-Minute Triage Runbook
Postgres Is Down: A 15-Minute Triage Runbook
If Postgres is down, don't restart it yet. Capture the log, check disk space, then work through five causes in order — disk, connections, OOM, WAL/archiving, and log/corruption — because that order runs from cheapest and most common to most destructive. This is the long-form reference for that triage tree: exact commands, expected output, and the handful of moves that turn a recoverable outage into permanent data loss. There's also a four-minute video version for when you're actually being paged. Bookmark this one for later, and paste the condensed block at the bottom into your on-call doc.
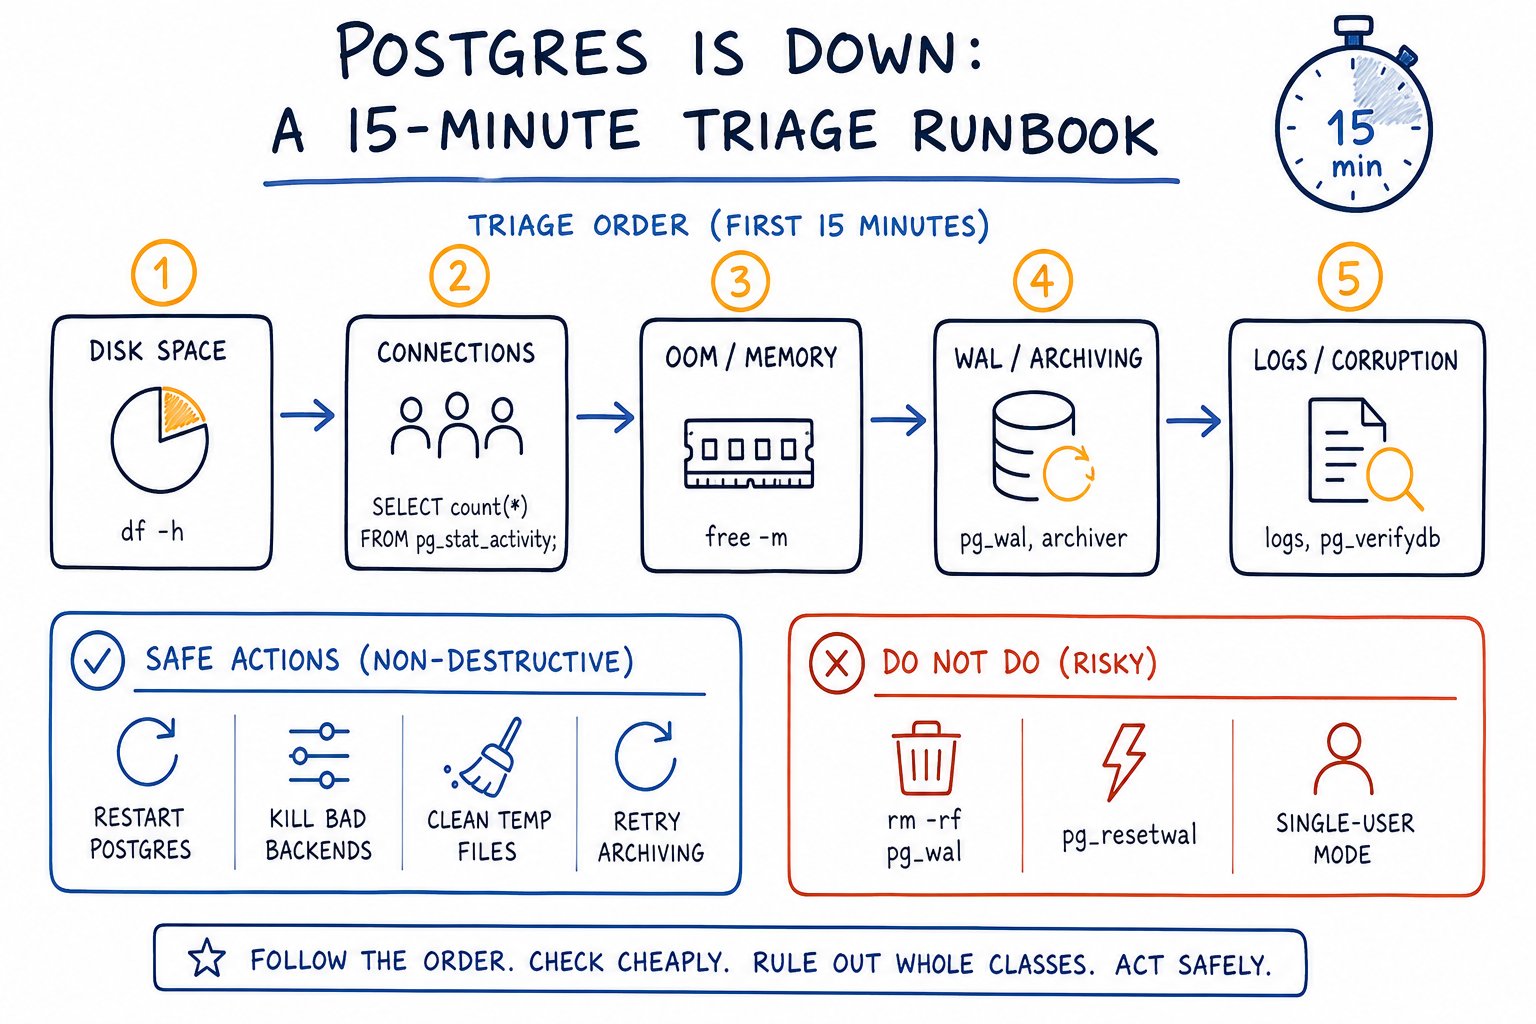
Postgres doesn't go down for a thousand different reasons. In practice it's one of five: disk, connections, OOM, WAL and archiving, or something the log will tell you outright. Work them out of order — or skip straight to a restart — and you'll either waste your only chance to see the fatal log line or turn a recoverable outage into a data-loss incident.
The first two minutes: stabilise before you diagnose
Do not restart yet. Do not delete anything yet.
A restart is the most common instinct, and it's also the fastest way to destroy the evidence you need. The fatal log line that explains the outage is often the last thing written before the postmaster died, and a restart buries it under a hundred lines of recovery output. Worse, if the cause is a full disk, restarting produces a crash loop that generates more log volume on the same full filesystem.
Capture three things, in this order, before you touch anything:
# 1. The last 200 lines of the server log
sudo tail -n 200 /var/log/postgresql/postgresql-16-main.log
# or, on systemd-managed installs:
sudo journalctl -u postgresql --since '-1 hour' --no-pager

# 2. Disk, on the data directory, not on /
df -h "$PGDATA"

# 3. Is the postmaster alive at all?
ps -ef | grep -i [p]ostmaster
Copy that output into the incident channel. It costs you fifteen seconds and it's the difference between a root cause and a shrug.
Is Postgres actually down, or just unreachable?
People conflate three different failures under "Postgres is down," and only one of them is a database problem:
- The postmaster process is dead.
- The postmaster is alive but refusing new connections.
- The postmaster is fine, but a pooler, firewall, security group, or DNS entry between the app and the database is broken.
Check which one you're in:
sudo systemctl status postgresql@16-main
sudo -u postgres /usr/lib/postgresql/16/bin/pg_ctl -D "$PGDATA" status
ps -ef | grep [p]ostgres | head
sudo ss -ltnp | grep 5432

# Unix socket, bypasses TCP, firewall, DNS and the pooler entirely
sudo -u postgres psql -c 'select now(), pg_is_in_recovery();'

# TCP, exercises listen_addresses, pg_hba and the network path
psql "host=127.0.0.1 port=5432 dbname=postgres user=postgres" -c 'select 1;'
If the socket connection works and the TCP one doesn't, your problem is listen_addresses, pg_hba.conf, or a firewall. If both work locally and the application still can't connect, the database is fine and you're debugging PgBouncer, a load balancer, a security group, or DNS. Stop working the tree below — it doesn't apply, and you'll waste ten minutes proving the database is healthy while the actual fault sits in a proxy.
If ss -ltnp shows nothing on 5432 and no postmaster process exists, the cluster is genuinely down. Continue.
The postgres down runbook at a glance
| # | Check | One command | Confirming signal | Immediate action | |---|-------|-------------|-------------------|------------------| | 1 | Disk | df -h $PGDATA and df -i $PGDATA | 100% used, or 100% inodes; PANIC: could not write to file in the log | Free non-Postgres space first; if WAL is the cause, go to the archive_command escape hatch | | 2 | Connections | psql -c "select count() from pg_stat_activity" as superuser | FATAL: sorry, too many clients already | Connect on a reserved superuser slot, terminate idle-in-transaction backends | | 3 | OOM | dmesg -T \| grep -i oom | Out of memory: Killed process ... postgres | Identify postmaster vs backend kill; cut work_mem or shared_buffers before restart | | 4 | WAL / archiver | select from pg_stat_archiver; | Rising failed_count, recent last_failed_time | Fix credentials, quota or network; verify with pg_switch_wal() | | 5 | Logs / corruption | tail -n 200 on the server log | invalid page in block, could not access status of transaction | Stop. Take a block-level copy. Escalate. Do not reset anything |
Checks 1 through 4 explain the overwhelming majority of unplanned outages I've been paged for. Each is non-destructive and rules out a whole class of failure in under a minute. Check 5 is where you slow down, not speed up.
Check 1 — Postgres disk full and pg_wal growth
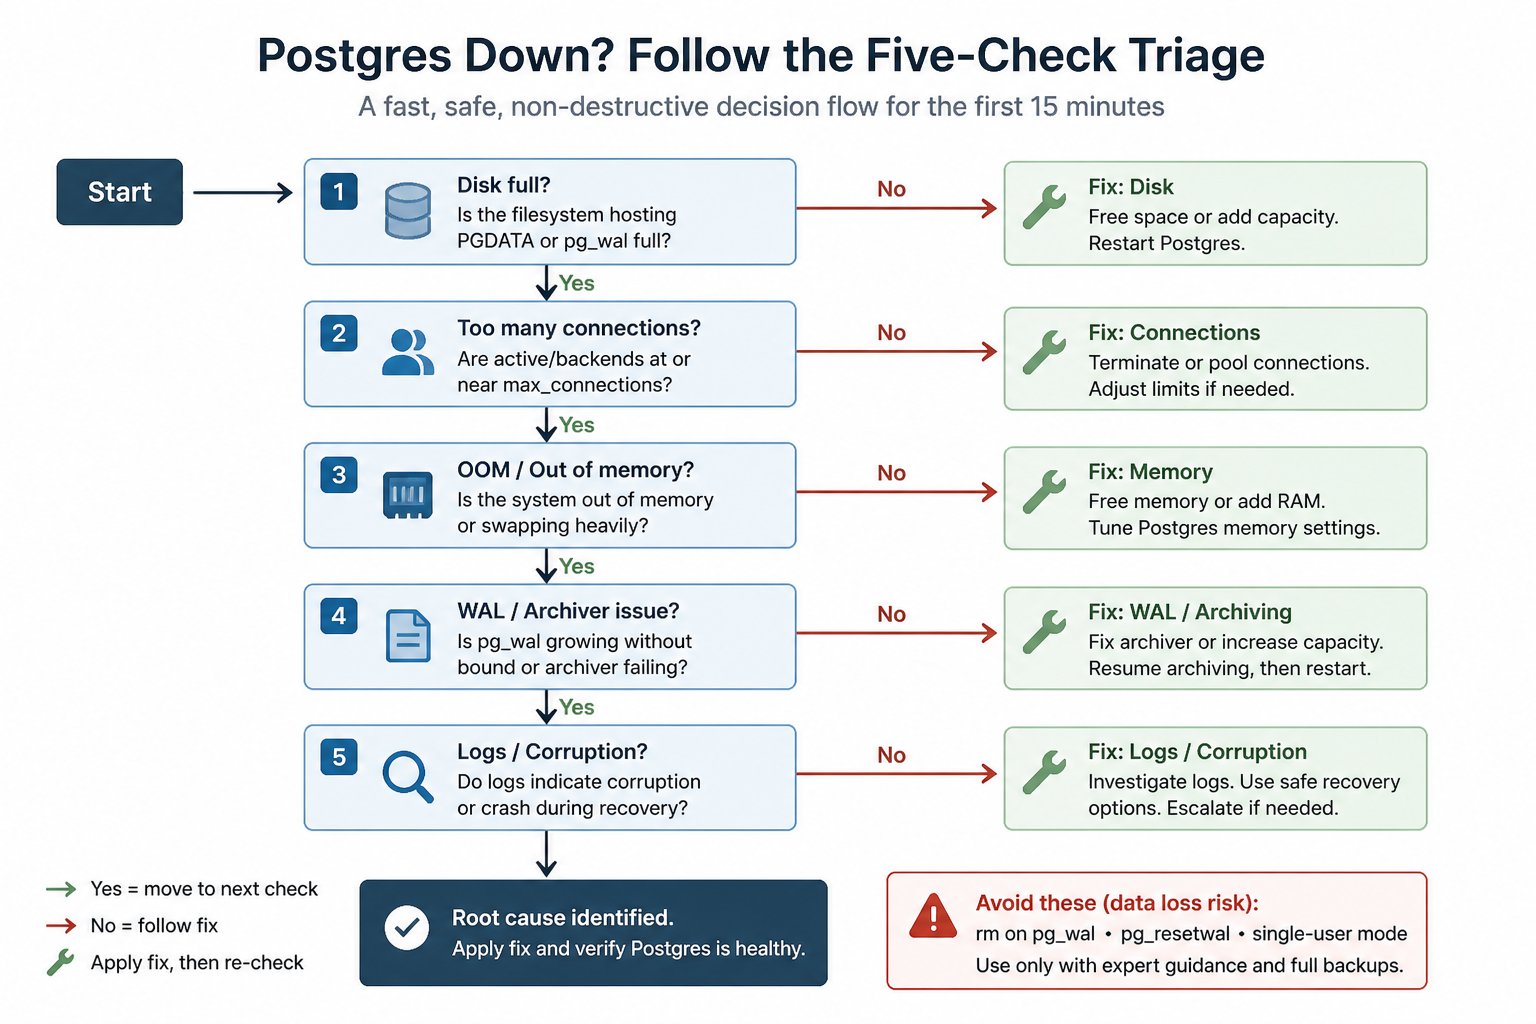
The single most common way to miss a disk-full outage is running df -h with no arguments, seeing / at 62%, and moving on. df reports per-mount usage. If $PGDATA lives on /var/lib/postgresql and that's a separate volume, the root filesystem tells you nothing.
df -h "$PGDATA"
df -i "$PGDATA"                       # inodes, a separate way to hit ENOSPC
df -h "$PGDATA/pg_wal"                # may be a different mount, or a symlink
du -sh "$PGDATA/pg_wal"
ls "$PGDATA/pg_wal" | wc -l
sudo du -sh --max-depth=1 "$PGDATA" | sort -rh | head -10
Two things trip people up here. First, ext4 reserves 5% of blocks for root by default, so a filesystem that reports 100% to the postgres user may still have space that a root-owned process can write into. That's why your logging daemon keeps writing while Postgres panics. Second, a filesystem can return ENOSPC with plenty of free bytes if it's run out of inodes. df -i is the check that separates the two, and it takes one second.
The failure signature is unmistakable in the log: PANIC: could not write to file "pg_wal/xlogtemp.NNNN": No space left on device, followed by the postmaster shutting down. Restart it and it attempts recovery, needs to write WAL, panics again — that's why Postgres won't start after a disk-full event. The disk is full — the cluster itself isn't corrupted, and it'll start fine the moment space is freed.
Recovery order, and stick to it:
1. Free non-Postgres space first. Rotated logs, old core dumps, stale backup staging directories, package caches. 2. Never rm files from pg_wal. More on that below, twice, because it matters. 3. If the space is being consumed by pg_wal itself, the cause is almost always a failing archiver or a stuck replication slot. Go to the next section.
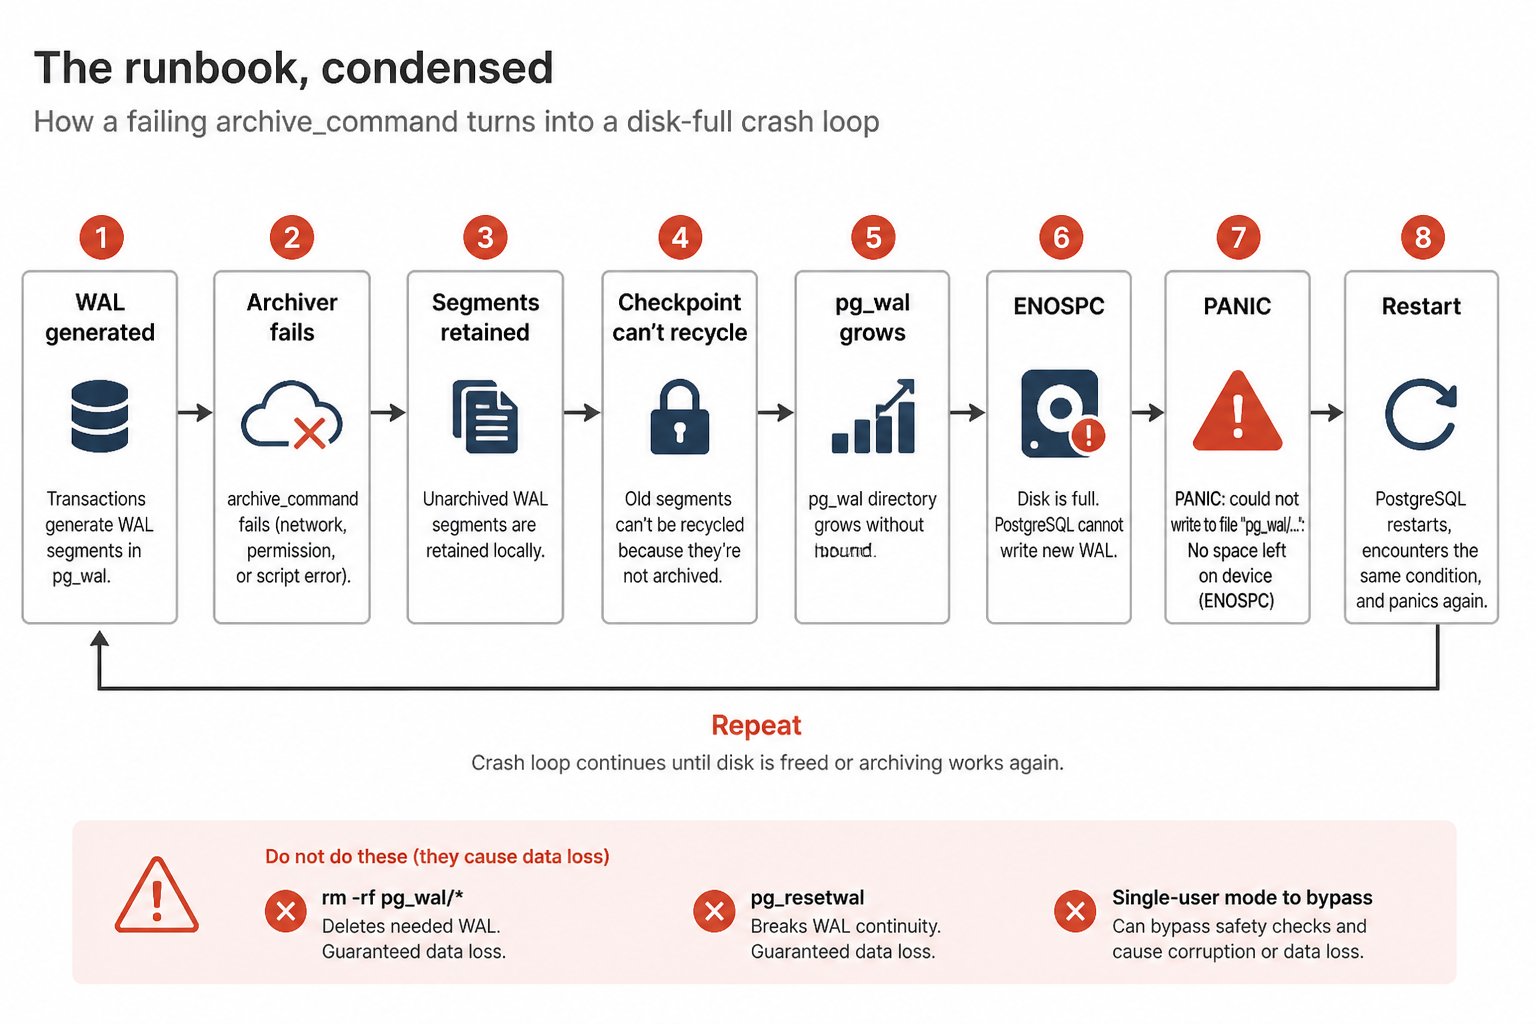
On 7 July we lost a production cluster exactly this way. WAL archiving through pgBackRest stalled because the S3-compatible object store had quietly exceeded its 250GB quota and started returning HTTP 403 QuotaExceeded on every upload. Postgres did exactly what it's supposed to do when archive_command fails: it kept every WAL segment in pg_wal and retried indefinitely, because segments aren't recycled until archiving succeeds. pg_wal grew to 318GB, the volume hit 100%, and the cluster went into a crash loop. From the outside it looked like a disk problem. The actual cause was three layers upstream, in the object store's billing plan.
| Setting | What it does | Under-pressure note | |---|---|---| | max_wal_size | Soft cap that triggers checkpoints | Can be exceeded under heavy write load, stalled checkpoints, or retained segments; not a hard limit |
The archive_command escape hatch, and its price
If archive_command exits nonzero, Postgres keeps that WAL segment in pg_wal and retries indefinitely. Segments aren't recycled or removed until archiving succeeds. That's correct behaviour, and it's also why a broken archiver fills a disk without bound.
The move that reliably stops the bleeding:
ALTER SYSTEM SET archive_command = '/bin/true';
SELECT pg_reload_conf();
-- or, more bluntly, archive_mode = off (requires a restart)
Checkpoints will then recycle and remove segments, disk usage falls, the cluster stabilises. On 7 July that took us from a crash loop back to serving traffic in minutes.
Now the price, stated plainly. Every segment skipped while archive_command is a no-op is a hole in your PITR chain. Your existing base backups are recoverable only up to the point archiving stopped working. There's no partial credit here.
Mandatory follow-up: fix the real archiver fault, re-enable archive_mode and the real archive_command, then take a fresh full backup immediately. Until that backup completes and verifies, treat your recovery point objective as "the moment archiving broke."
The other WAL-retention culprit is a replication slot whose restart_lsn has stopped advancing. An inactive slot retains WAL forever.
SELECT slot_name, slot_type, active, restart_lsn,
       pg_size_pretty(pg_wal_lsn_diff(pg_current_wal_lsn(), restart_lsn)) AS retained
FROM pg_replication_slots
ORDER BY pg_wal_lsn_diff(pg_current_wal_lsn(), restart_lsn) DESC;

-- Only if you are certain the consumer is gone for good:
SELECT pg_drop_replication_slot('slot_name');
On 13 and later, set max_slot_wal_keep_size so a dead slot can't take the cluster down with it. More on sizing and forecasting in our write-up on WAL growth and disk capacity planning.
| Setting | What it does | Under-pressure note | |---|---|---| | archive_mode | Enables/disables WAL archiving | off requires a restart; setting it stops retention growth immediately | | archive_command | Shell command run per WAL segment | Must exit 0 on success; changeable with a reload; /bin/true is the emergency no-op. Test it by hand as the postgres user before trusting it |
Check 2 — Postgres too many connections
The symptom is FATAL: sorry, too many clients already. The cluster is up and healthy; it simply has no slots left. This is usually the most recoverable failure on the whole tree, because Postgres reserves slots specifically for this moment.
SELECT state, count(*)
FROM pg_stat_activity
GROUP BY state
ORDER BY count DESC;

SELECT application_name, usename, count(*)
FROM pg_stat_activity
GROUP BY 1, 2
ORDER BY 3 DESC
LIMIT 20;

SELECT current_setting('max_connections') AS max_conn,
       current_setting('superuser_reserved_connections') AS reserved,
       (SELECT count(*) FROM pg_stat_activity) AS in_use;
superuser_reserved_connections (default 3) exists exactly for this scenario. Connect as the superuser, not as your app role, and you'll get in even when the pool is completely saturated.
Then reclaim slots. Target idle in transaction, not idle:
SELECT pg_terminate_backend(pid), pid, usename, application_name, state,
       now() - state_change AS idle_for
FROM pg_stat_activity
WHERE state = 'idle in transaction'
  AND state_change < now() - interval '5 minutes'
  AND pid <> pg_backend_pid();
Use pg_terminate_backend, not pg_cancel_backend. Cancelling only kills the running query and leaves the session connected, which frees nothing. Terminating an idle-in-transaction session is usually safe because its work is uncommitted and gets rolled back.
There's a second reason to kill those sessions. An open transaction holds its snapshot, which pins the xmin horizon and blocks vacuum from removing dead tuples newer than that snapshot. A long idle-in-transaction session is simultaneously eating a connection slot and quietly bloating your tables.
The long-term fix is a connection pooler. Raising max_connections buys you nothing durable — it just relocates the failure to an OOM later on. Each backend is a process with its own memory, and every slot you add is another multiple of work_mem you've promised the kernel. We covered the sizing arithmetic in connection pooling for Postgres.
| Setting | What it does | Under-pressure note | |---|---|---| | max_connections | Hard connection ceiling | Default 100, restart required. Raising it under load risks OOM, not relief | | superuser_reserved_connections | Slots reserved for superuser | Default 3, restart required. Your emergency door in a connection lockout — keep it at 3-5, never 0 |
Check 3 — Postgres OOM killer: did the kernel kill you?
sudo dmesg -T | grep -i -E 'out of memory|oom|killed process'
sudo journalctl -k --since '-2 hours' | grep -i -E 'oom|killed process'
sudo journalctl -u postgresql --since '-1 hour' --no-pager | tail -n 100
Two very different outcomes, and the log tells you which:
Postmaster killed. Whole cluster gone, no graceful shutdown, no "database system is shut down" message. The log just stops.
Backend killed. The postmaster notices the abnormal exit, terminates the remaining backends and runs crash recovery. You'll see terminating connection because of crash of another server process followed by all server processes terminated; reinitializing. The cluster comes back on its own, usually in seconds.
Protect the postmaster with a negative oom_score_adj, as the documentation recommends. Note that child backends inherit that value unless your build resets it for children, which you don't want.
Container caveat. In Kubernetes or plain containers, a cgroup memory limit kill sends SIGKILL from the container runtime, not the host OOM killer, and it may never show up in the host's dmesg the way a global OOM does. Check the pod instead:
kubectl describe pod <pod> | grep -A5 'Last State'
# Reason: OOMKilled, Exit Code: 137
Exit code 137 means the container hit memory.max. Raising the limit without changing Postgres config just moves the failure later.
The knobs that actually cause it: shared_buffers set too aggressively relative to the container limit, and work_mem. Remember work_mem is allocated per sort or hash node per backend, not per connection. One query with four hash joins and two sorts can consume six times work_mem on its own, so work_mem × max_connections is a floor, not a worst case. maintenance_work_mem and hash aggregates spilling on bad row estimates finish the job.
| Setting | What it does | Under-pressure note | |---|---|---| | shared_buffers | Postgres's own page cache | Restart required. Typically 25% of RAM on a dedicated host; much lower relative to a container limit | | work_mem | Per-sort/hash memory, per operation | Reloadable, settable per-session and per-role — the correct way to give a reporting user 256MB without giving it to your web tier | | maintenance_work_mem | Memory for vacuum, index builds | Large values here can spike during maintenance windows, not just query load |
Check 4 — pg_stat_archiver failed_count tells you the truth
SELECT * FROM pg_stat_archiver;archived_count climbing with a recent last_archived_time means archiving is healthy. A rising failed_count with a recent last_failed_time, and a last_failed_wal that hasn't moved, is the definitive signal that archiving is stuck. Compare last_archived_wal against the newest file in pg_wal to size the backlog.
ls -1 "$PGDATA/pg_wal" | grep -E '^[0-9A-F]{24}#39; | wc -lSteady state should sit somewhere near what max_wal_size and wal_keep_size imply. Thousands of files means retention, not throughput.
Three failure classes cover nearly everything: credentials and permissions (expired keys, a rotated secret, a directory the postgres user can no longer write), destination full or over quota, and network or DNS. All three look identical from inside Postgres. Run the archive_command by hand as the postgres user with a real segment name. The error it prints is usually the whole answer.
Ours was quota, as above — the object store returning HTTP 403 QuotaExceeded on every PUT looked exactly like a broken stanza or bad credentials from the database side, which is exactly how it burned twenty minutes of the incident before anyone checked the bucket.
Once you've fixed it, verify — don't trust that it will drain, confirm it:
SELECT pg_switch_wal();
SELECT * FROM pg_stat_archiver;   -- archived_count must be climbing, failed_count flat
Then watch the file count in pg_wal fall over the next few checkpoints. If it doesn't fall, you haven't fixed it.
Check 5 — The server log, postgres crash recovery, and the corruption branch
Find the log. SHOW log_directory; and SHOW log_filename; if the cluster is up, otherwise journalctl -u postgresql. Read the last 200 lines, oldest fatal first.
| Log string | What it means | |---|---| | PANIC: could not write to file ... No space left on device | Disk full. Check 1 | | FATAL: sorry, too many clients already | Connection exhaustion. Check 2 | | terminating connection because of crash of another server process | A backend died abnormally, often OOM. Check 3 | | archive command failed with exit code N | Archiver broken. Check 4 | | database system is shut down | Clean stop. Someone or something stopped it deliberately | | the database system is starting up, forever | Crash recovery is running. Check WAL replay progress before assuming it is hung | | could not open file "pg_xact/0ABC" | Missing clog segment. Corruption branch | | invalid page in block N of relation ... | Page-level damage. Corruption branch | | could not access status of transaction ... | Commit log damage. Corruption branch |
If you land on the corruption branch, stop moving. Take a filesystem-level or block-level copy of the entire data directory before any further action, including before any restart attempt. Check dmesg for I/O errors and SMART failures on the underlying device. Then escalate to someone who has dealt with page-level corruption before.
Do not reach for zero_damaged_pages or pg_resetwal as a first move. Both trade an outage you can still recover from for silent, permanent data loss.
The three things that turn an outage into data loss
1. Deleting files from pg_wal by hand. At 3am, with a full disk and a directory full of 16MB files that "have already been archived," this feels like the obvious move — they're just logs, right? It's not safe. Some of those segments are required for crash recovery, and removing the wrong one can leave the cluster unable to start at all. The supported paths are pg_archivecleanup for genuinely archived segments, or fixing the archiver so Postgres recycles them itself. Free space somewhere else instead.
2. pg_resetwal to make a stubborn cluster start. It works, in the sense that the cluster starts. It does so by discarding WAL state, which can lose committed transactions and leave logically inconsistent data that looks fine right up until a query returns wrong results weeks later. The documentation calls it a last resort and advises a dump and reload afterwards. Believe it. Reach for this and you've traded a recovery for a forensic exercise.
3. Promoting or restoring a replica before you understand why the primary died. It feels like the safe move, since the replica is healthy. But if the primary died from corruption, a bad config, or a resource limit, you may be promoting a replica that faithfully replayed — or will shortly replay — the same failure. Diagnose first, then fail over.
Special cases the tree does not cover
Transaction ID wraparound. The cluster refuses commands with database is not accepting commands to avoid wraparound data loss. Check first:
SELECT datname, age(datfrozenxid) AS xid_age,
       2^31 - age(datfrozenxid) AS remaining
FROM pg_database
ORDER BY xid_age DESC;
Historically the fix was a vacuum in single-user mode. On modern versions you can often vacuum normally before it gets that far, which is the entire argument for monitoring age(datfrozenxid) continuously rather than discovering it at the shutdown threshold.
Inodes exhausted with free bytes. df -i. Usually thousands of tiny files from a runaway log or temp directory.
A missing shared library after a host move. This is worth a paragraph on its own. The 7 July disk-full outage had a root cause identified three weeks later, on 29 July, and it sat three weeks upstream of the outage itself. A host migration left postgis-3.so missing. Backends using that extension started failing, but critically, autovacuum workers that touched PostGIS-using databases failed to start too, and wraparound-priority scheduling meant those failures starved autovacuum cluster-wide for 19 days. One table bloated to 177GB. That bloat inflated full backups, differential backups and WAL volume, which is what pushed the object store past its 250GB quota, which broke archiving, which filled pg_wal, which took the cluster down. Five layers between cause and symptom. If you take one thing from this article: check whether autovacuum is actually running, everywhere, all the time. Our autovacuum and bloat guide has the queries.
Read-only remount after an I/O error. mount | grep ' ro,'. The kernel remounted the filesystem read-only to protect it after a hardware error, and Postgres will fail every write with a misleading-looking error. Fix the hardware, then the filesystem, then Postgres.
Clock and permission changes after a host move. Ownership on $PGDATA must be the postgres user, mode 0700 or 0750. A restore that ran as root will refuse to start. Check system time and NTP drift too — don't assume it's a Postgres bug.
After the fire: the 30-minute follow-up
- If you neutralised
archive_command, restore the real one, confirmpg_stat_archiver.archived_countis climbing, and take a fresh full backup. Mark all prior backups as recoverable only to the point archiving broke. - Re-enable
archive_modeif you turned it off, and confirm the restart actually applied it. - Run the
age(datfrozenxid)query on every database, not just the one that paged you, and confirm it's falling, not just flat. - Check
pg_replication_slotsfor anything inactive you created during the incident. - Write the timeline down while it's fresh. Timestamps, commands run, what each one showed. You won't remember it in a week.
Here's the part worth sitting with. Every one of the five checks in this tree has a leading indicator that fires days before the page. Disk runway, projected forward from actual growth rate, not current percentage. pg_wal directory size against max_wal_size. pg_stat_archiver.failed_count crossing zero the moment the first upload fails. Connection headroom as a percentage, not a count. Autovacuum liveness per database, which would have caught the postgis-3.so failure on day one instead of day nineteen.
None of that is exotic. It's five queries and a threshold. That's exactly what MyDBA's free health check watches, on a schedule, and the honest pitch is that it turns this entire runbook into something you never open. The 318GB incident had a 19-day warning window. Nobody was looking at the right five numbers.
The runbook, condensed
# 0. CAPTURE FIRST. Do not restart. Do not delete.
sudo tail -n 200 /var/log/postgresql/*.log
ps -ef | grep [p]ostmaster
df -h "$PGDATA"

# 1. DISK
df -h "$PGDATA"; df -i "$PGDATA"; df -h "$PGDATA/pg_wal"
du -sh "$PGDATA/pg_wal"; ls "$PGDATA/pg_wal" | wc -l
sudo du -sh --max-depth=1 "$PGDATA" | sort -rh | head -10
#   -> free non-Postgres space. NEVER rm from pg_wal.

# 2. CONNECTIONS  (psql as superuser, reserved slots exist for this)
#   select state, count(*) from pg_stat_activity group by 1 order by 2 desc;
#   select pg_terminate_backend(pid) from pg_stat_activity
#    where state='idle in transaction' and state_change < now()-interval '5 min';

# 3. OOM
sudo dmesg -T | grep -i -E 'out of memory|oom|killed process'
sudo journalctl -u postgresql --since '-1 hour' --no-pager | tail -n 100
kubectl describe pod <pod> | grep -A5 'Last State'   # exit 137 = OOMKilled

# 4. WAL / ARCHIVER
#   select * from pg_stat_archiver;
#   select slot_name, active, restart_lsn,
#          pg_size_pretty(pg_wal_lsn_diff(pg_current_wal_lsn(), restart_lsn))
#     from pg_replication_slots;
#   escape hatch: alter system set archive_command='/bin/true'; select pg_reload_conf();
#   MANDATORY AFTER: fix archiver, re-enable, take a NEW FULL BACKUP.
#   verify: select pg_switch_wal(); then watch archived_count climb.

# 5. LOGS / CORRUPTION
sudo tail -n 200 /var/log/postgresql/*.log
#   'invalid page in block' / 'could not access status of transaction'
#   -> STOP. Block-level copy of $PGDATA. Check dmesg for I/O errors. Escalate.
#   -> NO pg_resetwal. NO zero_damaged_pages.

# WRAPAROUND CHECK (run anytime)
#   select datname, age(datfrozenxid) from pg_database order by 2 desc;
Fifteen minutes, five checks, nothing destructive. Print it, paste it in the wiki, and hand it to whoever is on call next weekend.
Whoever it is won't be diagnosing from first principles at 3am — they'll be running the block above in order, and that's the entire point of writing it down. The tree works because it's cheap-to-destructive, not because any single check is clever: disk and connections cost you a minute and rule out the majority of pages, OOM and the archiver cost a few more, and the corruption branch exists specifically to make you stop instead of improvise. Every outage in this article had a boring cause and an obvious leading indicator that nobody happened to be watching that week. Fix that, and the runbook becomes a formality instead of a fire drill — the health check is one way to make sure it stays that way.