Visualizing Lock Chains: Find the Root Blocker in Seconds
Visualizing Lock Chains: Find the Root Blocker in Seconds
The Problem
Session A is blocked. You check pg_locks and find Session B holds the conflicting lock. You terminate Session B, but Session A is still blocked. That is because Session B was also blocked — by Session C. Session C acquired an AccessExclusiveLock because someone ran ALTER TABLE on a high-traffic table without thinking about the consequences. A flat list of pg_locks does not show you this dependency chain.
Lock chains form when sessions queue behind a blocker, and that blocker is itself waiting on another lock. The chain can be three, four, or more levels deep. Each additional level multiplies the blast radius — every new session that touches any locked relation joins the chain. Within minutes, a single forgotten ALTER TABLE in a production psql session can block dozens of connections, exhaust your connection pool, and bring the application to a standstill.
The standard response under pressure is to scan pg_stat_activity, find something that looks stuck, and terminate it. If you kill an intermediate blocker instead of the root, nothing improves. The intermediate session goes away, but the root blocker still holds its lock, and every other session remains blocked. You have wasted time and confused your incident timeline. What you need is visibility into the full chain — from leaf waiters back to the single session holding the root lock.
How to Detect It
PostgreSQL provides the raw data in pg_locks and pg_stat_activity, but assembling it into a chain requires a recursive CTE:
-- Build lock dependency chains from pg_locks + pg_stat_activity
WITH RECURSIVE lock_chain AS (
    SELECT
        blocked.pid AS blocked_pid,
        blocking.pid AS blocking_pid,
        blocked.locktype,
        blocked.relation::regclass AS locked_relation,
        act.query AS blocked_query,
        act.wait_event_type,
        act.wait_event,
        1 AS depth
    FROM pg_locks blocked
    JOIN pg_locks blocking
        ON blocking.locktype = blocked.locktype
        AND blocking.database IS NOT DISTINCT FROM blocked.database
        AND blocking.relation IS NOT DISTINCT FROM blocked.relation
        AND blocking.page IS NOT DISTINCT FROM blocked.page
        AND blocking.tuple IS NOT DISTINCT FROM blocked.tuple
        AND blocking.virtualxid IS NOT DISTINCT FROM blocked.virtualxid
        AND blocking.transactionid IS NOT DISTINCT FROM blocked.transactionid
        AND blocking.pid != blocked.pid
        AND blocking.granted
        AND NOT blocked.granted
    JOIN pg_stat_activity act ON act.pid = blocked.pid

    UNION ALL

    SELECT
        lc.blocked_pid,
        b2.pid AS blocking_pid,
        b2.locktype,
        b2.relation::regclass,
        lc.blocked_query,
        lc.wait_event_type,
        lc.wait_event,
        lc.depth + 1
    FROM lock_chain lc
    JOIN pg_locks w ON w.pid = lc.blocking_pid AND NOT w.granted
    JOIN pg_locks b2
        ON b2.locktype = w.locktype
        AND b2.database IS NOT DISTINCT FROM w.database
        AND b2.relation IS NOT DISTINCT FROM w.relation
        AND b2.pid != w.pid
        AND b2.granted
)
SELECT * FROM lock_chain ORDER BY depth DESC;
This works, but it is complex, easy to get wrong under pressure, and produces a flat result set that still requires mental effort to visualize as a tree. During an incident at 3 AM, you do not want to be debugging a recursive CTE — you want to see the chain and act on it.
How myDBA.dev Shows It
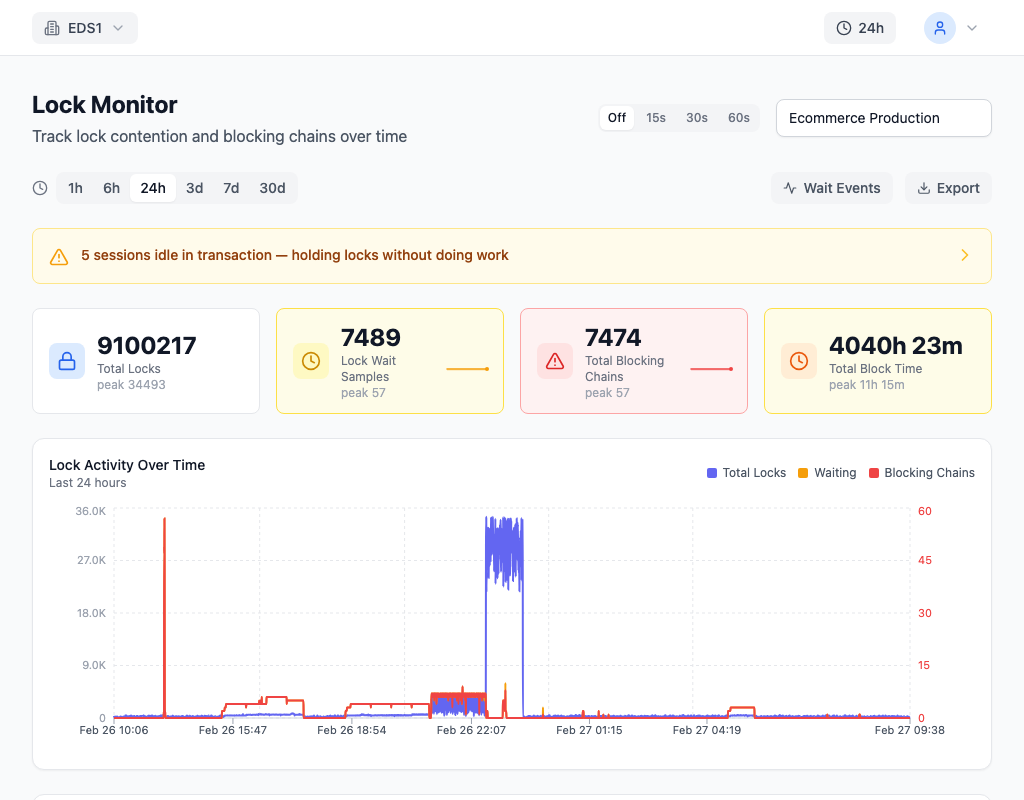
myDBA.dev renders lock chains as a visual dependency graph. The root blocker is highlighted at the top of the tree, with arrows flowing down to every session it is directly or indirectly blocking. You do not need to trace through query results or mentally reconstruct the chain — the graph shows the entire structure at a glance. One look tells you which single session to terminate to unblock the entire chain.
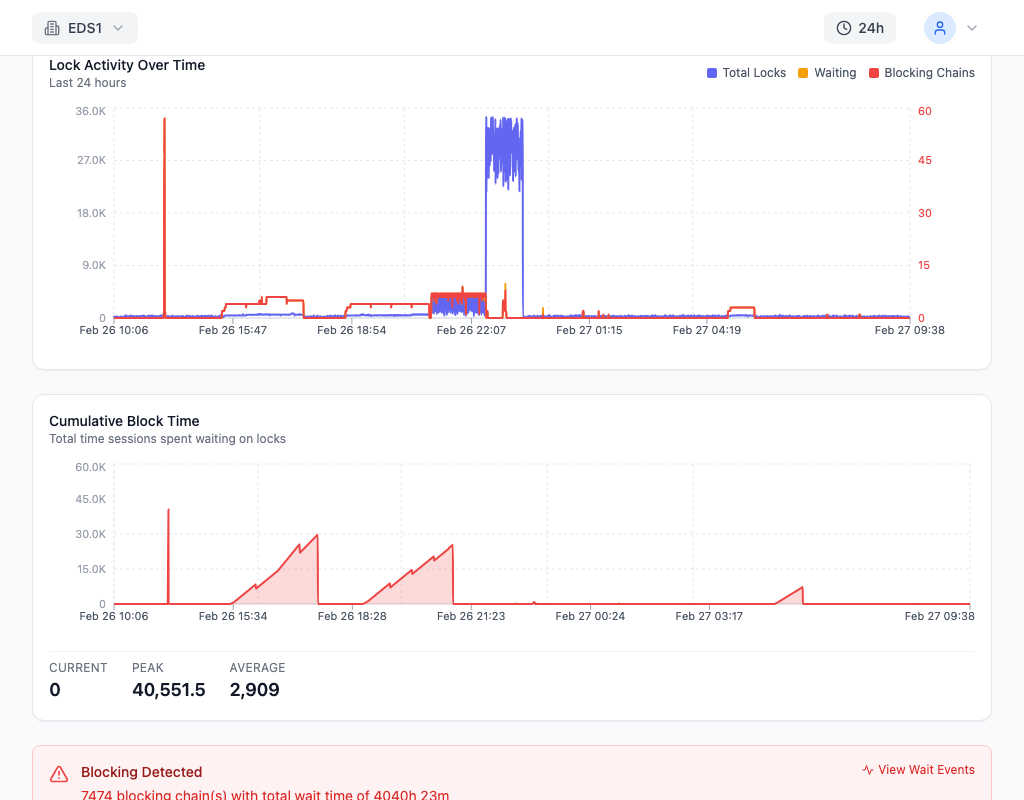
Each node in the graph displays the lock type (AccessExclusiveLock, RowExclusiveLock), the locked relation, the query text running in each session, and how long the transaction has been open. The detail panel distinguishes root blockers from intermediate waiters, so you never accidentally terminate a session that is itself a victim. The transaction duration on the root blocker tells you whether this is a long-running DDL operation, an idle-in-transaction session, or an active query — each requires a different response.
How to Fix It
Terminate the root blocker, not intermediate nodes:
-- Terminate the root blocking session (get the PID from the chain graph)
SELECT pg_terminate_backend(12345);
Use pg_terminate_backend rather than pg_cancel_backend. Cancel sends a query-level interrupt and only works if the session is actively executing a query. A session that is idle in transaction — the most common root blocker — ignores cancel signals. Terminate closes the entire connection, releasing all held locks immediately.
If the root blocker is a DDL operation like ALTER TABLE that you cannot simply kill, set a lock_timeout on the DDL session so it gives up instead of blocking indefinitely:
-- Set lock_timeout before running DDL
SET lock_timeout = '5s';
ALTER TABLE orders ADD COLUMN status_code integer;
RESET lock_timeout;
With lock_timeout = 5s, the ALTER TABLE fails with an error if it cannot acquire the lock within 5 seconds, instead of blocking every other session until it eventually gets the lock. You can then retry the DDL during a lower-traffic window.
For index operations, always use CONCURRENTLY:
-- Non-blocking index creation
CREATE INDEX CONCURRENTLY idx_orders_status
    ON orders (status_code);
CREATE INDEX CONCURRENTLY takes a weaker ShareUpdateExclusiveLock instead of the default ShareLock, allowing concurrent inserts, updates, and deletes to continue while the index is built.
How to Prevent It
Set lock_timeout as a session default for all application connections. A value of 3-5 seconds prevents any single query from blocking other sessions for longer than that:
ALTER SYSTEM SET lock_timeout = '5s';
SELECT pg_reload_conf();
Set statement_timeout as a safety net to kill queries that run unexpectedly long. Never run DDL statements — ALTER TABLE, DROP INDEX, CREATE INDEX (without CONCURRENTLY) — during peak traffic hours. Schedule schema changes for maintenance windows or use tools like pg_repack and CREATE INDEX CONCURRENTLY that minimize lock contention.
Monitor lock wait events continuously. A spike in Lock wait events indicates a chain is forming. myDBA.dev surfaces lock chains in real time, showing the full dependency graph the moment blocking begins — before the chain grows long enough to exhaust your connection pool. Catching a two-node chain early is a non-event; catching a twenty-node chain at 3 AM is an incident.