Scaling pgvector: Memory, Quantization, and Index Build Strategies
Scaling pgvector: Memory, Quantization, and Index Build Strategies
The Problem
pgvector works beautifully at small scale. A few hundred thousand vectors with an HNSW index, and similarity searches come back in single-digit milliseconds. The problems emerge when you push past a million vectors, and they compound as you approach tens of millions.
At scale, pgvector hits three walls simultaneously:
1. HNSW index builds need massive maintenance_work_mem or fall back to a slow path.
Building an HNSW index requires holding the entire graph in memory during construction. If maintenance_work_mem is too low, PostgreSQL falls back to a disk-based build that can be 10-50x slower. For a table with 5 million 1536-dimension vectors, the index build may need 8-16 GB of working memory. The default maintenance_work_mem of 64 MB is not even close.
2. Full-precision vectors consume enormous storage.
Each dimension in a vector column is stored as a 4-byte float32. A 1536-dimension embedding (the size used by OpenAI's text-embedding-ada-002) takes approximately 6 KB per row. At 10 million rows, that is 60 GB just for the vector column -- before you account for the HNSW index, which can be 1.5-2x the size of the raw data.
3. Index sizes can exceed available memory.
An HNSW index on 10 million 1536-dimension vectors can easily reach 80-120 GB. If that exceeds your system's available RAM, queries that traverse the graph will hit disk on every hop, turning sub-millisecond searches into multi-second ones.
The solutions involve three strategies: quantization to reduce precision (halfvec for 2x reduction, bit for 32x), tuning maintenance_work_mem for fast index builds, and choosing the right index parameters for your recall requirements.
How to Detect It
Start by understanding your current vector landscape -- dimensions, storage, and memory configuration:
-- Check vector column dimensions and storage
SELECT
    attrelid::regclass AS table_name,
    attname AS column_name,
    atttypmod AS dimensions,
    pg_size_pretty(pg_column_size(attname)) AS avg_row_size
FROM pg_attribute
WHERE atttypid = 'vector'::regtype
ORDER BY attrelid;

-- Check maintenance_work_mem (critical for HNSW builds)
SHOW maintenance_work_mem;

-- Check index build progress
SELECT
    phase,
    tuples_done,
    tuples_total,
    round(100.0 * tuples_done / NULLIF(tuples_total, 0), 1) AS pct_done
FROM pg_stat_progress_create_index;
The first query reveals how many vector columns you have and their dimensions. Anything above 768 dimensions at millions of rows deserves attention. The maintenance_work_mem check tells you whether index builds will use the fast in-memory path or the slow disk fallback. If it is under 1 GB and you have millions of vectors, you are almost certainly hitting the slow path.
The index build progress query is useful during active builds -- if phase shows a disk-based sort or external merge rather than in-memory construction, your maintenance_work_mem is too low.
Check your index sizes relative to available memory:
-- Vector index sizes
SELECT
    indexrelname AS index_name,
    pg_size_pretty(pg_relation_size(indexrelid)) AS index_size,
    idx_scan AS scans,
    idx_tup_read AS tuples_read
FROM pg_stat_user_indexes
WHERE indexrelname LIKE '%vector%'
   OR indexrelname LIKE '%hnsw%'
   OR indexrelname LIKE '%ivfflat%'
ORDER BY pg_relation_size(indexrelid) DESC;
If any index is larger than 50-70% of your system's RAM, expect cache pressure during searches. If it exceeds RAM entirely, every similarity search will involve disk I/O.
How myDBA.dev Shows It
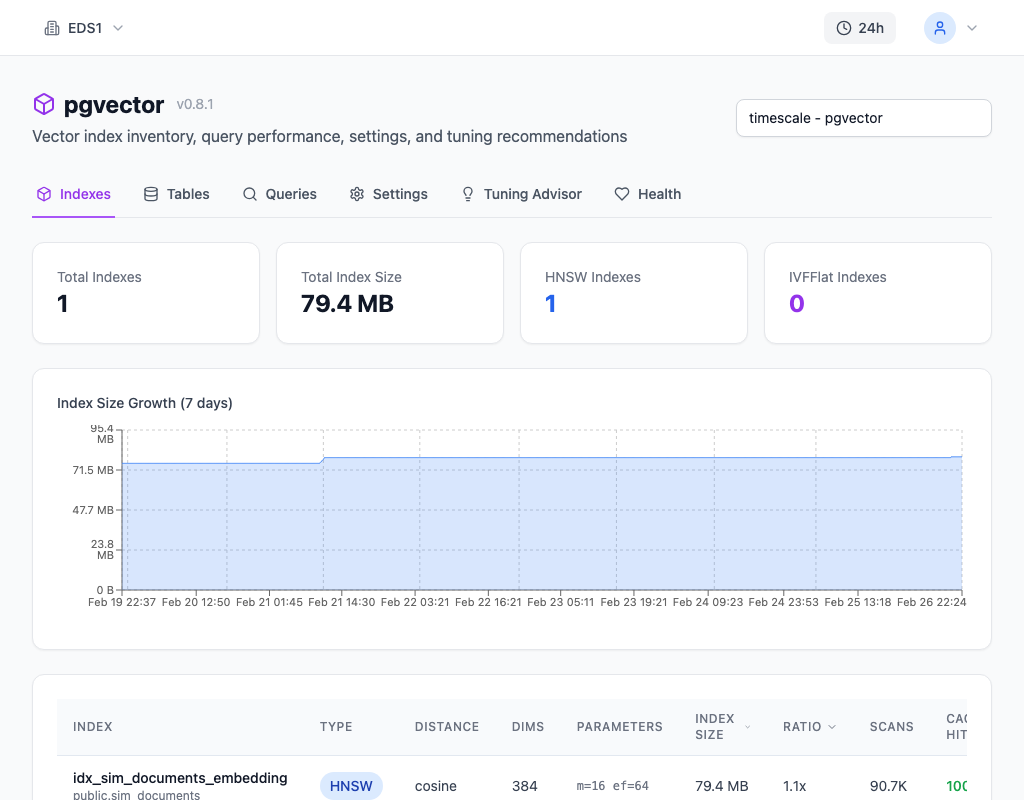
myDBA.dev's pgvector monitoring page displays vector column dimensions, row counts, and index memory usage side by side. You can see at a glance which tables have high-dimensional vectors, how large their indexes have grown, and whether the index-to-RAM ratio is healthy. When an HNSW index is being built, the build progress is shown in real time so you can tell whether it is using the fast in-memory path or has fallen back to disk.
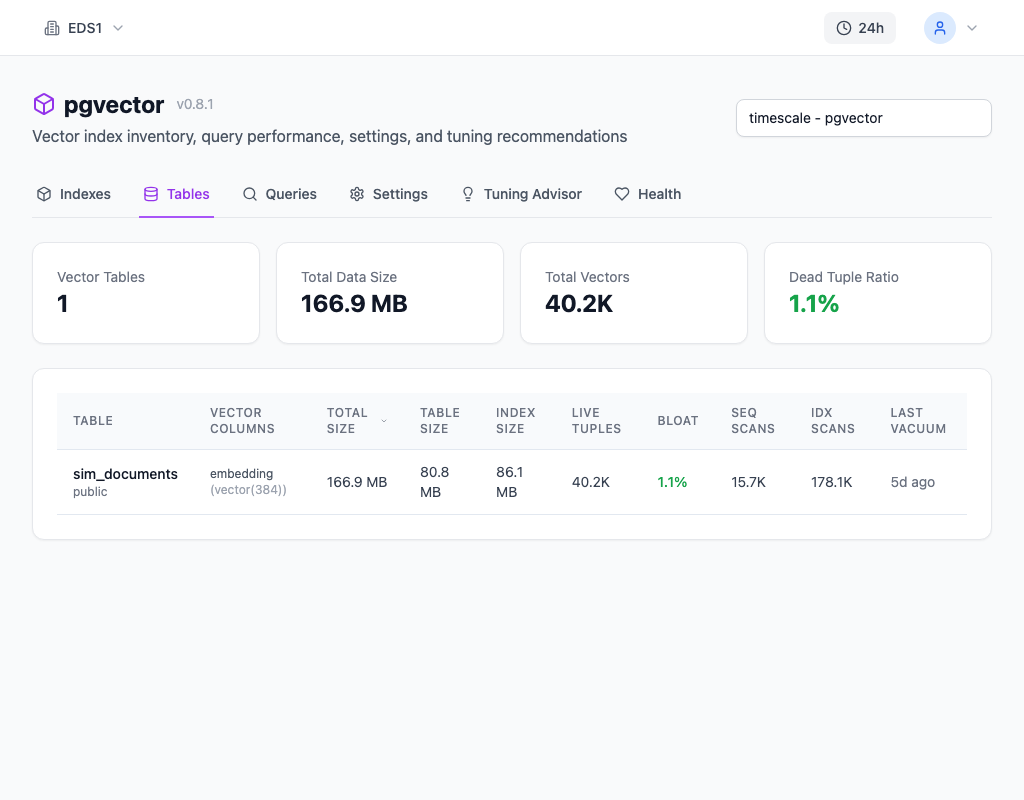
The storage view breaks down table and index sizes for vector-heavy tables, making it easy to identify which tables would benefit most from quantization. If a single vector index is consuming more storage than all other indexes combined, that is the table to focus on first.
How to Fix It
Set Memory for Fast Index Builds
Before creating or rebuilding any HNSW index, set maintenance_work_mem high enough to hold the entire graph in memory:
-- Increase memory for HNSW index builds (prevents slow-path fallback)
SET maintenance_work_mem = '4GB';
This is a session-level setting, so it only affects the current connection and resets when the session ends. For a table with N rows of D-dimension vectors, a rough estimate for the required memory is N D 4 bytes 2 (the factor of 2 accounts for graph overhead). For 5 million rows of 1536-dimension vectors: 5M 1536 4 2 = ~60 GB. If you cannot allocate that much, consider building the index in stages or using quantized vectors.
Use Quantization to Reduce Storage and Index Size
The most effective strategy for scaling pgvector is quantization -- storing vectors at reduced precision. pgvector supports two quantized types:
halfvec (2x reduction): Uses float16 instead of float32. Storage drops by half with minimal impact on recall (typically less than 1% degradation for normalized embeddings).
-- Use halfvec for 2x storage reduction with minimal recall loss
ALTER TABLE documents
ADD COLUMN embedding_half halfvec(384);

UPDATE documents
SET embedding_half = embedding::halfvec(384);

CREATE INDEX CONCURRENTLY idx_documents_half_hnsw
ON documents USING hnsw (embedding_half halfvec_cosine_ops)
WITH (m = 16, ef_construction = 200);
bit (32x reduction): Binary quantization reduces each dimension to a single bit. Storage drops by 32x, but recall degrades significantly for standalone searches. Binary quantization works best as a pre-filter: use the bit index to retrieve a candidate set, then re-rank using the full-precision vectors.
-- For binary quantization (32x storage reduction, good for pre-filtering)
ALTER TABLE documents
ADD COLUMN embedding_bit bit(384);
For most production use cases, halfvec is the best starting point. The storage savings are significant (a 60 GB vector column becomes 30 GB), index build times drop proportionally, and the recall impact is negligible for cosine similarity on normalized embeddings.
Tune Index Parameters
HNSW has two key build parameters:
m(default 16): Number of connections per node. Higher values improve recall but increase index size and build time. Values of 16-32 cover most use cases.ef_construction(default 64): Size of the dynamic candidate list during construction. Higher values improve recall at the cost of longer build times. Set this to at least 100 for production indexes; 200 is a good default for high-recall requirements.
At query time, hnsw.ef_search (default 40) controls the candidate list size for searches. Increase it if recall is too low:
SET hnsw.ef_search = 100;Higher ef_search improves recall at the cost of query latency. Profile the trade-off: if going from 40 to 100 improves recall by 5% but doubles query time from 2ms to 4ms, that may or may not be acceptable for your application.
How to Prevent It
Build capacity planning into your vector storage strategy from the start. Before your table hits a million rows, decide:
1. What precision do you actually need? If your recall requirements allow halfvec (and they usually do), start with halfvec from day one. Retrofitting quantization onto a table with 50 million full-precision vectors is painful.
2. How much RAM can you dedicate to indexes? HNSW indexes must fit in memory for fast queries. If your projected index size exceeds available RAM, you need quantization, partitioning, or a larger instance -- and that decision is easier to make before you have the data than after.
3. What is your index rebuild strategy? HNSW indexes cannot be updated incrementally in the background. If your data changes frequently, plan for periodic index rebuilds and ensure your maintenance_work_mem is configured for fast builds.
Monitor vector index sizes and build times over time. A gradual increase in index size is expected as data grows, but a sudden jump may indicate a dimension change or a bulk import that shifted the storage profile. Track the ratio of index size to available RAM -- when it crosses 60%, start planning your next scaling step. myDBA.dev tracks these metrics continuously, surfacing vector storage growth alongside overall database health so you can act before index sizes become a problem.
-- Monitor index size growth over time
SELECT
    indexrelname AS index_name,
    pg_size_pretty(pg_relation_size(indexrelid)) AS index_size,
    idx_scan AS scans,
    idx_tup_read AS tuples_read
FROM pg_stat_user_indexes
WHERE indexrelname LIKE '%vector%'
   OR indexrelname LIKE '%hnsw%'
   OR indexrelname LIKE '%ivfflat%'
ORDER BY pg_relation_size(indexrelid) DESC;

-- Check if sequential scans indicate missing indexes
SELECT relname, seq_scan, idx_scan
FROM pg_stat_user_tables
WHERE seq_scan > 100
  AND relname IN (SELECT tablename FROM pg_indexes WHERE indexdef LIKE '%vector%');
Keep an eye on sequential scan counts for vector tables. If a table with a vector index is still accumulating sequential scans, queries may not be using the index -- either because the planner estimates a sequential scan is cheaper (common when the index does not fit in memory), or because the query is not structured to use the index operator class. Both are signals that your scaling strategy needs adjustment.