Finding the Missing Indexes Your Queries Are Begging For
Finding the Missing Indexes Your Queries Are Begging For
The Problem
Your order lookup endpoint takes 3.2 seconds. Users are complaining. You run EXPLAIN ANALYZE and see a sequential scan on the orders table — 50 million rows, reading every single one to find the 12 that match your filter. The fix is a B-tree index on the filter column. That specific case is obvious.
The harder problem is finding all the tables where this is happening. A typical production database has 50 to 200 tables. Some are tiny reference tables where sequential scans are actually optimal. Others are multi-million-row tables being sequentially scanned dozens of times per second because nobody noticed that a new feature introduced a query without a supporting index. The application still works — it is just slow. No errors, no crashes, just gradually degrading response times that users tolerate until they do not.
What makes missing index detection genuinely difficult is that you need two pieces of information: which tables are being scanned sequentially, and which columns should be indexed based on the actual query patterns. pg_stat_user_tables tells you the first part. It does not tell you the second. Knowing that the orders table has a high sequential scan ratio is useful, but it does not tell you whether to index customer_id, created_at, status, or some combination of all three. That requires analyzing the queries themselves.
How to Detect It
Start by identifying tables with disproportionate sequential scan activity:
-- Tables with high sequential scan ratios on large tables
SELECT
    schemaname, relname AS table_name,
    seq_scan, idx_scan,
    CASE WHEN (seq_scan + idx_scan) > 0
        THEN round(100.0 * seq_scan / (seq_scan + idx_scan), 1)
        ELSE 0
    END AS seq_scan_pct,
    seq_tup_read,
    pg_size_pretty(pg_relation_size(relid)) AS table_size
FROM pg_stat_user_tables
WHERE seq_scan > 100
  AND pg_relation_size(relid) > 10 * 1024 * 1024  -- tables > 10MB
ORDER BY seq_tup_read DESC
LIMIT 15;
A table with 95% sequential scans and 500MB of data is almost certainly missing an index. A table with 95% sequential scans and 8KB of data is fine — PostgreSQL correctly chooses a sequential scan when the entire table fits in a few pages.
The seq_tup_read column is more useful than seq_scan alone. A table might have a low scan count but each scan reads millions of rows. Sort by seq_tup_read to find the tables consuming the most I/O from sequential access.
To identify which columns need indexing, you need to examine the actual queries. Check pg_stat_statements for queries against the problem tables:
-- Find the slowest queries hitting a specific table
SELECT query, calls, mean_exec_time, rows
FROM pg_stat_statements
WHERE query ILIKE '%orders%'
ORDER BY mean_exec_time * calls DESC
LIMIT 10;
Then run EXPLAIN on each to confirm the sequential scan and identify the filter columns:
EXPLAIN (COSTS, BUFFERS)
SELECT * FROM orders
WHERE customer_id = 12345 AND status = 'pending'
ORDER BY created_at DESC LIMIT 10;
The output shows which columns appear in Filter: conditions and Sort: operations — these are your index candidates. This manual process works but is tedious for more than a handful of queries.
How myDBA.dev Shows It
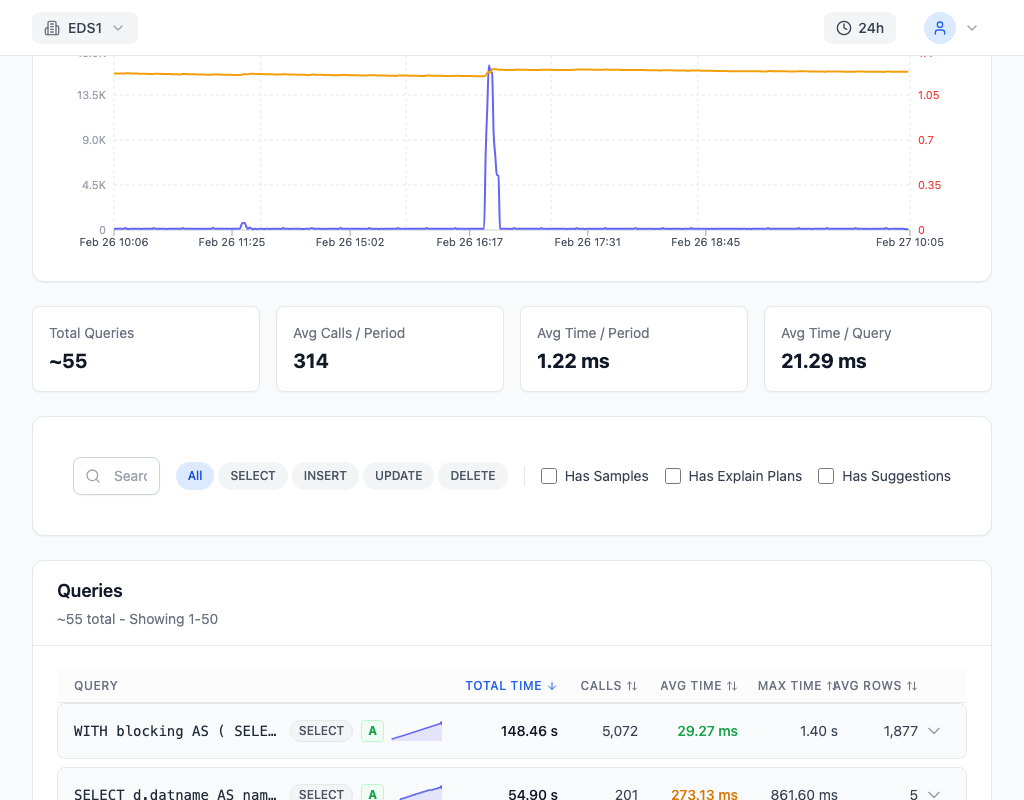
myDBA.dev combines sequential scan statistics with query pattern analysis to generate specific CREATE INDEX CONCURRENTLY recommendations. Rather than just telling you "the orders table has too many sequential scans," it analyzes the queries causing those scans and recommends the exact columns to index. Each recommendation shows the table, the recommended columns, the estimated size of the new index, and the number of queries that would benefit.
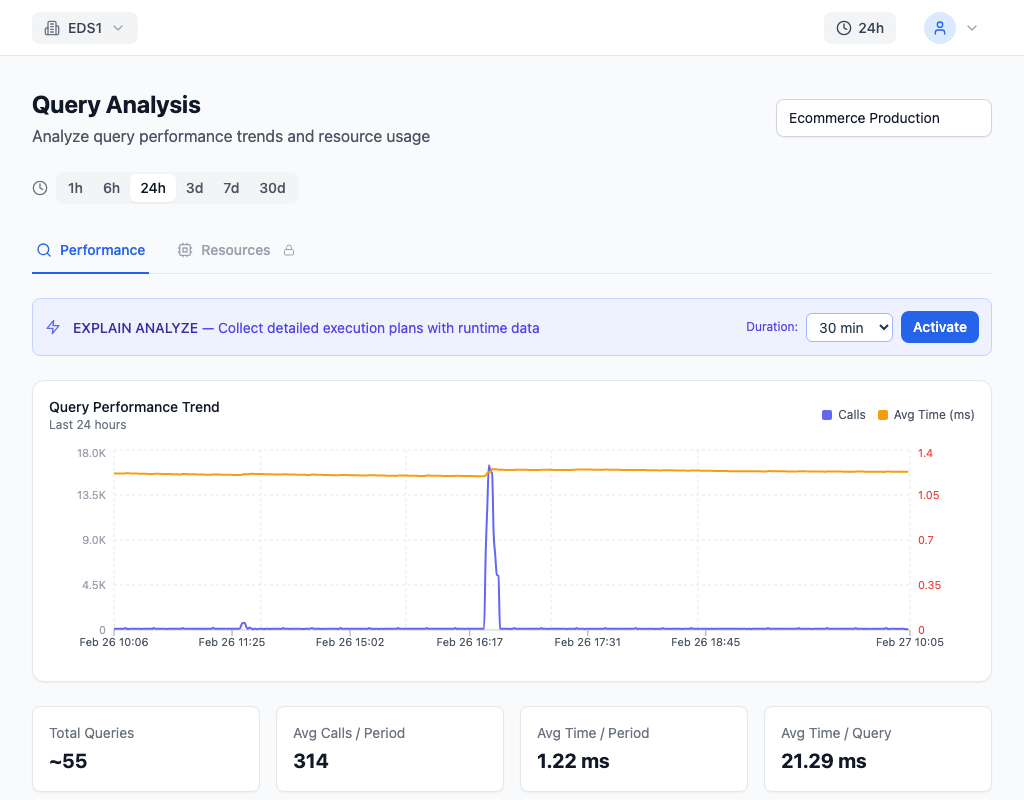
The sequential scan query view ties recommendations back to the actual queries driving them. You can see that SELECT * FROM orders WHERE customer_id = $1 AND status = $2 ORDER BY created_at DESC runs 8,400 times per hour with an average duration of 1.8 seconds. The recommended index on (customer_id, status, created_at DESC) would convert this from a sequential scan to an index scan, with an estimated query time reduction shown alongside the recommendation. This makes the cost-benefit of each index creation visible before you apply it.
How to Fix It
Walk through a recommendation from detection to verification:
1. Review the recommendation and the queries it serves:
-- Recommended index based on query pattern analysis
-- Serves: SELECT * FROM orders WHERE customer_id = $1 AND status = $2
--         ORDER BY created_at DESC
-- Current: seq scan, 1.8s avg, 8400 calls/hour
CREATE INDEX CONCURRENTLY idx_orders_customer_status_created
ON orders (customer_id, status, created_at DESC);
Column order matters. customer_id leads because it has the highest selectivity (each customer has few orders relative to the total). status is second for the equality filter. created_at DESC is last to support the ORDER BY without an additional sort step.
2. Verify the index is used after creation:
-- Re-run the query with EXPLAIN to confirm the index is picked up
EXPLAIN (ANALYZE, BUFFERS)
SELECT * FROM orders
WHERE customer_id = 12345 AND status = 'pending'
ORDER BY created_at DESC LIMIT 10;
Look for Index Scan using idx_orders_customer_status_created in the output. If you still see a sequential scan, the planner may need updated statistics:
ANALYZE orders;3. Monitor the impact over the next 24 hours:
-- Check that the new index is accumulating scans
SELECT indexrelname, idx_scan, idx_tup_read
FROM pg_stat_user_indexes
WHERE relname = 'orders'
  AND indexrelname = 'idx_orders_customer_status_created';
If idx_scan is climbing and the table's seq_scan count has slowed, the index is working. If idx_scan stays at zero, either the query pattern changed or the planner is not selecting the index — check for type mismatches between the query parameters and the indexed columns.
How to Prevent It
Monitor sequential scan ratios continuously, not just when performance degrades. New application deployments are the most common source of missing indexes — a developer adds a new query path, tests it against a development database with 1,000 rows where the sequential scan completes instantly, and ships it to production where the table has 50 million rows. The missing index only becomes apparent under production load.
Integrate index review into your deployment process. After every release, check pg_stat_user_tables for tables where seq_scan jumped relative to the pre-deploy baseline. myDBA.dev tracks these ratios over time, making it straightforward to spot the moment a new sequential scan pattern appears and correlate it with the deployment that introduced it.
Establish a rule of thumb: any table over 100MB should have less than 10% of its access patterns coming from sequential scans. If a large table exceeds this threshold, investigate the queries driving the scans before they become a performance bottleneck.