How to Find and Fix Missing Indexes in PostgreSQL
How to Find and Fix Missing Indexes in PostgreSQL
The Problem
When PostgreSQL cannot find an index to satisfy a query's WHERE clause, it falls back to a sequential scan — reading every row in the table to find matching results. On a 100-row table, nobody notices. On a 10-million-row orders table, a customer lookup that should take 2ms suddenly takes 200ms, your API response times spike, and users start seeing timeouts.
Missing indexes are the single most common performance problem in PostgreSQL databases. They happen naturally as applications evolve: a developer adds a query that filters on customer_email, but nobody creates a corresponding index. The query planner has no choice but to read every row in the table.
The damage compounds as tables grow. A sequential scan on a 50MB table reads 50MB of pages from disk (or shared buffers). As the table grows to 500MB, the same query reads 10x more data, evicts useful data from the buffer cache, and slows down other queries that were working fine. A single missing index on a high-traffic table can degrade performance across the entire database.
What makes this particularly insidious is that it passes testing unnoticed. With a few thousand rows in staging, a sequential scan completes in microseconds — the test suite passes, the PR gets merged, and the problem only surfaces in production under real data volumes and concurrent load.
How to Detect It
PostgreSQL tracks scan statistics in pg_stat_user_tables. This query identifies tables where sequential scans dominate:
-- Find tables with high sequential scan ratios (potential missing indexes)
SELECT
    schemaname,
    relname AS table_name,
    seq_scan,
    seq_tup_read,
    idx_scan,
    CASE WHEN (seq_scan + idx_scan) > 0
        THEN round(100.0 * seq_scan / (seq_scan + idx_scan), 1)
        ELSE 0
    END AS sequential_scan_percentage,
    pg_size_pretty(pg_relation_size(schemaname || '.' || relname)) AS table_size
FROM pg_stat_user_tables
WHERE seq_scan > 0
ORDER BY seq_tup_read DESC
LIMIT 20;
The key column is seq_tup_read — the total number of rows fetched by sequential scans. A table with millions of seq_tup_read and a high sequential_scan_percentage is a strong candidate for a missing index. Look for tables where idx_scan is zero or much lower than seq_scan — these are the tables where every query is doing a full table scan.
You can also use EXPLAIN ANALYZE to confirm whether a specific query is hitting a sequential scan:
EXPLAIN (ANALYZE, BUFFERS)
SELECT * FROM sim_customers
WHERE customer_email = 'test@example.com';
Look for Seq Scan in the output. If you see Seq Scan on sim_customers with a high actual time, the query is scanning the entire table when it should be doing an index lookup.
The limitation of pg_stat_user_tables is that it shows cumulative counts since the last statistics reset. You need to compare snapshots over time to catch new problems as they emerge — a one-time check tells you what happened historically, but not what changed after last week's deploy.
How myDBA.dev Shows It
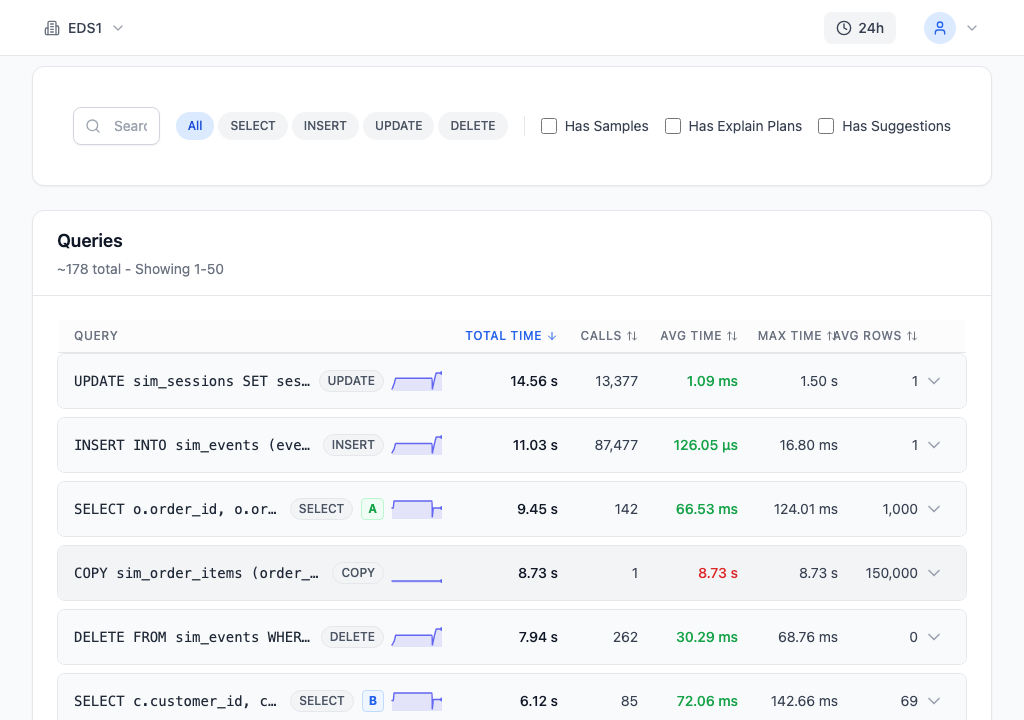
myDBA.dev's Query Analysis page surfaces missing index problems within minutes of deployment. The query list is sorted by total execution time, immediately highlighting the most expensive queries. In this example, an UPDATE sim_sessions accumulates 14.56 seconds of total time across 13,377 calls, a SELECT on orders averages 66.53ms per call (graded "A"), and a customer lookup query averages 72.06ms (graded "B"). Statement type badges (SELECT, INSERT, UPDATE, DELETE) and sparkline trends make it easy to scan for problematic patterns.
Each query row shows call count, total time, average time, max time, and rows per call. Queries highlighted in red are performing significantly worse than average — a clear signal that something is wrong. Clicking any query reveals its EXPLAIN plan, letting you confirm the sequential scan without connecting to the database directly.
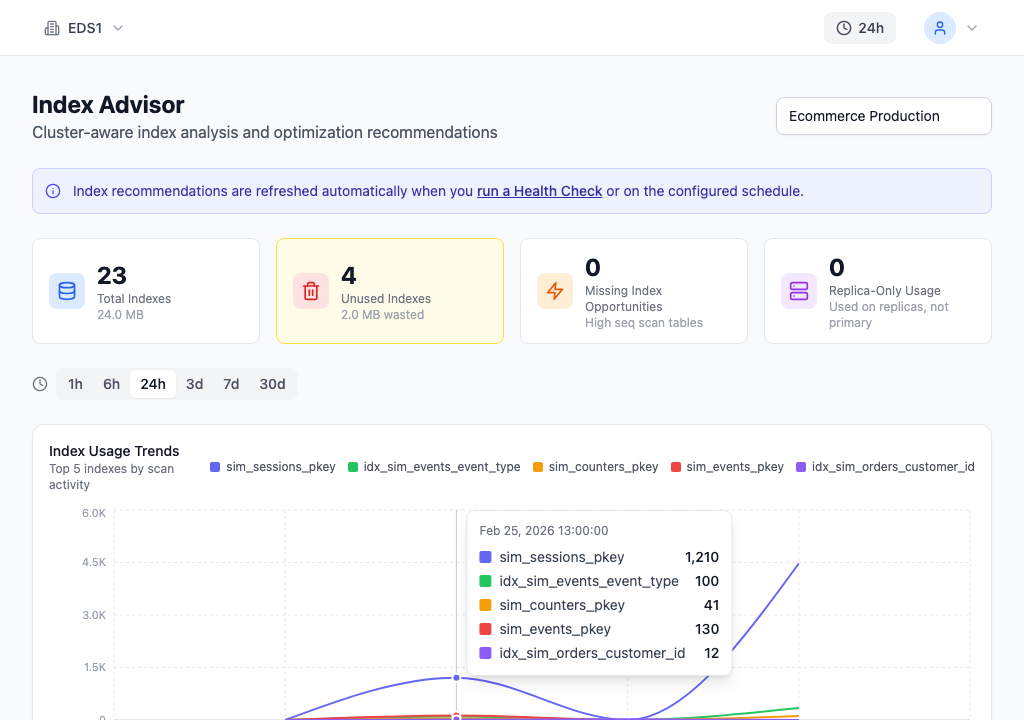
The Index Advisor takes a different angle — instead of looking at slow queries, it analyzes your existing indexes and identifies gaps. The summary cards show 23 total indexes consuming 24 MB, with 4 unused indexes wasting 2 MB. The Index Usage Trends chart reveals which indexes are actually being scanned over time, making it easy to spot indexes that were created but never used by the query planner.
The Recommendations section groups findings by severity: unused indexes that waste space and slow down writes, duplicate indexes that could be consolidated, and missing index opportunities where high sequential scan counts on specific tables suggest a new index is needed. Each recommendation includes the specific columns to index and the supporting queries that would benefit.
How to Fix It
Once you have identified the problematic queries, create indexes on the columns used in WHERE, JOIN, and ORDER BY clauses:
-- Create the missing index (CONCURRENTLY avoids locking the table)
CREATE INDEX CONCURRENTLY idx_sim_customers_email
    ON sim_customers (customer_email);

-- Verify the index is being used
EXPLAIN (ANALYZE, BUFFERS)
SELECT * FROM sim_customers
WHERE customer_email = 'test@example.com';
The CONCURRENTLY keyword is critical for production databases. A normal CREATE INDEX takes an ACCESS EXCLUSIVE lock on the table, blocking all reads and writes until the index is built — potentially minutes on a large table. CONCURRENTLY builds the index in the background, allowing normal operations to continue. It takes longer and requires two table scans, but avoids downtime.
After creating the index, verify with EXPLAIN ANALYZE. You should see Index Scan or Index Only Scan instead of Seq Scan. Check the Buffers section — an indexed lookup should read far fewer pages than a full table scan. A query that was reading 6,400 buffers (50MB) in a sequential scan might read just 4 buffers with an index.
For queries that filter on multiple columns, consider a multi-column index:
CREATE INDEX CONCURRENTLY idx_orders_customer_date
    ON orders (customer_id, order_date);
Column order matters in multi-column indexes. Place the most selective column (fewest matching rows) first, and columns used in range queries (<, >, BETWEEN) last. The query planner can use a multi-column index for queries that filter on any leading prefix of the columns — an index on (customer_id, order_date) serves queries filtering on customer_id alone, but not queries filtering only on order_date.
How to Prevent It
Build index awareness into your development workflow. Before merging any PR that adds a new query, run EXPLAIN against production-sized data and check for sequential scans. If your staging environment has realistic data volumes, add a CI check that flags queries with Seq Scan on tables above a certain size.
Monitor sequential scan ratios continuously, not just at deploy time. A table that shifts from mostly index scans to mostly sequential scans usually means a new query path was deployed without a supporting index. myDBA.dev tracks query performance trends over time, surfacing these regressions within minutes — catching them before users notice slowness rather than after.
Keep your statistics current by ensuring autovacuum runs frequently enough to update pg_statistic. Stale statistics cause the planner to underestimate row counts and choose sequential scans over available indexes. If last_autoanalyze on a high-churn table is hours old, the planner may be making decisions based on outdated data.
The single most impactful habit: every new WHERE clause deserves a moment of thought about whether an index exists to serve it.