Postgres Table Bloat: Measure It Honestly, Then Fix It in the Cheapest Way That
Postgres Table Bloat: Measure It Honestly, Then Fix It in the Cheapest Way That Works
A support ticket lands: "the events table is 12 GB and we only have about 3 GB of data in it." Nobody deleted anything unusual. No schema change. Disk usage on the primary has been climbing 400 MB a day for three weeks and the nightly backup now takes twice as long as it did in June.
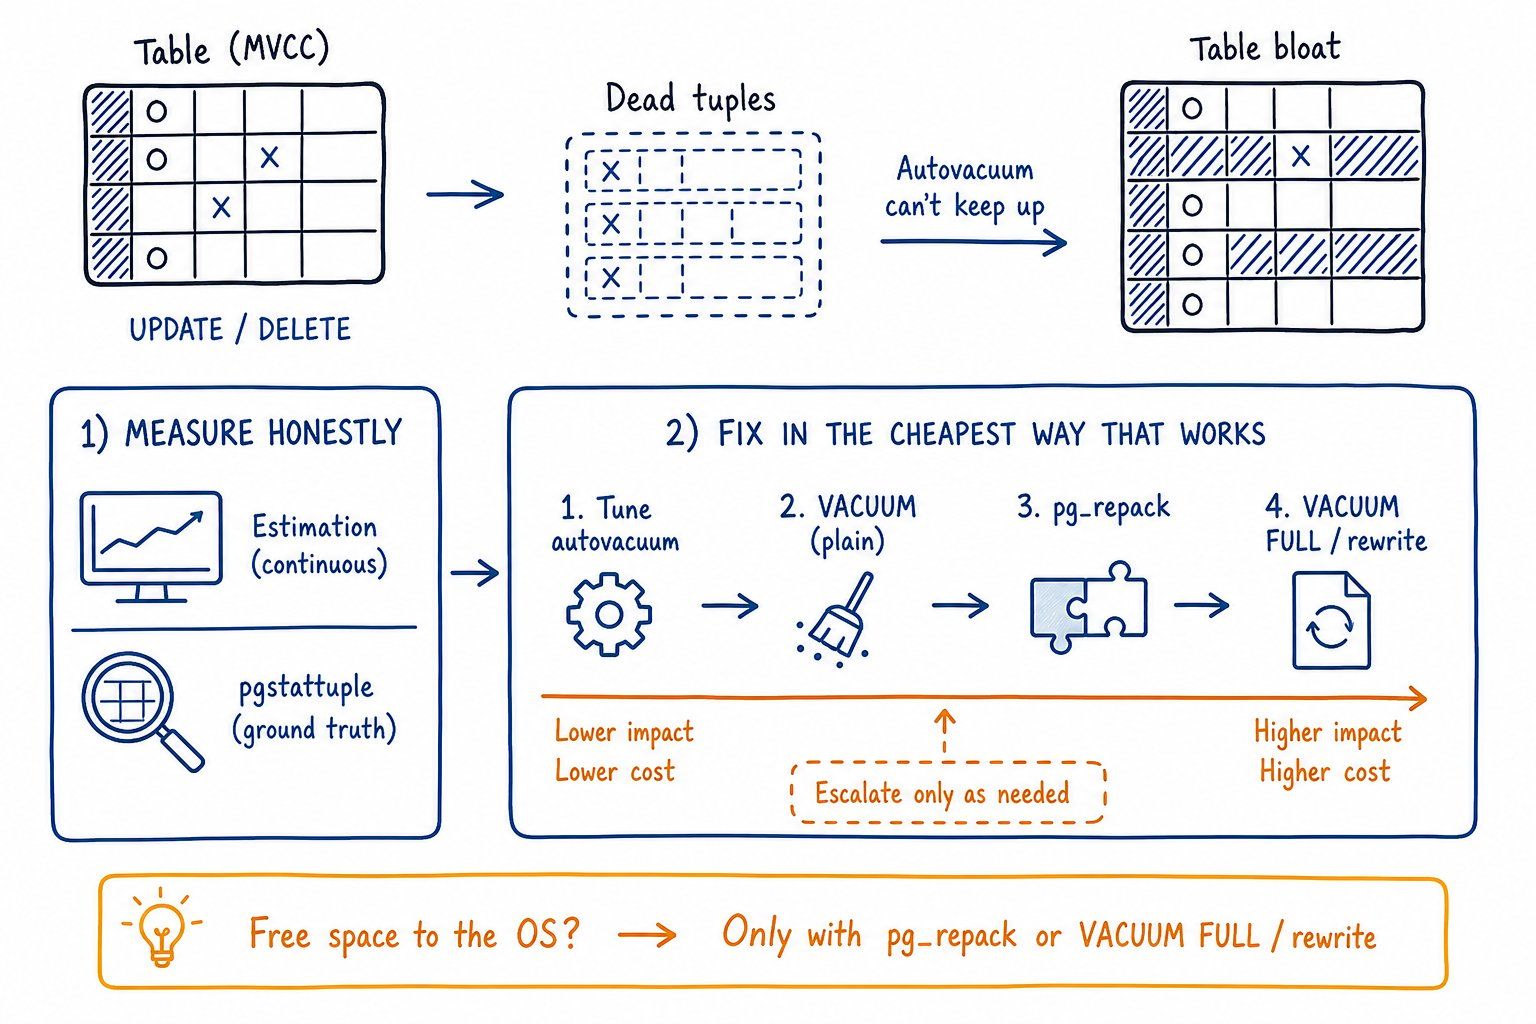
That table is bloated, and it is not a mystery. It is the predictable residue of how PostgreSQL implements MVCC, showing up because autovacuum stopped keeping pace. I recorded a short version of this on video if you want the ten-minute overview; this article is the long reference, with the exact SQL, the lock behaviour of each remedy, and the edge cases that bite you at 2am.
Where postgres table bloat actually comes from
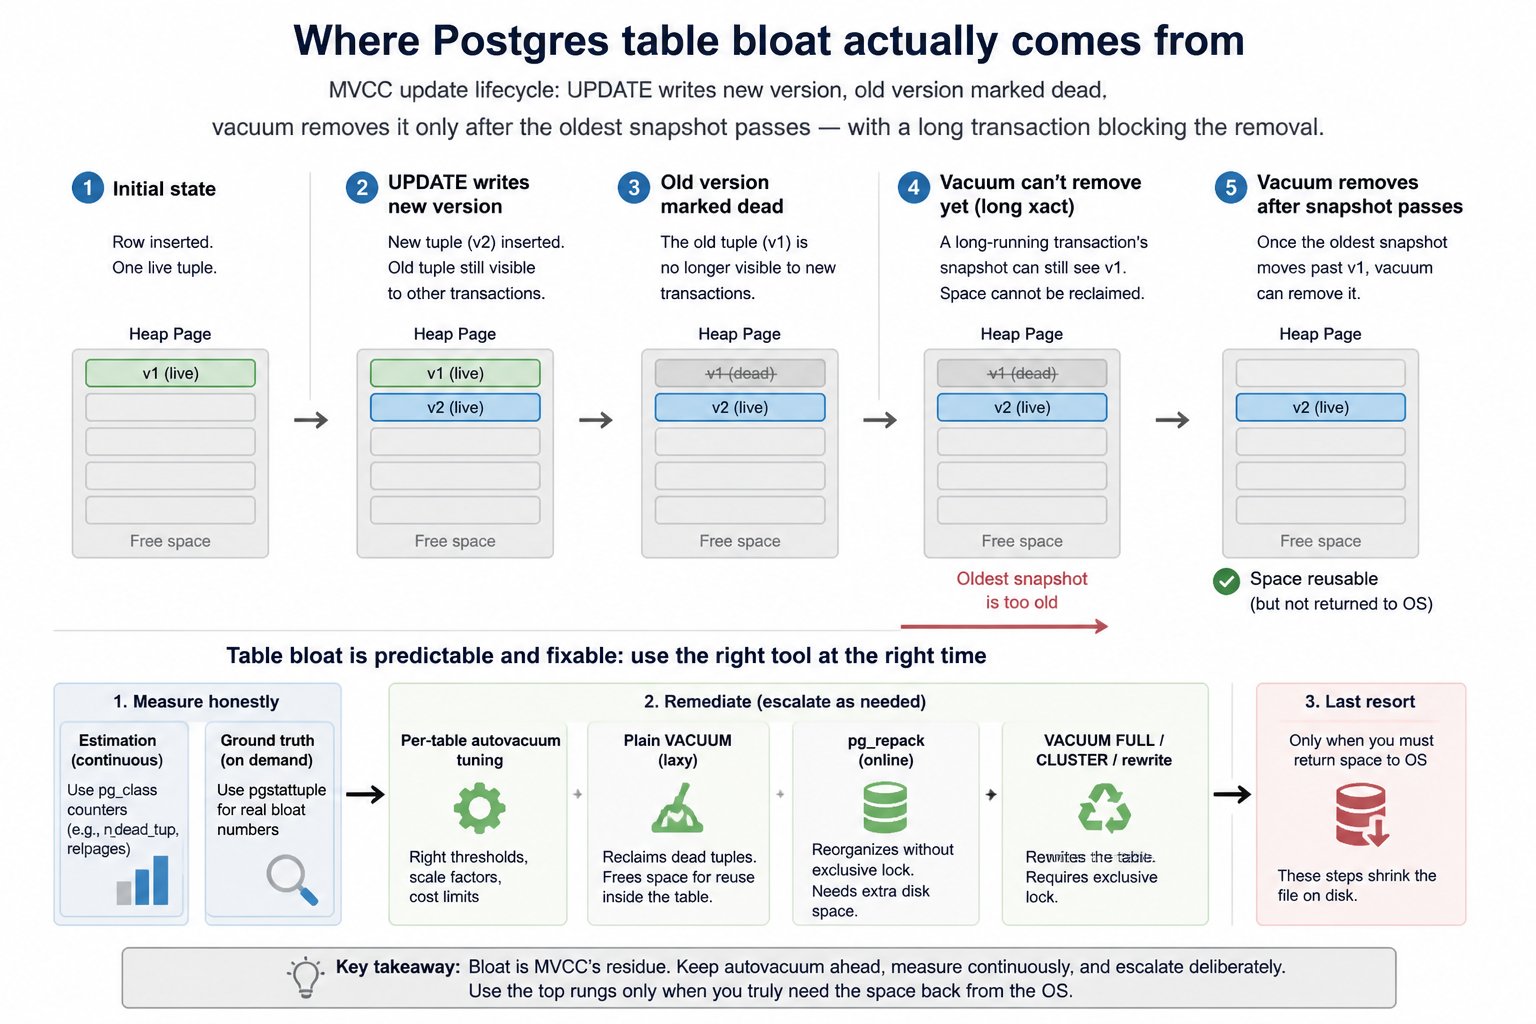
PostgreSQL never overwrites a row in place. An UPDATE writes a new version of the row and marks the previous version dead. A DELETE just marks the version dead. Those dead versions sit in the heap taking up pages until vacuum comes along and marks their space reusable.
The catch is that a dead tuple can only be removed once no existing snapshot or transaction could still need to see it. Four things routinely hold that horizon back:
1. Long-running transactions. A reporting query that runs for 90 minutes pins the xmin horizon for 90 minutes across the whole database. 2. Sessions idle in transaction. An app that opens a transaction, does one SELECT, then waits on an HTTP call is the classic offender. 3. Replication slots with an old xmin. An inactive or lagging slot holds back cleanup indefinitely. This is the one that quietly kills clusters. 4. Orphaned prepared transactions. Rare, but a PREPARE TRANSACTION nobody ever committed will freeze the horizon forever.
Find all of them in two queries:
-- Long transactions and idle-in-transaction sessions
SELECT pid,
       usename,
       state,
       now() - xact_start AS xact_age,
       now() - state_change AS state_age,
       left(query, 80) AS query
FROM pg_stat_activity
WHERE xact_start IS NOT NULL
  AND now() - xact_start > interval '5 minutes'
ORDER BY xact_start;

-- Replication slots holding back cleanup
SELECT slot_name, slot_type, active, xmin, catalog_xmin,
       pg_size_pretty(pg_wal_lsn_diff(pg_current_wal_lsn(), restart_lsn)) AS retained_wal
FROM pg_replication_slots
ORDER BY active, restart_lsn;
An inactive slot with a non-null xmin and 40 GB of retained WAL is your root cause. Nothing you do to autovacuum settings will help until you drop it or reconnect its consumer.
It also helps to stop lumping three different things under one word. Bloat proper is dead tuples plus free space that vacuum has already reclaimed but which sits unreturned inside the relation file. Fragmentation is rows scattered out of index order, which hurts range scans even when total size looks fine and is a separate problem from either of the above. And legitimately allocated free space is room a table keeps for its own near-term inserts and updates — that is not waste, it is working capacity, and treating it as bloat is how people end up rewriting tables that didn't need it.
Bloat is not always a problem
I will take a position here: a 30% dead-tuple ratio on a hot queue table can be perfectly healthy. If the table churns 2 million rows an hour and autovacuum runs every four minutes, you are looking at a steady-state working set, not waste. Compacting it would achieve nothing, because within an hour it would be right back where it started, and you would have paid for a rewrite.
The real costs of bloat are concrete:
- More pages read per row. A table where live data occupies 25% of pages needs four times as many buffer reads for a sequential scan, and it dilutes shared_buffers for everything else.
- More WAL. Vacuum has to write more, and index maintenance grows.
- Longer vacuums, which makes the problem self-reinforcing.
- Disk capacity and backup size, which is usually what makes someone finally file the ticket.
My rough thresholds before I act:
- Under 20% dead tuples and stable: leave it.
- 20-40% and stable: check the autovacuum settings, but no emergency.
- Over 40%, or any ratio that is trending up week over week: investigate now.
- Any table where
last_autovacuumis null or older than a few days while the table is clearly churning: investigate now regardless of ratio.
Trend beats absolute number. A table sitting at 35% for six months is fine. A table that went from 8% to 22% in ten days has a blocker.
Measuring bloat, option 1: estimation (cheap, continuous)
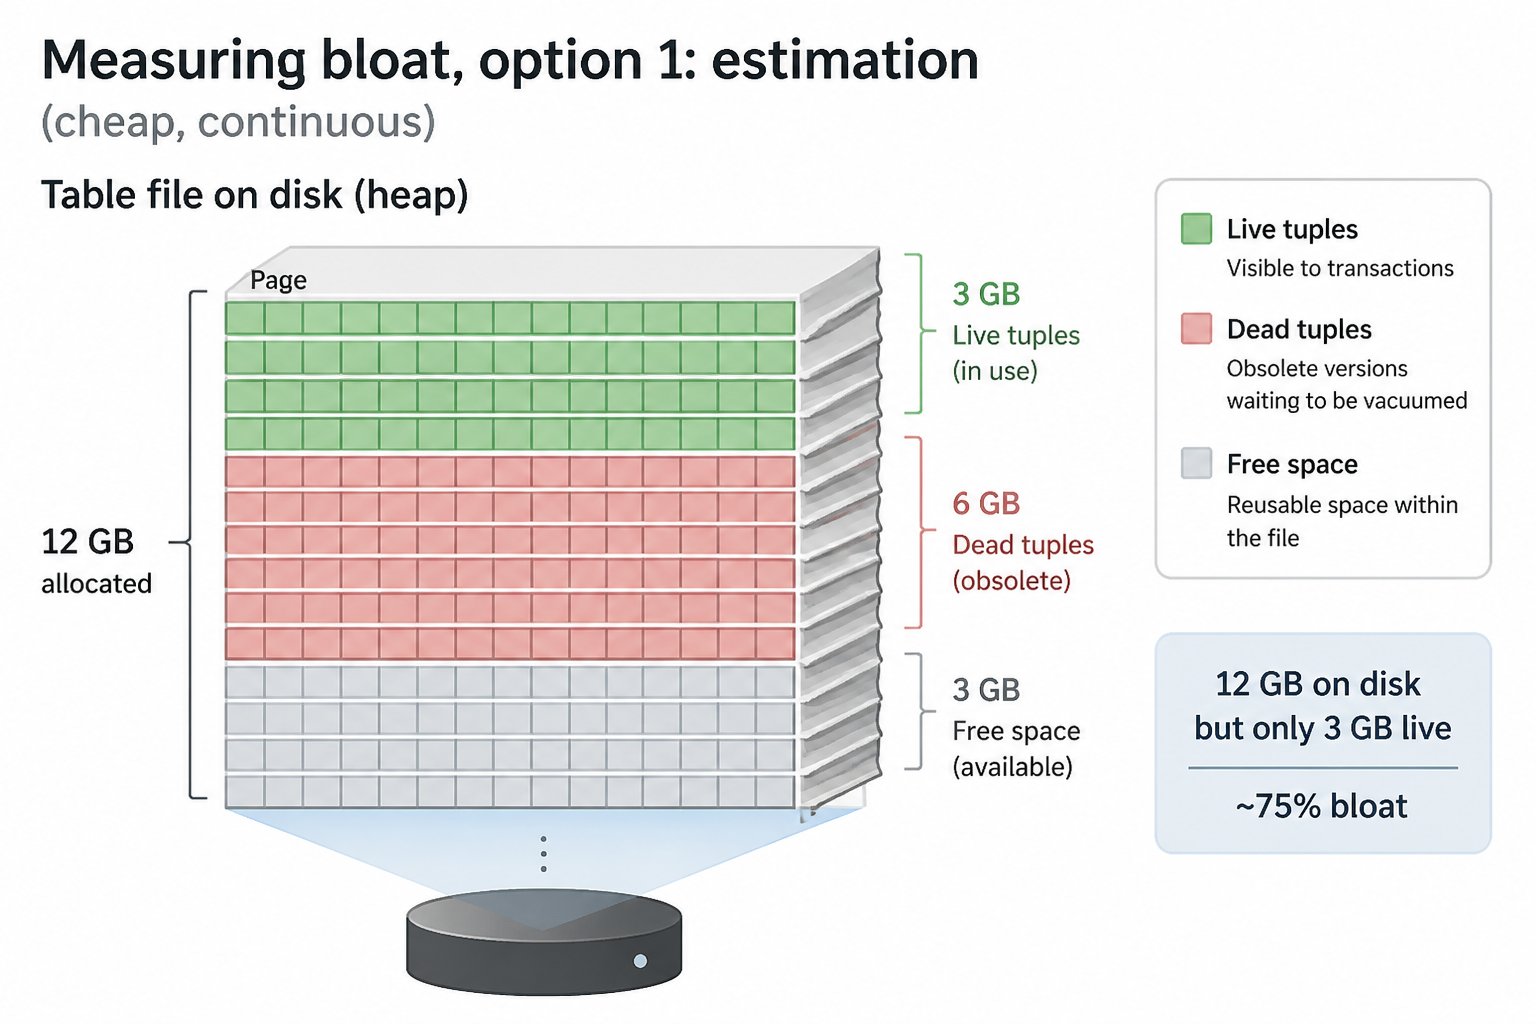
This is what you run on a schedule. Start with the statistics view:
SELECT relname AS table_name,
       n_live_tup,
       n_dead_tup,
       CASE WHEN n_live_tup + n_dead_tup > 0
            THEN round(100.0 * n_dead_tup / (n_live_tup + n_dead_tup), 1)
            ELSE 0 END AS dead_pct,
       last_autovacuum,
       last_autoanalyze,
       pg_size_pretty(pg_total_relation_size(relid)) AS total_size
FROM pg_stat_user_tables
WHERE n_dead_tup > 1000
ORDER BY n_dead_tup DESC
LIMIT 25;
Typical output on the box that started this article:
 table_name  | n_live_tup | n_dead_tup | dead_pct |      last_autovacuum       | total_size
-------------+------------+------------+----------+----------------------------+-----------
 events      |    8412337 |   19204118 |     69.5 |                            | 12 GB
 sessions    |    1204889 |     412330 |     25.5 | 2026-08-03 04:11:52.918+00 | 1421 MB
 audit_log   |   44102981 |    3011422 |      6.4 | 2026-08-02 23:40:07.221+00 | 9812 MB
The null last_autovacuum on events is the whole story. It has never been autovacuumed, or the stats were reset.
Which brings me to the error bars. n_dead_tup and n_live_tup are estimates maintained by the cumulative statistics system. They are not exact counts, they are refreshed by vacuum and analyze, and they can be reset by pg_stat_reset() or lost if the server crashes before statistics are written out. Treat them as a signal, not a measurement.
The other cheap approach compares actual pages on disk against the pages the data should occupy:
WITH est AS (
  SELECT c.oid,
         n.nspname,
         c.relname,
         c.reltuples,
         c.relpages,
         28 + sum((1 - s.null_frac) * s.avg_width) AS est_row_bytes
  FROM pg_class c
  JOIN pg_namespace n ON n.oid = c.relnamespace
  JOIN pg_stats s ON s.schemaname = n.nspname AND s.tablename = c.relname
  WHERE c.relkind = 'r'
    AND n.nspname NOT IN ('pg_catalog', 'information_schema')
  GROUP BY 1,2,3,4,5
)
SELECT nspname, relname,
       pg_size_pretty(relpages::bigint * 8192) AS on_disk,
       pg_size_pretty((ceil(reltuples * est_row_bytes / 8168)::bigint) * 8192) AS est_ideal,
       round(100 * (1 - (reltuples * est_row_bytes / 8168) / nullif(relpages, 0))::numeric, 1) AS est_bloat_pct
FROM est
WHERE relpages > 1280
ORDER BY relpages DESC
LIMIT 20;
Read that number with suspicion. It ignores column alignment padding, so a table with a bool, bigint, bool, bigint column order will read as more bloated than it is. It ignores TOAST entirely. It depends on reltuples and pg_stats, both of which go stale between analyzes. I have seen it off by 30 percentage points on wide tables with lots of nullable columns. What it is good at is ranking: the tables at the top of that list are the ones worth a closer look.
For 95% of monitoring, estimation is good enough. You are looking for outliers and trends, not accounting-grade figures.
Measuring bloat, option 2: pgstattuple (exact, expensive)
When you need ground truth on one suspect table:
CREATE EXTENSION IF NOT EXISTS pgstattuple;

SELECT * FROM pgstattuple('public.events');
-[ RECORD 1 ]------+------------
table_len | 12884901888
tuple_count | 8412337
tuple_len | 3021440112
tuple_percent | 23.45
dead_tuple_count | 1902114
dead_tuple_len | 683159472
dead_tuple_percent | 5.3
free_space | 8905612288
free_percent | 69.12Interpretation matters here. Only 5.3% of this table is currently dead tuples, but 69% is free space. Vacuum has clearly been running at some point and reclaimed the dead rows, and the space is sitting inside the file waiting to be reused. If the table's write pattern will consume that free space over the next week, do nothing. If the table is now append-mostly at a low rate, that 8.9 GB is never coming back on its own and you need a rewrite.
pgstattuple() reads every page in the relation. On a 12 GB table over decent storage that is a minute or two of sustained I/O; on a 400 GB table it is not something you fire off casually during peak hours. It takes only a read lock, so it does not block writers, but it will evict a lot of useful pages from your buffer cache.
The middle ground: pgstattuple_approx() skips pages the visibility map marks all-visible, which makes it dramatically faster on tables that are mostly static, at the cost of approximation on the skipped portion. And pgstatindex() gives you B-tree page utilisation and leaf fragmentation for a specific index.
My rule: pgstattuple() for one-off forensics on a table you already suspect, pgstattuple_approx() or the estimation queries for anything on a schedule.
Don't forget indexes and TOAST
Half the "table bloat" tickets I have handled turned out to be index bloat. Indexes on high-churn tables degrade faster than the heap does, especially when updates change indexed columns.
SELECT indexrelname,
       pg_size_pretty(pg_relation_size(indexrelid)) AS idx_size,
       idx_scan
FROM pg_stat_user_indexes
WHERE relname = 'events'
ORDER BY pg_relation_size(indexrelid) DESC;

-- TOAST relation for the same table
SELECT c.relname AS toast_table,
       pg_size_pretty(pg_relation_size(c.oid)) AS toast_size
FROM pg_class c
WHERE c.oid = (SELECT reltoastrelid FROM pg_class WHERE relname = 'events');

SELECT * FROM pgstatindex('events_created_at_idx');
Values above the TOAST threshold live out of line in a separate relation, so always reach for pg_total_relation_size() rather than pg_relation_size() when you are sizing the problem.
If the heap is fine and the indexes are shot, REINDEX INDEX CONCURRENTLY events_created_at_idx; is the targeted in-core fix. Available since PostgreSQL 12, it rebuilds without blocking writes for the duration. It is also, incidentally, exactly what pg_repack does with --only-indexes.
Rung 1: make autovacuum keep up
Autovacuum triggers when:
dead_tuples > autovacuum_vacuum_threshold + autovacuum_vacuum_scale_factor × reltuplesDefaults are threshold = 50 and scale_factor = 0.2. On a 1,000-row table that means vacuum after 250 dead tuples, which is sane. On a 100-million-row table it means 20 million dead tuples before autovacuum lifts a finger. That is where large tables go wrong, and it is why the fix is per table rather than cluster-wide.
Config card for a high-churn table:
ALTER TABLE public.events SET (
  autovacuum_vacuum_scale_factor = 0.02,   -- 2% instead of 20%
  autovacuum_vacuum_threshold    = 1000,
  autovacuum_analyze_scale_factor = 0.01,
  autovacuum_vacuum_cost_limit   = 2000,   -- let this table's worker run harder
  autovacuum_vacuum_cost_delay   = 2       -- ms
);
At 100M rows that moves the trigger from 20 million dead tuples to roughly 2 million. Cluster-level knobs worth reviewing alongside it: autovacuum_max_workers (3 by default, which is thin if you have dozens of busy tables), autovacuum_vacuum_cost_delay (2ms is a reasonable modern default; the old 20ms throttles vacuum into uselessness on NVMe), and maintenance_work_mem (1GB on a server with room, so vacuum makes fewer index passes).
Verify it is actually working rather than assuming:
SELECT relname, last_autovacuum, autovacuum_count, n_dead_tup
FROM pg_stat_user_tables ORDER BY last_autovacuum NULLS FIRST LIMIT 20;

SELECT p.pid, p.relid::regclass, p.phase,
       p.heap_blks_scanned, p.heap_blks_total,
       round(100.0 * p.heap_blks_scanned / nullif(p.heap_blks_total,0), 1) AS pct
FROM pg_stat_progress_vacuum p;
pg_stat_progress_vacuum shows autovacuum workers too, so you can watch a big table being processed in real time. More on the trade-offs in our autovacuum tuning guide.
Rung 2: plain VACUUM, and what it does not give back
VACUUM (VERBOSE, ANALYZE) public.events;Plain VACUUM takes a SHARE UPDATE EXCLUSIVE lock. Concurrent SELECT, INSERT, UPDATE and DELETE all proceed normally. It conflicts with another VACUUM, with ANALYZE, with CREATE INDEX, and with many ALTER TABLE forms, which is worth knowing if your migration tooling runs at the same time as your maintenance window.
Here is the single most common misconception in this whole topic, so I will state it flatly: plain VACUUM marks dead-tuple space reusable inside the relation and records it in the free space map. It does not normally return space to the operating system. Your 12 GB file stays 12 GB. df does not move.
The one exception: at the end of a vacuum, PostgreSQL attempts to truncate the file if there is a contiguous run of entirely empty pages at the physical end of the relation. On a busy table this almost never succeeds, because new inserts land in whatever free pages the FSM offers and one live tuple in the last page defeats the whole truncation. On a table that was bulk-deleted from the tail end and then left alone, it can reclaim a lot.
So: run VACUUM to stop the bleeding and restore reusability. Run it to get accurate statistics back. Do not run it expecting your disk graph to drop.
Rung 3: pg_repack, the production answer
When you genuinely need the space back from the OS and the table is live, this is the tool.
pg_repack creates a new copy of the table while the original stays online, captures concurrent changes into a log table via triggers, applies that backlog, then takes a brief exclusive lock to swap the relations and drops the old one. You get the compaction of VACUUM FULL without the long exclusive lock.
Prerequisites, all of which will bite you if you skip them:
- The extension must be installed server-side (
CREATE EXTENSION pg_repack;) and the client binary must match the server-side version. - The table needs a
PRIMARY KEYor aNOT NULL UNIQUEindex for a full-table repack. - You need free disk space of at least the size of the table plus its indexes. Check this before you start, not after.
# Full repack of one table
pg_repack -d mydb -t public.events

# Indexes only, heap untouched
pg_repack -d mydb -t public.events --only-indexes
Operational notes from running this a lot:
- It can be interrupted. If you Ctrl-C it, or it fails, it leaves objects behind in the
repackschema. Clean up withpg_repack -d mydb --error-on-invalid-indexchecks or by dropping the leftoverrepack.table_andrepack.log_objects manually. - The swap at the end needs an ACCESS EXCLUSIVE lock. On a table with constant traffic, that lock request can queue behind long transactions and then block everything behind it. Set a
lock_timeoutand retry rather than letting it pile up. - Repacking a 200 GB table produces 200 GB of WAL. Make sure your archive destination and replicas can absorb that.
Managed platforms: pg_repack is a third-party extension requiring server-side installation, and it is not on every provider's supported-extension list — it is not, for instance, on Amazon RDS's list as of this writing. Check your provider's extension catalogue before you plan the work. If it is not available, your options are a maintenance-window VACUUM FULL, a batched rewrite into a new table followed by a rename, or restructuring the table so the problem stops recurring. We compare the two paths in detail in VACUUM FULL vs pg_repack.
Rung 4: VACUUM FULL and full rewrites
VACUUM FULL public.events;This rewrites the entire table into a new file and returns the freed space to the operating system. It holds an ACCESS EXCLUSIVE lock for its whole duration, which blocks reads as well as writes. It also needs extra free disk space roughly equal to the size of the compacted table and its indexes, because the new copy exists alongside the old one until the swap.
On a live OLTP table this is almost never the right answer. On a 12 GB table it might be four minutes of total outage; on a 400 GB table it is hours, and every connection piles up behind it until your pooler runs out of slots.
Where it is the right call:
- You have a genuine maintenance window and the table is small enough to fit in it.
- The table is no longer written to (an archived partition, a decommissioned feature's data).
- pg_repack is unavailable on your platform and the alternatives are worse.
Alternatives worth knowing: CLUSTER rewrites the table in index order, which is useful when your access pattern is range scans on one key and your problem is fragmentation as much as bloat, but it takes the same ACCESS EXCLUSIVE lock and the same extra disk space. A batched rewrite (INSERT INTO events_new SELECT ... WHERE id BETWEEN, in chunks, then a swift rename inside a transaction) gives you control over pacing at the cost of handling concurrent writes yourself.
Preventing the next one
Partition by time and DROP instead of DELETE. Dropping a partition returns its space to the operating system immediately. Deleting the equivalent rows leaves dead tuples that must be vacuumed and does not shrink the file. For any retention-driven table, this is the strongest structural defence there is, and it converts a nightly bloat-generating DELETE into an instant metadata operation.
Exploit HOT updates. When an update changes no indexed column and the new row version fits on the same page, PostgreSQL uses a heap-only tuple and skips adding index entries entirely. That is a large reduction in index bloat. Two things make it more likely: don't index columns that change constantly, and leave page headroom. The default heap fillfactor is 100, meaning pages are packed full with no room for a same-page update. On a high-update table:
ALTER TABLE public.sessions SET (fillfactor = 85);Existing pages keep their current packing, so pair this with a repack if you want it to take effect immediately.
Avoid full-row updates on wide tables. An ORM that writes all 40 columns on every save turns a 12-byte counter increment into a 3 KB row rewrite. Update only what changed.
Monitor the causes, not just the symptom. Alert on transactions older than 15 minutes, on inactive replication slots, and on the age of last_autovacuum per table. Alert on dead-tuple ratio trend rather than an absolute threshold. Capacity planning matters too; see planning Postgres disk capacity for how to turn a growth rate into a runway.
A real incident: 177 GB from one missing shared library
A cluster I inherited had a table that reached 177 GB. Live data was a fraction of that.
The cause was not a long transaction or a bad autovacuum setting. Someone had upgraded the OS packages and a PostGIS shared library was left dangling. Autovacuum workers, when they started up and touched anything that pulled in that library, died. Not one table, not one database, cluster-wide — because autovacuum workers are shared across the whole instance, one broken library starved vacuum everywhere. The launcher kept spawning workers, the workers kept dying, and nothing got vacuumed.
That went on for 19 days. Nobody noticed because the monitoring watched bloat percentage, and bloat percentage on the important tables looked unremarkable for the first week. The ingest table ballooned, then the effects cascaded: backups grew to match the bloated on-disk footprint, WAL volume climbed, and the object-storage bucket holding both filled up. The page that finally fired was a storage alert, three problems downstream of the actual fault.
The fix was ten minutes: restore the library, restart, let autovacuum catch up, then pg_repack the worst table. The lesson took longer to internalise.
Monitor autovacuum liveness, not just bloat percentage. Bloat is the symptom; a stalled autovacuum is the disease. Concretely: alert when max(now() - last_autovacuum) across busy tables exceeds a threshold, alert when pg_stat_progress_vacuum has been empty for hours on a cluster that should always have something running, and grep your logs for autovacuum worker errors. Those signals would have caught this on day one instead of day nineteen.
Where MyDBA fits
The MyDBA free health check tracks dead-tuple ratio and estimated bloat continuously, using the estimation approach described above precisely so it can run against production without a full-table scan. It surfaces per-table recommendations (vacuum this, reindex that) and flags tables where last_autovacuum has gone stale, which is the signal that actually matters.
Being honest about the limits: estimation carries the error bars I described, and deeper forensics still means running pgstattuple by hand on the specific table you suspect. The tool tells you where to look. It does not replace the judgement about whether 35% free space on your queue table is waste or working set.

The decision table
| Situation | Action | Lock | Space returned to OS? | |---|---|---|---| | Dead tuples climbing, autovacuum lagging | Per-table autovacuum_vacuum_scale_factor / threshold | None (background) | No, but growth stops | | Long transaction or inactive slot holding xmin | Kill the session / drop the slot, then VACUUM | SHARE UPDATE EXCLUSIVE | No | | Bloat present, table will reuse the space | VACUUM (VERBOSE, ANALYZE) | SHARE UPDATE EXCLUSIVE | No (unless free pages sit at the file's end) | | Index bloat only, heap fine | REINDEX INDEX CONCURRENTLY | Brief, does not block writes | Yes, for that index | | Need space back, table is live, pg_repack available | pg_repack -d db -t schema.table | Brief ACCESS EXCLUSIVE at swap | Yes | | Need index space back on a live table | pg_repack --only-indexes | Brief at swap | Yes | | Maintenance window available, or table now read-only | VACUUM FULL | ACCESS EXCLUSIVE, whole duration | Yes | | Retention-driven data, recurring problem | Time-based partitioning, DROP old partitions | Brief on the parent | Yes, immediately |
The discipline is the escalation itself. Measure with estimation continuously and with pgstattuple when you need certainty. Fix the cause before the symptom, which usually means autovacuum settings or an xmin blocker. Run plain VACUUM to restore reusability, knowing it will not shrink the file. Reach for pg_repack only when you genuinely need the bytes back from the operating system, and reach for VACUUM FULL only when pg_repack is off the table and you have a window to spend. Most bloat tickets are resolved on rung one. The ones that need rung four usually needed a partitioning strategy six months earlier.