Replication Lag is Not a Single Metric but Four Distinct Stages — Send, Receive,
Replication Lag is Not a Single Metric but Four Distinct Stages — Send, Receive, Replay, and Feedback — Each with Its Own Bottleneck, Its Own Diagnostic Query, and Its Own Fix
Most people stare at one lag number from pg_stat_replication and call it a day. That’s like checking the traffic light color when you’re wondering why your pizza is late. The light might be green (network looks fine), but the kitchen is on fire (replay is drowning). I’ve watched DBAs burn an afternoon tuning wal_sender settings because replay_lag was climbing, when the real culprit was a standby startup process single-threading through a 40k-row-per-second write burst while the network sat idle. If you only watch one number, you’ll fix the wrong thing.
<div style="position:relative;padding-bottom:56.25%;height:0;overflow:hidden;border-radius:0.75rem;margin:2rem 0;"> <iframe src="https://www.youtube.com/embed/7FW_69NI8bw" title="Replication Lag: Causes, Measurement, Fixes" style="position:absolute;top:0;left:0;width:100%;height:100%;border:0;" allow="accelerometer; autoplay; clipboard-write; encrypted-media; gyroscope; picture-in-picture; web-share" allowfullscreen></iframe> </div>
▶ Watch on YouTube: Replication Lag: Causes, Measurement, Fixes
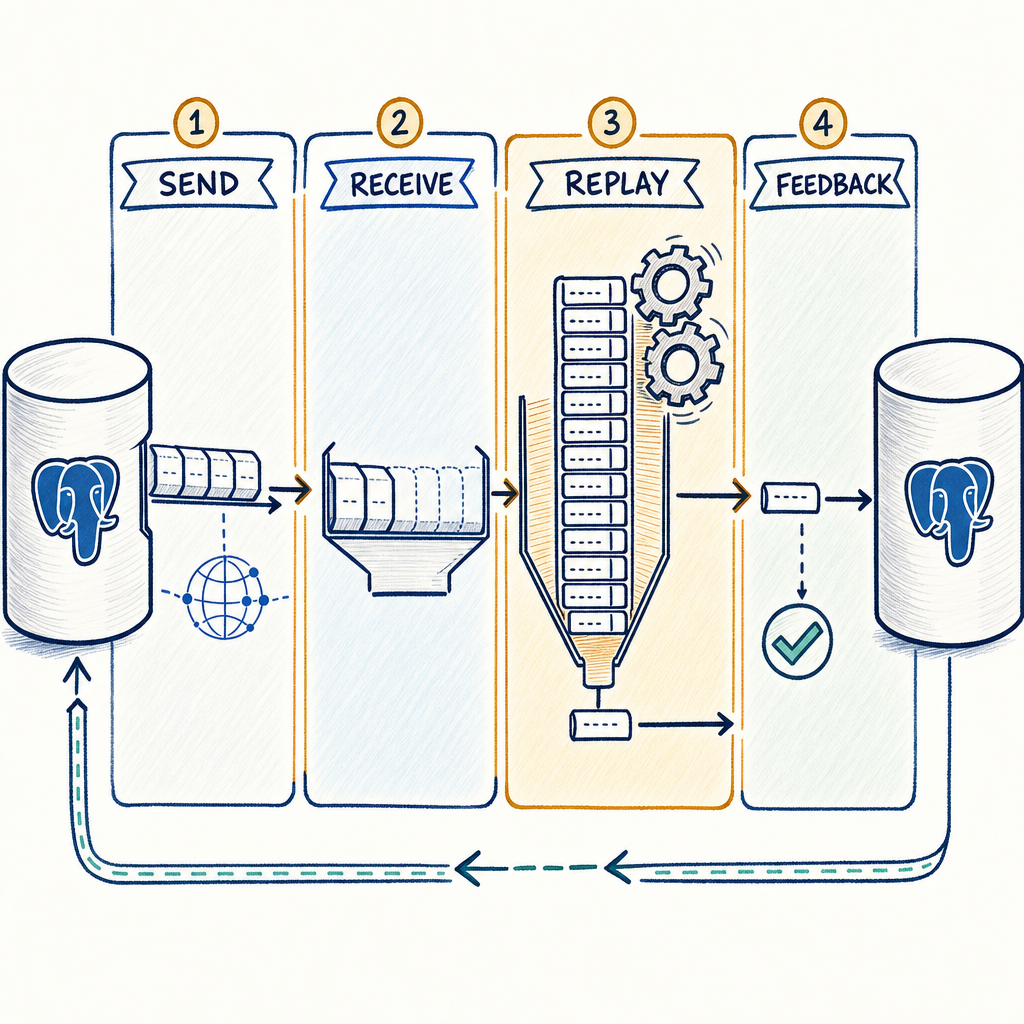
For a quick visual primer, the accompanying video walks through the four-stage pipeline in motion. Come back here for the exact SQL, the edge cases, and the fixes that actually work.
PostgreSQL replication lag is not a monolith. It breaks into four distinct stages: send (WAL shipping), receive (writing to standby disk), replay (applying changes), and feedback (reporting position back to primary). Each stage has its own bottleneck, its own diagnostic columns, and its own remediation. Conflating them leads to wasted effort — like upgrading bandwidth when your standby’s disk is crawling, or killing perfectly good queries on the replica when the primary’s WAL is stuck in a send queue. This article will give you the mental model, the SQL, and a diagnostic runbook to stop guessing.
The Lie in the Single Lag Number
Open pg_stat_replication and you’ll see a column called replay_lag. It’s a convenient interval — a primary‑side estimate of how far behind the standby is in applying WAL. Many monitoring tools graph it, and many alerts fire when it crosses a threshold. The lie is that replay_lag alone can’t tell you _why_ it’s high. It might be network congestion, slow standby I/O, a CPU‑bound replay process, or even feedback delay from hot_standby_feedback conflicts. Treating lag as one value pushes you toward generic fixes: more network throughput, faster disks, more CPU — a shotgun approach that’s expensive and often misses the mark.
A common scenario demonstrates the danger. Replication lag spikes, a monitoring alert triggers, and an engineer jumps onto the primary database. They see a high lag number, assume network saturation, and open a ticket to upgrade bandwidth. Hours later, after upgrading the pipes, the lag continues to climb. I’ve seen a case where replay_lag hovered around 30 seconds and network metrics were pristine. The DBA spent hours on TCP tuning before discovering that the standby’s flush_lag was 28 seconds — a screaming indictment of its slow SATA drives, which were also running a nightly backup at the same time. Meanwhile, write_lag was under 2 seconds. That’s the power of splitting the metric.
The Four Stages WAL Travels Through
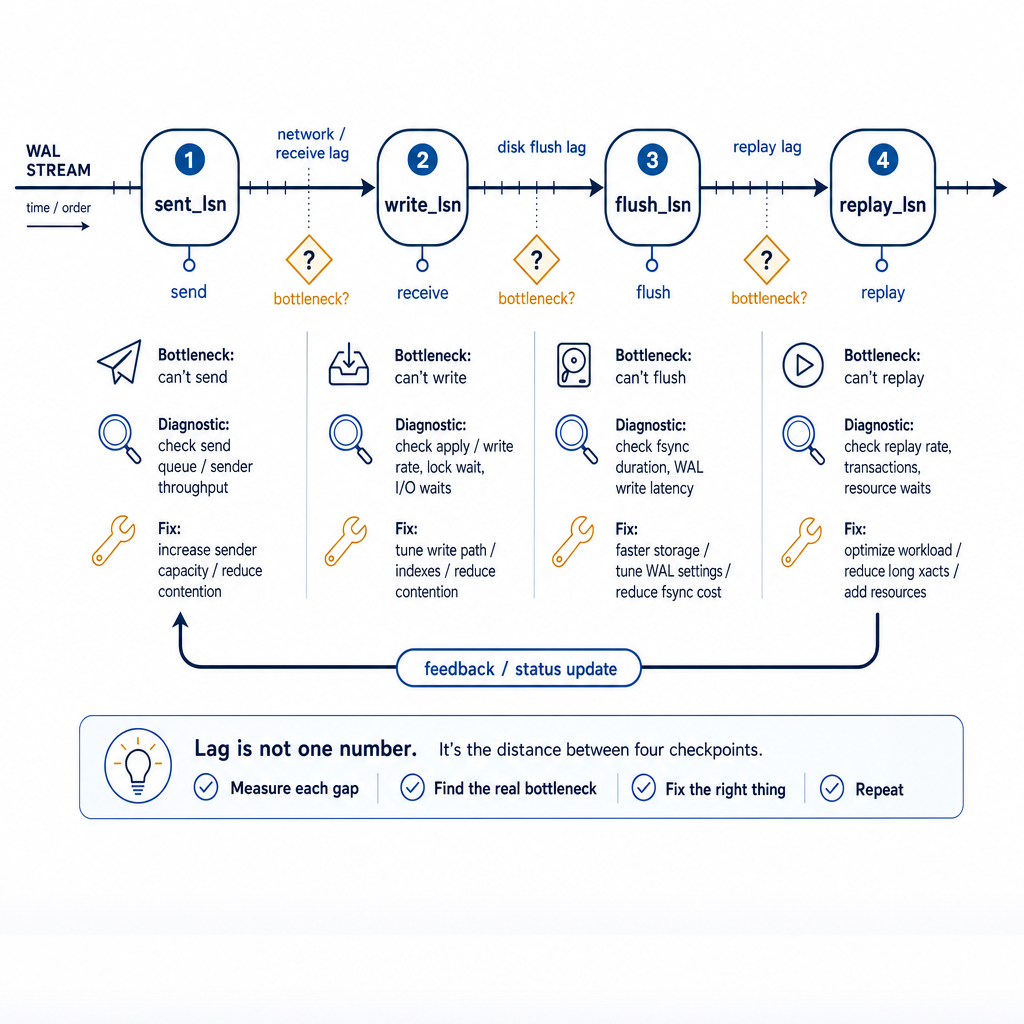
Before you query anything, you need the mental map. A WAL record starts on the primary, generated by a committed transaction. From there it moves through four distinct steps until the standby can say “I have it.”
1. Send — The primary’s wal_sender process reads the WAL from pg_wal (or from shared buffers if it’s still in memory) and ships it over the network to the standby. 2. Receive — The standby’s walreceiver writes that WAL into its own pg_wal directory, typically to a file buffer first (write) and then forces it to disk with fsync (flush). 3. Replay — The standby’s startup process (or recovery workers, in newer versions) reads the WAL from disk and applies changes to data files, one transaction at a time per relation, largely sequentially. 4. Feedback — After the standby has flushed WAL far enough, it sends an acknowledgment back to the primary, updating the replication slot’s restart_lsn and allowing the primary to release old WAL. If hot_standby_feedback is on, the standby also reports its oldest transaction ID to prevent vacuum from removing rows the standby might still need.
On the primary side, pg_stat_replication exposes LSN columns that map to each stage: sent_lsn (how far the primary has sent), write_lsn (how far the standby has written to OS buffer), flush_lsn (durably flushed on standby), and replay_lsn (applied to data files). The corresponding time‑gap columns — write_lag, flush_lag, replay_lag — measure how long it took for WAL to reach each point since it was originally generated. Feedback lag is not a direct column; it’s the round‑trip time implicit between flush_lag and the primary’s next acknowledgment cycle.
Measuring Each Stage: The Diagnostic Query
Run this on the primary to get the full picture per replication slot:
SELECT
  application_name,
  state,
  sync_state,
  -- LSN positions
  sent_lsn,
  write_lsn,
  flush_lsn,
  replay_lsn,
  -- Byte gap from write to replay
  pg_wal_lsn_diff(replay_lsn, write_lsn) AS write_to_replay_byte_gap,
  -- Time gaps (PostgreSQL 10+)
  write_lag,
  flush_lag,
  replay_lag,
  -- Feedback gap (approx) — last reply time vs flush_lag time
  reply_time,
  flush_lag - replay_lag AS feedback_component_approx
FROM pg_stat_replication;
The byte gap (pg_wal_lsn_diff(replay_lsn, write_lsn)) tells you how much WAL volume is waiting to be replayed. It’s raw backlog in bytes, and it grows when replay can’t keep up with the write rate. The time lags tell you staleness: flush_lag shows how long since a committed transaction became durable on the standby, while replay_lag shows how long since it became visible. For read-replica users, replay_lag is what matters; for disaster recovery, flush_lag is your RPO.
Always check both. A large byte gap with a small time lag means the standby is keeping pace but just went through a burst; a small byte gap with a large time lag means the problem is intermittent or there’s a feedback delay. And that feedback delay brings us to the idle‑primary trap: when the primary is quiet, replay_lag can be near zero even if the standby hasn’t seen a new transaction in minutes. We’ll get to that.
Send Lag: When the Primary Can’t Push WAL Fast Enough
A send bottleneck means WAL is piling up on the primary without reaching the standby. Symptoms: write_lag and flush_lag are both large and roughly equal, replay_lag may be similar. The network is the first suspect, but also check if the wal_sender is competing for disk reads.
To see if the wal_sender is waiting on I/O, check its wait events:
SELECT
  pid,
  wait_event_type,
  wait_event,
  state,
  query
FROM pg_stat_activity
WHERE backend_type = 'walsender';
Common wait events: WALRead (reading old WAL from disk under heavy concurrent primary load), WALSync (rare, but indicates sender is blocked on WAL flush). If you see WALRead frequently, your pg_wal may be on slow storage or contend with data‑file I/O. Separating WAL onto its own fast volume (NVMe, if possible) can help.
Network saturation is harder to diagnose from PostgreSQL itself. Use iftop or sar -n DEV on the primary to watch real-time throughput. If wal_sender_timeout is too low, the sender might disconnect under bursty load; raising it thoughtfully (say, from 60s to 5min) can keep the connection alive during temporary congestion, but don’t crank it without cause — a dead standby should be detected eventually. Query to see timeouts:
SELECT name, setting, unit FROM pg_settings WHERE name = 'wal_sender_timeout';Too many concurrent senders can also starve bandwidth. If you’re shipping to many standbys, consider cascading replication to reduce primary fan‑out.
Receive Lag: Standby Buffering but Not Writing Fast Enough
When write_lag is small (WAL arrives quickly) but flush_lag is large, the standby’s disk can’t keep up with fsync. This is a direct signal of I/O bottleneck on the standby. Check the gap explicitly:
SELECT
  application_name,
  write_lag,
  flush_lag,
  flush_lag - write_lag AS flush_delay -- should be near zero under healthy I/O
FROM pg_stat_replication;
If flush_delay is in seconds, look at standby disk activity (iostat -x 1 on the standby). Often the culprit is a nightly backup, a pg_dump, or an overzealous autovacuum on the standby that competes for I/O. Standbys are not read‑only for disk — they’re writing WAL constantly. If the standby uses the same slow disks as the primary, it might fall behind simply because the primary’s write volume is too high. The fix is straightforward: faster standby disks, or offloading competing workloads.
wal_compression can reduce the amount of data written to standby WAL, which helps if network is also constrained, but it trades CPU on the primary. If your standby’s flush_lag is the only issue, compression probably won’t help — it’s the fsync calls that hurt, not the volume.
Replay Lag: The One That Actually Matters to Users, and Why It’s Brutal to Fix
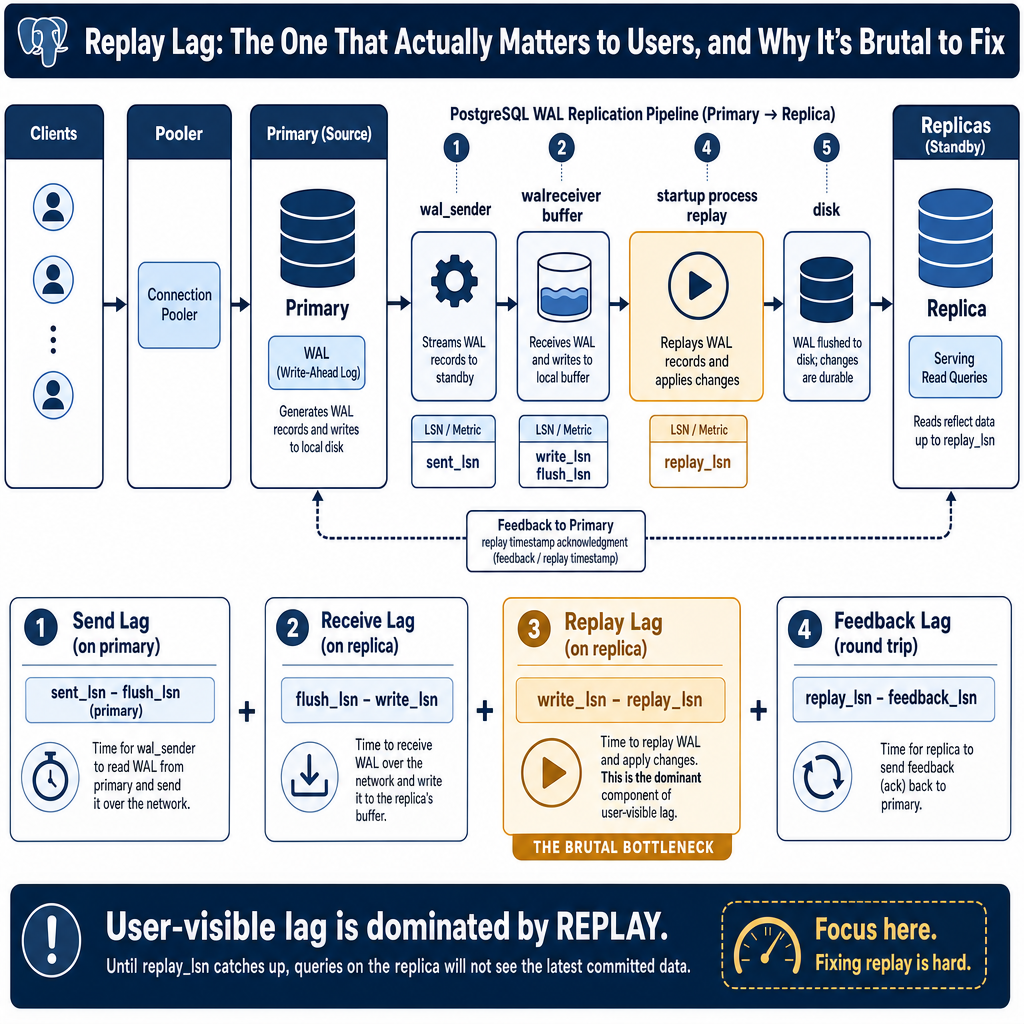
Replay is the hardest stage to speed up. By default, a single startup process applies WAL sequentially per relation. A primary with 64 concurrent write sessions can generate interleaved WAL records that the standby must apply one after another. If that standby has fewer cores or slower single‑core performance, it will fall behind. Watch replay_lag and the byte gap to confirm:
SELECT
  replay_lag,
  pg_wal_lsn_diff(replay_lsn, write_lsn) AS replay_byte_backlog
FROM pg_stat_replication;
If the byte backlog grows steadily during write bursts, your standby simply can’t apply WAL as fast as the primary generates it. Pre‑PostgreSQL 16, there is no parallelism for replay. In 16+ you can set max_parallel_apply_workers to allow limited parallel apply for transactions touching different relations, but the gains are modest and not a cure‑all. The real fix is matching standby hardware to your primary’s write load: same or better single‑core speed, and enough I/O throughput to handle WAL reads plus data‑file writes. Adding cores alone won’t help if the startup process pegs one CPU at 100%.
There’s a second common replay stall: long‑running queries on the standby. PostgreSQL cancels queries that conflict with WAL being applied, according to max_standby_streaming_delay and max_standby_archive_delay. If a query runs on the standby for 30 seconds while WAL wants to drop a table it needs, the replay will pause for up to 30 seconds, pushing replay_lag up. You’ll see replay_lag spike during query activity, then drop when queries finish. To check for conflicts:
-- on standby
SELECT
  pid,
  wait_event,
  state,
  left(query, 80) AS query_fragment
FROM pg_stat_activity
WHERE wait_event = 'recovery_conflict';
If you see many cancellation events, you can reduce max_standby_streaming_delay to favor freshness over query duration, but that will cancel longer queries. Alternatively, enable hot_standby_feedback to prevent vacuum from removing rows the standby queries still need. That removes the conflict, but at a cost — the primary can’t clean up dead tuples until the standby releases its xmin, leading to table bloat and WAL growth. I’ve diagnosed outages where enabling hot_standby_feedback on a busy read‑replica caused the primary’s pg_stat_all_tables.n_dead_tup to climb into the billions, ballooning indexes until autovacuum fell hopelessly behind. Use it as a surgical tool, not a default setting.
The Runbook: A Rapid Diagnostic Flow
1. Run the master diagnostic query on the primary. Note the four lag columns and the byte gap. 2. Send issue? Large, equal write_lag and flush_lag → check walsender wait events (WALRead?), network throughput, and wal_sender_timeout. 3. Receive issue? write_lag small, flush_lag large → iostat on standby; look for competing disk I/O. 4. Replay issue? replay_lag large, byte backlog growing → check CPU on standby (single thread pegged?), investigate long queries and recovery_conflict. 5. Feedback issue? Intermittent lag, idle-primary zero-lag trap, hot_standby_feedback bloat → review vacuum metrics and xmin horizon on the primary.
Stop staring at one number and start tracing the pipeline. Once you see the stages, the fix is rarely a mystery — it’s a specific bottleneck waiting to be unclogged.
Wrapping It Up: Make the Pipeline Visible
The four-stage mental model lifts replication diagnosis from a guessing game into a precise troubleshooting routine. With the SQL queries above and the runbook on speed-dial, you can isolate send, receive, replay, and feedback bottlenecks in minutes instead of hours. But running those queries manually on every incident still leaves a gap: you’re reacting, not preventing. That’s where a monitoring platform that understands the pipeline shines. For teams managing multiple replicas or needing proactive alerts tuned to each stage, a tool like MyDBA captures the full set of pg_stat_replication lags, visualizes them separately, and fires stage‑specific alerts before users notice. It saves you from staring at a single number and reminds you to check the right things when you’re too busy to run the diagnostic query by hand. Pair the mental model with automated visibility, and lag becomes a manageable symptom rather than a recurring mystery.