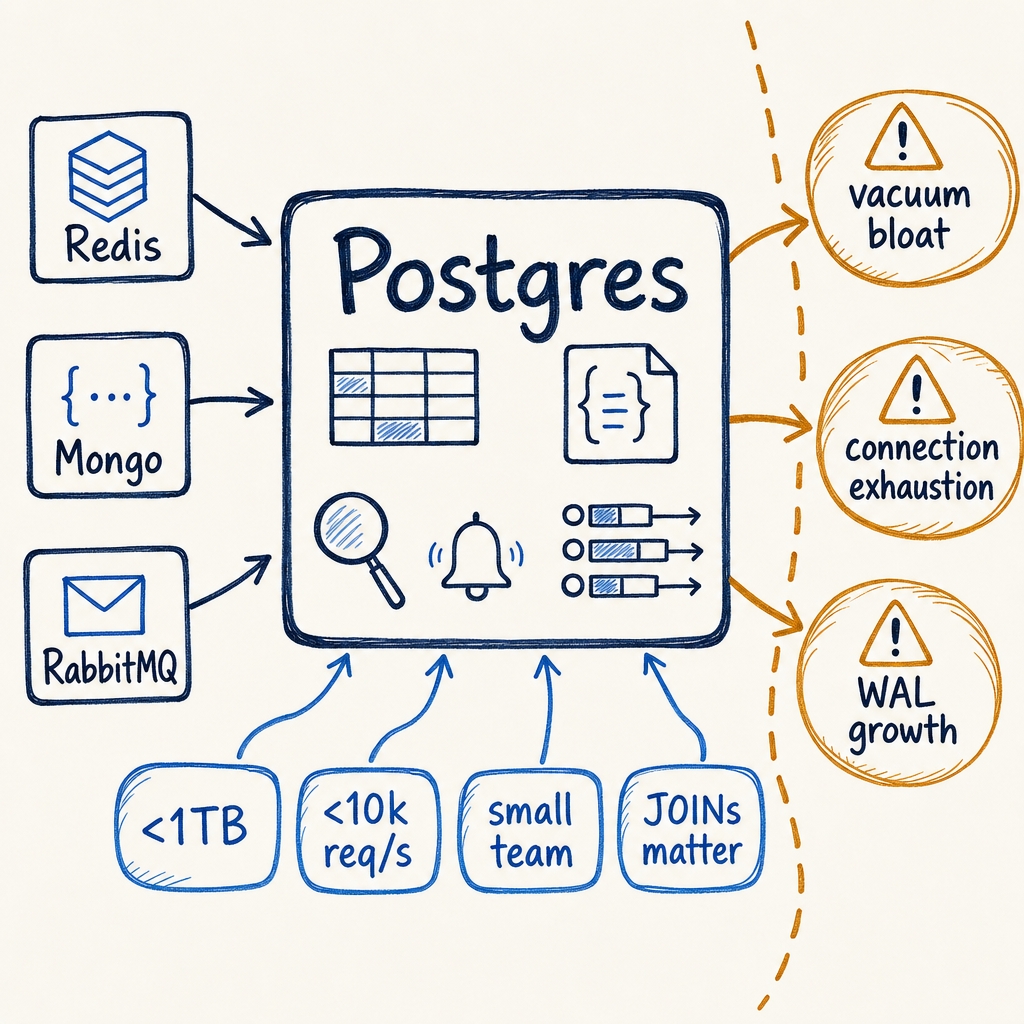
Consolidating Redis, Mongo, and RabbitMQ into Postgres is the right call when yo
The four-system tax you’re paying right now
Running Postgres alongside Redis, MongoDB, and RabbitMQ might look like “best tool for the job,” but the operational tax is real. You aren’t just managing four containers — you’re managing four sets of connection pools to size, four sets of credentials, four sets of backup/DR plans, four different on-call runbooks, and a tangle of client libraries that drift out of sync. Worse are the subtle bugs that creep in when you update order state in Postgres but the cache in Redis isn’t invalidated in the same transaction. Your system is eventually consistent, and eventually you’re waking up at 2 a.m.
The video companion to this article walks through the migration story at a high level. Here, I’m going deeper — exact DDL, the failure modes I’ve hit as a DBA, and the monitoring math you need to keep on your dashboard after you consolidate.
The decision framework: four questions before you consolidate
Consolidating isn’t dogma. I use these heuristics, born from watching hundreds of PostgreSQL instances (and a few disasters):
| Question | Consolidate likely OK if | Stay separate if | |---|---|---| | Throughput | Under ~10k req/s total across all workload types | High-frequency writes that would push WAL or connection limits | | Dataset size | Under ~1 TB total, including cache/docs/queues, and cache data fits comfortably in RAM | Multi‑TB document or cache datasets needing sharding, or cache exceeds system memory causing disk thrashing | | Team size | Under ~8 engineers, no dedicated SRE for each system | You can afford and need specialized tuning talent | | Data relationship | Cached/queued data relates to relational rows you JOIN against | Queued messages or documents are truly independent |
These aren't hard laws; they’re boundaries where I’ve seen consolidation pay off vs. backfire. The real risk is that you cross a threshold after consolidating and don’t re-check the math.
Postgres as a cache: UNLOGGED tables, not Redis-lite
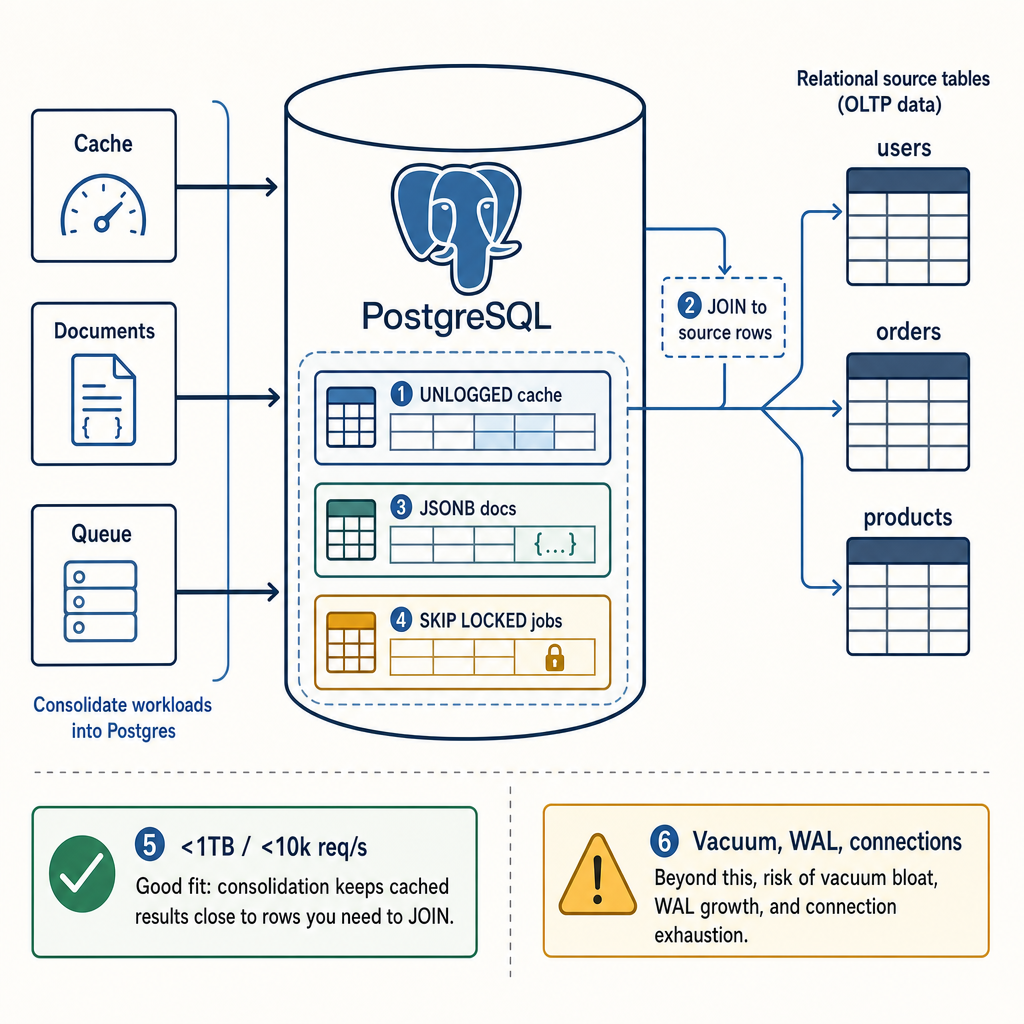
Redis serves sub-millisecond single-key GETs because it operates entirely in memory with a lightweight event loop and custom protocol. Postgres can’t match that latency — you’re looking at low single-digit milliseconds per round trip even on loopback, due to parser overhead, connection pooling handling, and schema checking. For most applications, that gap doesn’t matter; the difference is lost in network jitter and application logic. But if your cache hits are in the hot path of a latency-sensitive service, Redis still wins.
Here’s a practical cache table that uses UNLOGGED to skip WAL and approach in-memory insert speeds:
CREATE UNLOGGED TABLE cache (
    key      text PRIMARY KEY,
    value    jsonb NOT NULL,
    expires_at timestamptz NOT NULL
);

CREATE INDEX ON cache (expires_at) WHERE expires_at < now();  -- partial index for cleanup
From the docs: “Data written to unlogged tables is not written to the write-ahead log … unlogged tables are very fast but are not crash-safe.” If the server crashes, the table is truncated — you must be able to repopulate it. Cleanup can be a simple cron job that DELETE FROM cache WHERE expires_at < now(), or pg_cron if you want it inside the database. Without it, the table grows until you run out of disk, and the partial index won’t help because it needs manual VACUUM to update its visibility.
Because UNLOGGED tables reside on disk, make sure your entire cache dataset fits in system memory; otherwise, random access will degrade into disk reads that erase the consolidation benefit.
Postgres as a queue: SKIP LOCKED done right
A queue table mimics RabbitMQ consumer behaviour when you use SELECT … FOR UPDATE SKIP LOCKED LIMIT n. It’s non-blocking, workers claim rows without stepping on each other, and you can transact together with your business data — the pattern RabbitMQ can’t easily give you without two-phase commit.
Schema you’ll need:
CREATE TABLE jobs (
    id          bigserial PRIMARY KEY,
    payload     jsonb NOT NULL,
    status      text NOT NULL DEFAULT 'pending',   -- pending, processing, completed, dead
    created_at  timestamptz NOT NULL DEFAULT now(),
    not_before  timestamptz NOT NULL DEFAULT now(), -- for retry backoff
    retries     int NOT NULL DEFAULT 0,
    max_retries int NOT NULL DEFAULT 3,
    locked_until timestamptz
);

CREATE INDEX ON jobs (status, not
) WHERE status = 'pending';

-- Worker claim query
WITH batch AS (
  SELECT id
  FROM jobs
  WHERE status = 'pending'
    AND not_before <= now()
    AND (locked_until IS NULL OR locked_until <= now())
  ORDER BY created_at
  FOR UPDATE SKIP LOCKED
  LIMIT 10
)
UPDATE jobs
SET status = 'processing',
    locked_until = now() + interval '5 minutes'
FROM batch
WHERE jobs.id = batch.id
RETURNING jobs.*;
Now you claim rows in a single atomic statement. The not_before column acts as a built-in delay mechanism — if a job fails, bump retries and set not_before to now() + (retries * interval '30 seconds') for exponential backoff. Reset locked_until when the worker finishes; if the worker crashes, another process picks it up when locked_until expires. No separate dead letter exchange, no shovel plugin — just a query.
The monitoring math: watch your max_retries hit rate. If your dead letter queue in RabbitMQ used to get 50 messages a day, expect roughly similar counts here, but track jobs WHERE status = 'dead' growth in your dashboard. Unchecked, these rows silently expand your table and slow scans. Add max_retries = -1 for poison-pill jobs and set up an alert on COUNT(*) WHERE retries = max_retries.
Postgres as a document store: JSONB at scale
MongoDB tempted you with flexible schema, but JSONB delivers document flexibility with relational power — you can index deeply into nested structures and join against normalized data in the same transaction. The performance ceiling is measurable: GIN indexes on a busy table will generate write amplification, but for most workloads staying under a few hundred writes per second, the trade-off is worth the consolidation.
CREATE TABLE documents (
    id      bigserial PRIMARY KEY,
    doc     jsonb NOT NULL,
    created_at timestamptz NOT NULL DEFAULT now()
);

CREATE INDEX idx_documents_metadata ON documents USING gin ((doc -> 'metadata'));
When your JSON documents grow large (hundreds of KB each), TOAST kicks in and compresses them off-page. Reads that don't touch the doc column remain fast; pulling the full document decompresses and adds latency. You can tweak TOAST_TUPLE_TARGET per column if you know your typical document size.
The partial index we built earlier helps for temporal queries alone, but for high-selectivity lookups inside your documents, expression indexes are your secret weapon:
CREATE INDEX idx_doc_status ON documents ((doc ->> 'status'))
WHERE (doc ->> 'status') IS NOT NULL;
This index only stores rows that actually contain the key, keeping the index small. B-tree on an extracted text field brings the kind of performance you’d expect from a dedicated document store — without the operational overhead of running one.
Bringing it together: the monitoring dashboard that keeps you safe
Consolidation succeeds or fails on observability. You removed three moving pieces but concentrated all the risk into a single Postgres instance. Your dashboard must answer three questions cold at 2 a.m.:
Cache effectiveness: Track shared_buffers hit ratio alongside pg_stat_user_tables for your UNLOGGED tables. If the table bloat grows faster than your cleanup cron can handle, you'll see sequential scans creep in and CPU climb.
Queue depth: A rolling sum of COUNT(*) where status = 'pending' and not_before <= now() gives you the real queue depth — not total rows. If this number grows linearly, your workers are falling behind.
Document bloat: Monitor pg_total_relation_size on your JSONB tables. TOAST compression hides the real footprint. A doc table that was 50 GB last week shouldn't be 300 GB today without a clear explanation.
Combine these with WAL write rate and autovacuum lag metrics, and you're equipped to spot consolidation stress before users feel it. The real payoff isn't just fewer services — it's that you now debug all three patterns in the same query plan, the same transaction, the same backup. That's leverage you'll never get managing four separate systems.
When you shouldn't consolidate: the non-negotiable cases
If your Redis hit rate is measured in microseconds and your SLA counts every one of them, UNLOGGED tables won't save you — keep Redis. Similarly, if your queue depth regularly exceeds a million pending messages with bursty consumer capacity, RabbitMQ's Erlang-based scheduler and flow control are worth the operational tax.
Document workloads that need automatic sharding across multiple nodes with mongos routing represent another hard boundary. Postgres can shard with Citus or native partitioning, but both introduce planning complexity that undermines the simplicity you sought with consolidation.
One pattern I've seen work: keep a tiny Redis for sub-millisecond leaderboard operations, while all session caching and metadata lives in Postgres UNLOGGED tables. You're still trading a little operational overhead for performance where it matters, and your runbooks shrink proportionally to the systems you removed.
The consolidated schema at a glance
We've built this incrementally, but here's what your migration script should target. Each table is independent; you can pick just the queue pattern and leave the rest for later.
-- Cache: fast, repopulatable, crash-safe reads without WAL
CREATE UNLOGGED TABLE cache (
    key         text PRIMARY KEY,
    value       jsonb NOT NULL,
    expires_at  timestamptz NOT NULL
);
CREATE INDEX ON cache (expires_at) WHERE expires_at < now();

-- Queue: transactional job processing with retry backoff
CREATE TABLE jobs (
    id           bigserial PRIMARY KEY,
    payload      jsonb NOT NULL,
    status       text NOT NULL DEFAULT 'pending',
    created_at   timestamptz NOT NULL DEFAULT now(),
    not_before   timestamptz NOT NULL DEFAULT now(),
    retries      int NOT NULL DEFAULT 0,
    max_retries  int NOT NULL DEFAULT 3,
    locked_until timestamptz
);
CREATE INDEX ON jobs (status, not_before) WHERE status = 'pending';

-- Documents: flexible schema with relational power
CREATE TABLE documents (
    id          bigserial PRIMARY KEY,
    doc         jsonb NOT NULL,
    created_at  timestamptz NOT NULL DEFAULT now()
);
CREATE INDEX idx_documents_metadata ON documents USING gin ((doc -> 'metadata'));
Each table can be tuned independently — add partitioning to jobs by month for aged cleanup, move cache to a dedicated tablespace on NVMe storage, or apply row-level security to documents if multi-tenancy matters. The migration doesn't demand all three at once; phase them in and measure each in production before retiring the external service.
Real failure modes from production and how to survive them
I've run consolidated workloads across hundreds of instances. Here are the actual outages, not the theory.
UNLOGGED table truncation on crash: An EC2 hardware fault caused a host restart. The UNLOGGED cache table came back empty, and the application cache-warming routine hadn't been tested in production. Users hit the origin database directly with a cold cache, queries stacked up, and max_connections was hit in under two minutes. Fix: the cache repopulation path must be tested with every deployment, and your health check must verify the cache table has expected row counts post-startup.
Queue lock timeout cascade: A batch job claimed 1,000 rows, updated them to processing, then crashed. locked_until was set to 24 hours for no good reason. The queue appeared empty to monitoring (rows weren't pending), but work stopped. Fix: locked_until must be short — five to ten minutes — and your worker's heartbeat must extend it. Add a separate monitoring metric for status = 'processing' AND locked_until > now() to catch stuck jobs.
JSONB GIN index bloat: A table receiving 200 writes/second with a GIN index on a jsonb column grew the index faster than autovacuum could clean it. The bloated index used 4x the disk of the table itself. Fix: increase autovacuum_vacuum_scale_factor on that table or switch to autovacuum_vacuum_insert_threshold. GIN indexes need aggressive vacuum tuning — the defaults are for B-tree indices and will burn you.
Understanding these failures before you deploy means your on-call runbook already has the answer when the alert fires. Write the runbook first, then consolidate.
The real win: developer velocity and transactional integrity
The operational savings are tangible, but the developer experience is where consolidation shines. When an API call needs to update a document, enqueue a notification job, and invalidate a cache entry atomically, you can:
BEGIN;
UPDATE documents SET doc = jsonb_set(doc, '{status}', '"published"')
WHERE id = $1;

INSERT INTO jobs (payload) VALUES (jsonb_build_object('notify', 'doc-published', 'doc_id', $1));

DELETE FROM cache WHERE key = 'doc:' || $1;
COMMIT;
This single transaction changes the document, enqueues the side effect, and invalidates the cache — exactly once, guaranteed by MVCC. You don't need a two-phase commit distributed across Redis, RabbitMQ, and MongoDB. You don't need to reason about partial failures, compensating transactions, or eventual consistency windows. The transaction commits or it doesn't.
I've watched teams shed entire microservices because the queue table replaced their event bus, the document table replaced their search indexing pipeline, and the cache table eliminated the Redis-as-scratchpad anti-pattern. The biggest surprise was not the infrastructure savings — it was the mentoring bandwidth freed up when junior engineers no longer had to learn four different data stores and their idiosyncratic failure modes.
You'll still need Redis for sub-millisecond operations and RabbitMQ for extreme throughput, but for the 95% of workloads that fall within Postgres's comfort zone, removing three systems is one of the highest-leverage architectural decisions you can make.
Getting started with your consolidation project
Don't try to replace all three at once. Start with the streamline your database operations with expert guidance and monitoring tools at MyDBA — check out their monitoring templates that make visibility into cache hit rates and queue depth straightforward. By phasing these migrations incrementally and measuring each change, you'll build the confidence to eliminate unnecessary complexity without introducing new failure modes.